Introduction
Canopy photosynthesis is governed not only by the photosynthetic process itself, but also by the canopy architecture. Thus canopy photosynthesis is a closely related determinant of productivity as it takes into account the genotypic variation in both light conversion and interception efficiencies (Monsi et al., 1973;Zelitch, 1982). Canopy characters that improve light interception and photosynthetic efficiency are discussed by Beadle et al., (1985). Photon flux density at different levels in a canopy is often the major factor determining the rate of CO2 assimilation of individual leaves (Nobel and Long, 1985).The photosynthetic characters of leaves at different canopy positions are acclimatized to their own micro-environment. The major differences in photosynthetic activity in sun and shade adapted leaves within a canopy are correlated with differences in the concentration of the electron transport chain, photosystem activity and photosynthetic enzyme activity (Beadle et al., 1985). Therefore, it appears that canopy photosynthesis is naturally optimized by partitioning of photosynthetic capacity among the leaves with respect to natural light exposure. Thus gas exchange characters of a leaf from a particular canopy position cannot be considered necessarily to represent the photosynthetic characters of the entire canopy. Hence, estimating canopy photosynthesis has become an important aspect of plant productivity research (Monsi et al., 1973; Beadle et al., 1985). Light saturated rate of photosynthesis (Amax), varies with the position of leaves in the canopy, which could be attributed to adaptations to changes in incident irradiance (Acock et al., 1978). Fraction of intercepted radiation depends on two major parameters, the leaf area index (LAI) and the canopy light extinction coefficient (k) (Nobel and Long, 1985). In a mature Hevea plantation, most of the leaves are found under limiting light levels (Nugawela et al., 1995). The physiological yield determinants may be different in areas receiving full and limiting light levels in the canopy. Thus, the capacity for dry matter production by leaves in the light limiting areas of the canopy will have a significant influence on the economic yield of the crop.
The observation made by Nataraja and Jacob (1999) suggested that rubber clones with the highest net assimilation rate and quantum yield of net CO2 uptake under low irradiance together with a low light compensation point (LCP) for CO2 uptake, might tolerate shade better than other clones.In terms of increasing productivity, a lower LCP is definitely helpful, because a lower LCP will enable the plant to maintain a positive net photosynthetic rate even at very low light intensities. A lower LCP would help crop canopies to maintain a positive carbon balance and thereby continue to accumulate dry matter even under very low absorbed radiation (De Costa, 2000).Since, exploitation of latex could influence the carbon fixing capacity due to its effects on carbon sink, present study aims to investigate the clonal differences in canopy photosynthetic capacityand light response parametersof tapped and untapped trees of twoHeveabrasiliensis genotypes, i.e. RRISL 211 and RRIC 121. Moreover, attempts have been made to develop correlations between canopy photosynthesis and light response parameters of Hevea with reference to exploitation
Material and Methods
The present study was a supplement to a longer experiment to determine the feasibility of early commencement of tapping in three contrasting Heveagenotypes. Mature eight –year-old trees, from two Hevea genotypes, i.e. RRIC 121 and RRISL 211 were selected and all cultural practices were performed according to recommendations of the Rubber Research Institute of Sri Lanka. All gas exchange and related measurements were made during the period November 2002-January 2003, which are the peak yielding months of the year. Four tapped and untapped trees from each of the two genotypes were selected. The tapped trees had been opened at a girth of 50 cm in April 2001 and were under the 1/2Sd/3 + Ethrel stimulation(Annon, 1999). A single tapper was employed for tapping throughout the experiment.
Measurement of Photosynthesis of Individual Leaves from Different Strata
Carbon dioxide assimilation and associated gas exchange parameters were measured using a portable Infra Red Gas Analyzer, IRGA (LI – 6400, LICOR Inc., Lincoln, NE, USA). The canopy of each tree was visually divided into three strata as upper (at approximately 18-22 m above ground level), middle (14-18 m) and lower (10-14m). Because it was extremely difficult to reach the leaves of a mature rubber canopy with the above instrument, measurements were made on detached leaves. Twigs were cut from each stratum with a sharp knife and immediately put into a bucket of water. Thereafter, the middle leaflet of a healthy, bright green, mature leaf was separated (about 2 cm above the leaf base) from the petiole and cut ends were immediately put into small beaker of water and taken to the laboratory in air-tight container. The leaves samples were kept for about two hours in controlled environment at 30oC with low light (approximately 100 mmol m-2 s-1) before photosynthesis was measured. Nugawela (1989) has shown that a photosynthetic rate of detached leaves which kept in controlled environment at 30oC with low light (approximately 100 mmol m-2 s-1) were similar to intact Hevea leaves attached to the tree. Similarity of photosynthetic rates of carefully detached leaves to intact leaves has also been shown by Aylett (1985) and Pereira et al.,(1986).
Photosynthetic rate, measured as the rate of CO2 uptake of individual leaves was measured at different levels of photosynthetically active radiation (PAR), i.e. 0, 25, 50, 75, 100, 200, 400, 800 and 1200 mmol m-2 s-1 by changing the incident PPFD using an in built artificial light source; 6400 – 02B Red / Blue (LICOR Inc., Lincoln, NE, USA) under ambient CO2 levels. Leaf temperature and water mole fraction were controlled at 30oC (± 0.01) and 25 mmol H2O mol-1 air (±0.02) respectively throughout the study.
Photosynthetic light response of individual leaves was characterized by fitting the asymptotic exponential function (Boote and Loomis, 1991).
Light response curves were fitted separately for the four replicate measurements.Light response parameters, i.e. Light-saturated maximum photosynthesis(Amax), Quantum efficiency (QE), Light saturation point (LSP) and Dark respiration (Rd) rateswere estimated based on the asymptotic exponential curve.Significance of the variation of photosynthetic light response parameters between the four replicate measurements of a treatment was tested.As the estimated photosynthetic parameters were not significantly different among the replicates, data of the four replicates were pooled and the parameter values common for each individual treatment combination were obtained by fitting the asymptotic exponential curve for the pooled data sets.
Statistical Analysis
Analysis of Variance (ANOVA) of the measured data was carried out using the SAS (SAS Institute, Inc., Cary, NC, USA) statistical package. ANOVA revealed that the two way and three way interactions between treatment factors were not significant at p>0.05. To evaluate the significance between all possible pairs of treatment means, mean separation of treatments was performed with Duncan’s Multiple Rang Test (DMRT). Linear correlation analysis was used to determine the strength of the relationships between light response parameters and their response to exploitation of Hevea.
Results
Clonal Differences in Light Response Parameters
The pattern of variation in leaf photosynthetic rates in relation to canopy position was similar in tapped and untapped trees of both clones (Fig.1). The CO2 assimilation rates were highest in the leaves of the upper stratum, while it was lowest in the leaves of the bottom stratum. Furthermore, significantly higher assimilation rates were shown in RRISL 211 in both tapped and untapped trees (Fig.1. c and d). There was significant variation between two clones in the corresponding maximum light-saturated photosynthetic rate in all canopy strata.
Light-Saturated Maximum Photosynthesis (Amax) of Tapped and Untapped Trees
In both clones, when averaged across the three strata, tapped treatment had a higher Amax than untapped treatment (Tables 1 and 2). However, in the upper canopy layer of both clones, Amax was higher in the untapped trees as compared to the tapped trees (Tables 3, 4, 5 and 6). In RRISL 211, Amax of both middle and bottom canopy layers was greater in the tapped treatment (Table 3).On the other hand, in RRIC 121, Amax in the middle canopy layer was also slightly higher than that in the untapped treatment (Table 6). However, the bottom canopy layer showed the opposite trend with the tapped treatment having a higher Amax (Table 5).In both clones, a clear reduction of Amax was evident from leaves in upper strata through middle strata to the bottom of the canopy (Tables 1 and 2). Photosynthetic capacities, (i.e. Amax) of leaves from all strata of RRISL 211 were greater than the corresponding strata values in RRIC 121. In each clone, Amax of the tapped trees was greater than the Amax of untapped trees, and this difference was greater in RRISL 211 than RRIC 121.
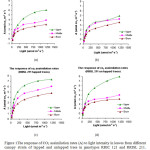 |
Figure 1: The response of CO2 assimilation rates (A) to light intensity in leaves from different canopy strata of tapped and untapped trees in genotypes RRIC 121 and RRISL 211. Measurements were made under controlled conditions optimal for photosynthesis (Temperature = 30oC and VPD < 1.2 kPa). Each point is the mean of four observations. Click here to View figure |
is most limiting in the bottom leaf layer.eater than in the upper and middle layers. 21.n of Amax has occured clones. Quantum efficiency (QE) of tapped and untapped trees
The Quantum efficiency is the efficiency of the light reaction under shaded conditions. In both clones, though statistically not significant, bottom layer had relatively higher QE than upper and middle layers (Tables 1 and 2). There was no substantial difference in QE between upper and middle layers. Quantum efficiency of the bottom layers of the RRIC 121 was greater than the corresponding value in RRISL 211. In both clones, though statistically not significant, the tapped treatment had higher QE than the untapped treatment. Further, this difference was greater in RRISL 211 than in RRIC 121 (Tables 1and 2). In RRISL 211 increases in QE in response to tapping were observed in the middle and bottom canopy layers, but not in the top layer (Tables 3 and 4). In both clones QE of all canopy layers did not show a consistent variation between tapped and untapped treatments (Tables 3, 4, 5 and 6).
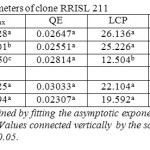 |
Table 1: Light response parameters of clone RRISL 211 Click here to View table |
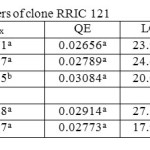 |
Table 2: Light response parameters of clone RRIC 121 Click here to View table |
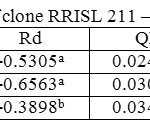 |
Table 3: Light response parameters of clone RRISL 211 – tapped trees Click here to View table |
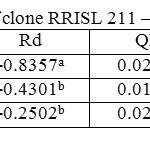 |
Table 4: Light response parameters of clone RRISL 211 – untapped trees Click here to View table |
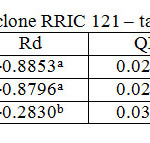 |
Table 5: Light response parameters of clone RRIC 121 – tapped trees Click here to View table |
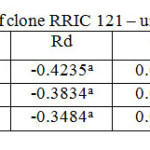 |
Table 6: Light response parameters of clone RRIC 121 – untapped trees Click here to View table |
Light Compensation Point (LCP) of Tapped and Untapped Trees
RRISL 211 showed a clear reduction in LCP from upper to bottom layers. In both clones, LCP of the bottom layer was considerably lower than the LCP of upper and middle layers (Table 1 and 2). In both clones, there was no substantial difference in LCP between the upper and middle layers. In both clones, the tapped treatment had a greater LCP than the untapped treatment. The difference between LCP of tapped and untapped treatments was greater in RRIC 121 than in RRISL 211 (Tables 1 and 2). In clone RRISL 211, LCP of the different canopy layers did not show a consistent pattern of variation between tapped and un tapped treatments (Tables 3 and 4). However, in RRIC 121, the LCP of all canopy layers were low in the untapped trees (Table 6).
Light Saturation Point (LSP) of Tapped and Untapped Trees
LSP was highest in the upper canopy layer and lowest in the bottom and intermediate in the middle (Table 1 and 2). The same trend was evident in both clones. Clone RRIC 121 had greater LSP for each respective layer than RRISL 211.There was a clonal difference in the response of LSP to tapping. In RRIC 121, tapping increased the LSP whereas the opposite occurred in RRISL 211 (Tables 3 and 5). Anyhow, analysis of the respective LSP in the different canopy layers of RRISL 211 showed an unusually high LSP in the middle canopy layer of the untapped treatment (Table 4). This unusually high value may have increased the mean LSP of the untapped treatment above the LSP of the tapped treatment in RRISL 211 (Table 6.1). Except for this canopy layer, the LSP of the rest of the canopy layers in both clones showed clear increases due to tapping (Tables 3 and 5).In clone RRISL 211, LSP of the different canopy layers did not show a consistent pattern of variation between tapped and un tapped treatments (Tables 3 and 4). However, in RRIC 121, the LSP of all canopy layers were lower in the untapped trees (Table 6).
Dark Respiration (Rd) Rates of Tapped and Untapped Trees
In both clones there was a gradual reduction in Rd rates when moving from upper through middle to bottom layers of the canopy (Tables 1 and 2). Rd of the bottom layers was substantially lower than in the upper and middle layers in both clones. The Rd rates of corresponding canopy layers were always slightly greater in RRISL 211 than in RRIC 121.
In both clones, the tapped treatment had greater Rd rates than the untapped treatment. However, detailed analysis of Rd rates in the different canopy layers between tapped and untapped treatments showed clonal differences. In RRISL 211, although Rd increased due to tapping in the middle and bottom canopy layers, a substantial reduction in Rd was evident in the upper layer. In contrast, in RRIC 121 there were substantial increases in Rd due to tapping in the upper and middle layers, while the bottom layer showed a decrease (Tables 1 and 2).
Nevertheless, in both clones Rd of all canopy layers did not show a consistent variation pattern between tapped and untapped treatments (Tables 3, 4, 5 and 6).
Clonal Differences in Canopy Photosynthesis
Canopy photosynthetic rates on a daily basis of RRISL 211, was 20% greater than that of RRIC 121 (Table 7). Further, tapped trees of RRISL 211 gave a 6% greater canopy photosynthetic rate than the corresponding untapped trees. In contrast, tapped trees of RRIC 121 showed only 1% greater canopy photosynthetic rate as compared to untapped trees (Tables 9 and 10). Contribution from the different canopy layers to the total canopy photosynthesis was similar in both clones. The largest contribution came from the top layer while the lowest contribution came from the bottom layer (Tables 7, 9 and 10). Furthermore, in clone RRISL 211, top canopy layer had a 5% greater leaf area index than corresponding layer of RRIC 121 (Table 8). In contrast, RRIC 121 had a 9% greater leaf area index in the middle canopy layer.
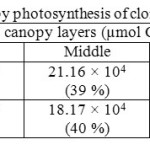 |
Table 7: Overall estimation of canopy photosynthesis of clones RRISL 211 and RRIC 121 Click here to View table |
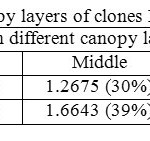 |
Table 8: Partial LAI in different canopy layers of clones RRISL 211 and RRIC121 Click here to View table |
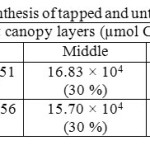 |
Table 9: Estimated canopy photosynthesis of tapped and untapped trees of clone RRISL 211 Click here to View table |
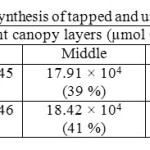 |
Table 10: Estimated canopy photosynthesis of tapped and untapped trees of clone RRIC 121 Click here to View table |
Linear Correlation Analysis between Light Response Parameters
Correlation Coefficients for the Overall Data Set
There was no significant correlation between Amax and quantum efficiency (QE). On the other hand, LCP and LSP had significant positive correlations with Amax. QE was significantly positively correlated with LSP and Rd. Furthermore, Rd had significant positive correlations with LCP and LSP (Table 11).
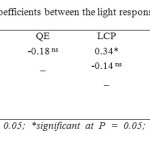 |
Table 11: Linear correlation coefficients between the light response parameters for overall data Click here to View table |
Correlations Between Tapped and Untapped Treatments
Correlations between parameters of the light response curve were broadly similar between tapped and untapped treatments. The only difference was the absence of significant correlations between Amax and LSP in the untapped treatment and between QE and Rd in the tapped treatment (Table 12).
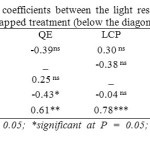 |
Table 12: Linear correlation coefficients between the light response parameters of tapped (above the diagonal) and untapped treatment (below the diagonal) Click here to View table |
Correlations Between Clones
Some clonal differences were evident in correlations among parameters of the light response curve. Though RRIC 121 showed significant correlations between Amax and LSP, between QE and Rd and between LSP and Rd, they were absent in RRISL 211 (Table 13).
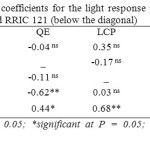 |
Table 13: Linear correlation coefficients for the light response parameters of clone RRISL 211 (above the diagonal) and RRIC 121 (below the diagonal) Click here to View table |
Discussion
Clonal Differences in Canopy Photosynthesis of Hevea
There were significant genotypic differences in parameters of the light response curves of in different canopy strata (Fig. 1). The light saturated assimilation rate (Amax) may be considered as a measure of the photosynthetic capacity of the leaf (Long and Hallgren, 1985). The results obtained from this study showed a clear reduction of Amax from leaves in the upper strata through middle strata to the bottom of the canopy in both clones (Tables 1 and 2). This indicates that photosynthetic capacity decreased with increasing canopy depth. In each canopy stratum, leaves adapt to the level of light generally prevalent at that stratum. It is well known that leaves developed in high light have more photosynthetic apparatus per unit leaf area (Kwesigo et al., 1986; Wolf and Blaser, 1971) and vice versa. This could be the reason for the decreasing photosynthetic capacity with increasing canopy depth.Furthermore, it was observed that in each clone, Amax in the tapped trees were greater than that of untapped trees. This trend was more prominent in clone RRISL 211 (Tables 1 and 2). The Amax increases in the tapped treatment could probably be due to the removal of assimilates during tapping in the form of latex. Such removal of assimilates could stimulate the photosynthesis process through the source-sink effect. Analysis of Amax values in different canopy layers showed that in RRISL 211, stimulation of Amax had occurred in the middle and bottom canopy layers. On the other hand, in clone RRIC 121, stimulation of Amax due to tapping had occurred only in the bottom canopy layer. This also explains the comparatively lower stimulation of Amax due to tapping in clone RRIC 121 as compared to RRISL 211.
Clonal Differences in Light Response Parameters of Hevea
The magnitude of Amax and light saturation point (LSP) play a very important role in determining crop productivity (De Costa, 2000). In both clones, LSP was highest in the upper canopy layer, lowest in the bottom and intermediate in the middle (Tables 1 and 2). This trend is an adaptation of each canopy layer to the particular light environment, with leaves receiving higher light levels having higher LSP and vice versa.
Hevea is a C3 plant and therefore light saturation may occur even at 40% of the incident light. However, when leaves develop under low light levels, they get adapted to use the available light efficiently. Such adaptations have been reported by Syvertsen (1984). Although the variation in LSP between different canopy layers was the same for both clones, RRIC 121 had greater LSP for corresponding layers than RRISL 211 (Tables 1 and 2). This means that clone RRIC 121 had a greater ability to use high light levels. It is notable that LSP of the middle canopy of RRIC 121 is very close to the LSP of the upper canopy layer (Table 2). This could be because of the more open canopy architecture in clone RRIC 121.
It was clear that in both clones, LCP of the bottom layer was lower than that of upper and middle layers (Tables 1 and 2). On the other hand, LCP of the bottom layer of clone RRIC 121 was significantly higher than the corresponding values of clone RRISL 211. This could again be due to the open canopy architecture of clone RRIC 121, which would allow greater light penetration down to leaves in the bottom canopy layer.
According to Dey and Vijayakumar (2002), low irradiance is important for photosynthesis in Hevea, since most of the leaves in the mature canopy are exposed to low light. In field-grown conditions, crop canopies hardly become light saturated (Monteith, 1981; Hay and Walker, 1989). Hence, low LCP will enable the plant to maintain a positive net photosynthetic rate even at very low light intensities and increase the productivity (De Costa, 2000).
In both clones, though statistically not significant, it was observed that the quantum efficiency (QE) of the bottom leaf layer was greater than those in the upper and middle layers (Tables 1 and 2). This may be due to the fact that, light is the most limiting component in the bottom leaf layer so that bottom leaves are adapted to use it more efficiently. The QE in different canopy layers of tapped and untapped treatments showed some differences between clones (Tables 3, 4, 5 and 6). These differences between the two clones in their behavior of QE in response to tapping, probably contributed to their respective differences in canopy photosynthesis.
Dark respiratory rates (Rd) varied significantly between the genotypes (Tables 1 and 2). It is well known that the dark respiratory rates give an estimation of dry matter loss from the plant. Hence, it is an important factor determining the productivity of plants (Chazdon and Fetcher, 1984). In both clones, the tapped treatment had greater Rd rates than the untapped treatment. The difference between tapped and untapped treatment was greater in clone RRIC 121 (Tables. 1 and 2). It is reported that lower dark respiratory rates associated with high yields are due to a decrease in maintenance respiration (Gifford, et al., 1984).
When considering the overall correlations between the light response curve (LRC) parameters, the absence of a significant correlation between Amax and QE indicate that Amax determines photosynthetic rate at high light conditions. The significant positive correlation between LCP and LSP is an adaptation to high light conditions. The positive correlation between QE and LSP occurs because of the greater initial slope in the LRC, which would enable a leaf to reach Amax (which is not correlated with QE) at a lower light intensity. The positive response between LCP and Rd means that a greater light intensity is needed to have a higher gross photosynthesis to balance a greater Rd at LCP (Table 11).
Clonal Differences in Canopy Photosynthesis Rates with Reference to Exploitation
The canopy photosynthetic rates measured under optimal environmental conditions clearly showed clonal differences in CO2 assimilation rates. The photosynthetic capacities of leaves from all strata of RRISL 211 were greater than the corresponding strata values in RRIC 121 (Tables 1 and 2). According to Latiffe and Travis (1984), clones with a high sink to source ratio exhibited higher rates of photosynthesis than clones with lower sink to source ratio. It is well known that the light interception efficiency of a canopy is governed by the total leaf area and its distribution within the canopy. A greater canopy photosynthetic rate was observed in clone RRISL 211 despite its leaf area index being 2% lower than in RRIC 121 (Table 8). This could be because of the greater photosynthetic capacity of RRISL 211, as indicated by the greater Amax values. Another reason for the greater canopy photosynthesis of clone RRISL 211 was the presence of a higher percentage of leaf area in the top canopy layer as compared to clone RRIC 121 (Table 8).
Even though, the light saturation point, LSP (i.e. the light intensity at which photosynthetic rate reaches maximum), did not differ significantly between different canopy layers within a clone for both clones, RRIC 121 had greater LSP for corresponding layers than RRISL 211 (Tables 1 and 2). This means that clone RRIC 121 had a greater ability to use high light levels. This could be a possible reason for similar overall canopy photosynthetic rates in both clones. Moreover, it was evident that, due to the more open canopy architecture of clone RRIC 121, LSP of its middle canopy layer was very close to LSP of the upper canopy layer (Table 2).
The overall results of both clones clearly showed that tapped trees have a greater photosynthetic capacity as compared to untapped trees because tapping exerts a stimulatory effect on photosynthesis. This trend was more evident in clone RRISL 211 (Tables 9 and 10).
The dark respiratory rates (Rd) of corresponding canopy layers were always slightly greater in RRISL 211 than in RRIC 121 (Tables 1 and 2). It is reported that lower Rd rates associated with high yields are due to a decrease in maintenance respiration.On the other hand, tapped trees have a greater photosynthetic capacity compared to the un-tapped control and this trend was more evident in clone RRISL 211 (Tables 9 and 10). This was probably because of the stimulation of photosynthesis to synthesize the latex that was lost during tapping. This agreed with the observations made by Sethuraj (1992),i.e.in an untapped tree, biosynthesis of rubber is almost nil in the laticifers of the trunk and there is no translocation of latex. Tapping induces an abnormal physiology by removal of latex. Laticiferous system in the drainage area is then triggered for the re-synthesis of lost latex through photosynthetic stimulation. On the other hand, in tapped trees because of tapping, the photosynthetic rate is stimulated more relative to the transpiration rate. Greater photosynthesis increases dry matter in the latex and finally increases the latex yield in terms of latex yield per tree per tapping.
Acknowledgements
Financial support from the National Science Foundation of Sri Lanka for this as part of the first author’s PhD research project is acknowledged. The authors are grateful to the management of the Rubber Research Institute of Sri Lanka for granting permission to conduct studies at their reserves.
References
- Acock, B., Charles-Edwards, D. A., Fitter, D. J., Hand, D. W., Ludwig, D. W., Warren-Wilson, C. J. and Withers, A.C. (1978). The contribution of leaves from different levels within a tomato crop to canopy net photosynthesis: an experimental examination of two canopy models. Journal of Experimental Botany, 29: 815-827.
CrossRef - Boote, K.J. and Loomis, R.S. (1991).The prediction of canopy assimilation.In ModellingCrop Photosynthesis – from Biochemistry to canopy, 109-140.(Eds K. J. Boote and R.S. Loomis). Madison, WI, USA: American Society of Agronomy and Crop Science Society of America.
CrossRef - Annon (1999). Advisory circular of Ethrel Stimulation: 1999/09. Rubber Research Institute of Sri Lanka.
- Annon (1999). SAS User’s Guide, Statistics, SAS Institute, Version 8. SAS Institute, Cary, NC, USA.
- Aylett, G. P. (1985). Irradiance interception, leaf conductance and photosynthesis in Jamaican Upper Montane Rain Forest Trees.Photosynthetica, 19 (3), 323-337.
- Beadle, C. L., Long, S. P., Imbamba, S. K., Hall, D. O. and Olembo, R. J. (1985). Photosynthesis in relation to plant production in terrestrial environments.Tycooly International, Oxford.
- Chazdon, R. L. and Fetcher, N (1984). Photosynthetic light environments in a low land tropical rain forest of Costa Rica. Journal of Applied Ecology, 72:553-564.
- De Costa, W. A. J. M. (2000). Principles of Crop Physiology: Towards an Understanding of Crop Yield Determination and Improvement. University of Peradeniya, Sri Lanka. pp. 189-377.
- Dey, S.K. and Vijayakumar, K.R. (2002).Selection of vigorous clones of Hevea through regression method.Indian Journal of Natural Rubber Research, 15 (1): 76-87.
- Gifford, R.M., Thorne, J.H., Hitz,W. D. and Giaquinta, R.T. (1984). Crop productivity and photoassimilate partitioning. Science, 225: 801-808.
CrossRef - Hay, R.K.M. and Walker, A.J. (1989).An Introduction to the Physiology of Crop yield. Longman Science and Technical Scottish Agriculture Colleges, AuchinCruive, Agr. pp. 119-122.
- Kwesigo, F. R., Grace, J. and Sandford, A. P. (1986).Some photosynthetic characteristics of tropical timber trees as affected by the light regime during growth.Ann. Bot. 58: 23-32.
CrossRef - Lafitte, H. R. and Travis, R. L. (1984). Photosynthesis and assimilate partitioning in closely related lines of rice exhibiting different sink- source relationships. Crop Science, 24: 447-452.
CrossRef - Monsi, M., Uchijima, Z. and Oikawa, T. (1973). Structure of foliage canopies and photosynthesis.Ann. Rev. Ecol. Syst, 4: 301-327.
CrossRef - Monteith, J. L. (1981).Does Light Limit Crop Production? (In) Physiological processes limiting plant productivity. C. B. Johnson (Ed.). pp. 23-38. Butterworths, London.
CrossRef - Nataraja, K. N. and Jacob, J. (1999). Clonal differences in photosynthesis in HeveabrasiliensisMuell. Arg.Photosynthetica, 36 (12): 89-98.
CrossRef - Nobel, P.S. and Long, S.P. (1985). Canopy structure and light interception. (In) Techniques in Bioproductivity and Photosynthesis. J. Coombs, D.O. Hall, S. P. Long, and J.M.O. Scurlock (Eds.). pp. 41-49. Permagon Press, Oxford.
CrossRef - Nugawela, A. (1989). Gas exchange characteristics of Heveagenotypes and their use in selection for crop yield. Ph.D. Thesis, University of Essex, England.
- Nugawela, A., Long, S. P. and Aluthhewage, R. K. (1995). Genotypic variation in non-steady state Photosynthetic Carbon Dioxide Assimilation of Heveabrasiliensis.Journal of Natural Rubber Research, 10 (4), 266-275.
- Pereira, J. F., Splittstoesser, W. E. and Ogren, W. L. (1986). Photosynthesis in detached leaves of Cassava.Photosynthetica, 20(3): 286-292.
- Sethuraj, M. R. (1992). Yield components in Heveabrasiliensis. (In) Natural Rubber Biology, Cultivation and Technology.M. R. Sethuraj and N. M. Mathew (Eds.). pp. 137-163.
CrossRef - Syvertsen, J. P. (1984). Light acclimitation in Citrus leaves, CO2 assimilation and light, water and nitrogen use efficiency. Journal of American Society of Horticulture Science, 109 (6): 812-817.
- Wolf, D. D. and Blaser, R. E. (1971). Photosynthesis of plant parts in alfalfa canopies. Crop Science, 11: 55-58.
CrossRef - Zelitch, I. (1982). The close relationship between net photosynthesis and crop yield.Bio Science. 32 (10): 796-801.
CrossRef