
Introduction
In India, enactment of The PPVFR Act, 20011 not only facilitated the protection of plant varieties, Breeder’s Right’s but also ensured the availability of high quality seeds and planting materials to Indian farmers. It not only encourages the plant breeders but also stimulates investment on research and development, both in the public and private sector for the development of new varieties of plants.
A successful breeding program needs, complete knowledge and understanding of genetic diversity available within the resources. This enables to choose parents for generation of diverse population and selection. The main criteria considered for assessing genetic diversity and to identify genetic distances within the upland cotton varieties are morphological traits. This will set a path for the development of superior parents and heterotically potential hybrid combinations.
It was reported that cultivated cotton genotypes have narrow genetic base.2,3 To broaden the genetic base through the hybrid breeding program, studies on the genetic divergence within genetic stock is a prerequisite. Genetic variations within and between different cotton genotypes for morphological and fibre quality traits have been studied for their improvement.4 Principal component analysis (PCA) and linkage cluster analysis was employed by the researchers to find the similarity among the genotypes for the traits and their placement into different clusters.5,6
Characterisation and documentation of qualitative and quantitative traits of extant cotton varieties and parental lines are mandatory requirement of Distinctiveness, Uniformity and Stability (DUS) testing programme towards the implementation of PPV&FR Act, 2001.1 As per this act, a new plant variety is considered for protection (IP protection), if that variety is clearly distinguishable by minimum one essential characteristic from other varieties whose existence is a matter of common knowledge in any country at the time of filling the application, and the variation in characteristic features must be uniform subject to further propagation and the same essential characteristics remain unchanged after subsequent propagation. The extant varieties were used as reference varieties (check varieties) in the DUS testing of new plant varieties. Grouping of extant varieties based on their qualitative and quantitative trait is essential and this will support the selection process of reference varieties for DUS testing of a new plant variety. Keeping this in mind, the DUS data along with ancillary data, generated under this programme, were subjected to Principal Component Analysis and cluster analysis for exploitation of diversity available among the varieties and parental lines. The information generated in this study would be useful for DUS testing of new plant varieties and also for inter varietal breeding.
Materials and Methods
The extant varieties of cotton were characterised for morphological traits under DUS testing as reference varieties at Central Institute for Cotton Research, Regional station, Coimbatore during 2012-14. The experimental material comprised of 101 extant cotton varieties (Table 4)for use as reference varieties, under DUS programme, received from varied agro ecological cotton growing zones of India. Sowing of seeds of each variety was taken up in Randomised Complete Block Design with three replications. Each variety was sown in 10 rows adopting 90 cm space between rows and 60 cm within rows. Recommended agronomic, cultural and plant protection practices for tetraploid cotton was adopted till the harvest of the crop.
The genotypes were evaluated for plant height (cm) by measurement of ten individual plants on 140th day of sowing, growth habit (cm) recorded by measuring the length of longest sympodia in randomly selected ten individual plants and the average was taken for analysis. The sympodia number and number of bolls plant-1 were counted in randomly selected 10 plants in each variety and the average was taken. Plant stand was assessed on 140th day in each plot; ten individual bolls harvested in each plot were weighed (g) and the mean values taken for statistical analysis. The harvested bolls were ginned in the laboratory after which lint weight and seed weight/boll (g), seed index and ginning percent were recorded, seed cotton yield/plant arrived through multiplication of a number of bolls/plant and boll weight. The harvested seeds were subjected to standard germination test by sowing 100 seeds in four replications in sand medium and the mean per cent was arrived.7 For calculating the speed of germination, one hundred seeds were germinated in sterilized sand medium replicated four times. Number of seeds that germinated was counted daily up to the final counting day. From the mean per cent germination of each counting day, the speed of germination was derived. and expressed as numeral.8 From standard germination test, randomly ten normal seedlings were taken for measuring the root and shoot length of individual seedlings. The length measured from the collar region to tip of primary root designated as Root length, similarly, shoot length from the collar region to the tip of the plumule. The mean value in each was expressed in cm. Vigour index (VI)9 was computed by multiplying seedling length with germination per cent, Dry matter of seedlings (DMS) was estimated using hot-air oven dried (85°C for 24 h and cooled in a desiccator) 10 normal seedlings. The fibre parameter includes fibre length (FL), fibre strength (FS), fibre fineness (FF), fibre uniformity (FU) and fibre maturity (FM) were measured in PRIMIER ART2 fully automated cotton testing instrument (ICC mode). Standard characteristic states were used to measure different morphological traits of cotton at appropriate growth stages.
Mean value of each trait in every genotype was computed for determining the analysis of variance. Pearson’s linear correlation coefficient was used for 21 quantitative traits10,11,12 (Table 1) and correlation matrix was arrived to compare various traits. Principal Component Analyses based on 21 quantitative traits were executed to find out the relative importance of different traits in capturing the genetic variation. The standardized values were used to perform PCA in PAST3 software.13 Score plot was used for assessment of components or factors that could explain for major variability in the data. The factors correspond to 21 PCs were subjected to cluster analysis based on Euclidean distances and wards minimum variance using Agglomerative hierarchical clustering in XLSTAT software version 2016.05. A hierarchical cluster analysis was performed with pooled data using scores of dissimilarity matrix.14
Results and Discussion
Under field and laboratory twenty one quantitative traits were observed for 101 extant varieties of cotton. Analysis of variance exposed considerable level of variability among accessions for majority of the traits observed. Basic descriptive statistics are presented for 21 characters in Table 1.
The highest variation was found for vigour index, plant height, germination per cent, fibre maturity, yield per plant, plant stand, fibre uniformity and ginning percent. Relatively, low variation was noticed for dry matter of seedlings, boll weight, fibre fineness and seed index. The observed variability found among extant cotton genotypes can probably attribute to the inherent genetic differences and the environment in which they were grown. The correlation coefficients of characters attributed to seed cotton yield per plant were estimated and the results are presented in Table 2. Significant and positive correlation of seed cotton yield with boll number per plant (0.95), boll weight (0.53), lint weight (0.50), fibre length (0.27), plant growth habit (0.26), plant height (0.23) and seed index (0.21) was observed. This result indicated that the increase in seed cotton yield might be due to increase in one or more of the above traits. Association of seed cotton yield with boll weight were reported in earlier studies,15 for number of bolls and boll weight16,17,18 for number of bolls.19
The close relationship between yield and yield attributing traits will be exploited in selection programme which might be helpful in developing high yielding genotypes. Among the fibre quality traits, fibre length alone showed a positive association with seed cotton yield, a similar trend was reported.20,21 Fibre strength and uniformity ratio was also found to exhibit a negative association with seed cotton yield which was in accordance with Erande et.al.,21
Regarding inter correlation, germination per cent had significant positive correlation with vigour index, speed of germination, shoot length and lint weight. The speed of germination exhibited positive correlation with shoot length, vigour index, dry matter of seedling, lint weight and fibre length. Plant stand has significant inter correlation with boll weight and lint weight. Root length showed positive significant correlation with vigour index. Shoot length showed positive significant inter correlation with vigour index. Shoot length and vigour index showed significant positive association with dry matter of seedling, fibre length and plant growth habit. Dry matter of seedlings had significant inter correlation with fibre length, lint weight, seed index and boll weight. Plant height has positive significant inter correlation with plant growth habit, number of sympodia plant-1, fibre maturity and boll numbers/plant. Plant growth has positive inter correlation with number of sympodia plant-1, boll number /plant and fibre maturity. Boll number per plant has positive significant inter correlation with boll weight and lint weight. Boll weight has positive inter correlation with lint weight, seed index and fibre length. Number of sympodia with fibre maturity, Lint weight with seed index, ginning percent and fibre length; seed index with fibre length and fibre strength; fibre strength with fibre uniformity; fibre fineness with fibre uniformity and fibre maturity and fibre uniformity with fibre maturity. These results clearly indicated that selection for any one of these traits leads to concurrent improvement of other traits as well as seed cotton yield. A significant positive association of fibre length was observed with boll weight, lint weight and seed index indicated that these important yield contributing traits were good indicators of fibre length improvement. The other fibre quality traits showed negative association with yield and yield attributing traits. It was found that linkage was the primary cause for negative correlation between yield and fibre quality traits and inter mating may be recommended to break this association.22
Table 1: Coefficient of variation for yield and other quantitative traits in extant varieties of upland cotton.
| Quantitative traits | Minimum | Maximum | Range | Mean | Standard deviation | Coefficient of variation (%) | Variance |
| Germination (%) | 48.000 | 100.000 | 52.000 | 93.000 | 5.977 | 6.426 | 35.719 |
| Speed of germination | 5.930 | 24.300 | 18.380 | 18.320 | 3.081 | 16.817 | 9.495 |
| Root length (cm) | 8.010 | 15.890 | 7.880 | 9.850 | 1.209 | 12.269 | 1.461 |
| Shoot length (cm) | 5.200 | 12.430 | 7.230 | 8.900 | 1.538 | 17.278 | 2.366 |
| Vigour index | 636.360 | 2285.000 | 1648.640 | 1741.620 | 232.122 | 13.328 | 53880.679 |
| Dry matter of seedling(g) | 0.270 | 0.660 | 0.390 | 0.440 | 0.099 | 22.274 | 0.010 |
| Plant: Height (cm) | 52.670 | 166.000 | 113.330 | 95.340 | 21.734 | 22.796 | 472.370 |
| Plant: Growth habit (cm) | 17.560 | 55.330 | 37.780 | 32.710 | 7.402 | 22.629 | 54.796 |
| Plant stand (%) | 8.000 | 66.000 | 58.000 | 52.560 | 12.960 | 24.656 | 167.968 |
| Number of sympodia plant-1 | 11.700 | 33.300 | 21.600 | 18.680 | 3.937 | 21.079 | 15.497 |
| Boll number/plant | 6.000 | 29.000 | 23.000 | 15.660 | 5.425 | 34.633 | 29.428 |
| Boll: Weight (g) | 2.250 | 5.830 | 3.580 | 4.420 | 0.633 | 14.321 | 0.401 |
| Lint weight (g)/10 bolls | 7.600 | 22.100 | 14.500 | 15.900 | 2.494 | 15.690 | 6.220 |
| Seed: Index | 6.200 | 12.800 | 6.600 | 9.710 | 0.885 | 9.113 | 0.783 |
| Ginning % | 30.970 | 40.650 | 9.680 | 35.990 | 2.022 | 5.619 | 4.089 |
| Fibre: Length | 21.600 | 37.800 | 16.200 | 27.230 | 1.754 | 6.442 | 3.078 |
| Fibre: Strength | 18.200 | 31.800 | 13.600 | 21.450 | 1.837 | 8.560 | 3.373 |
| Fibre: Fineness | 3.250 | 7.000 | 3.750 | 4.450 | 0.492 | 11.062 | 0.243 |
| Fibre: Uniformity | 46.600 | 53.100 | 6.500 | 50.590 | 1.447 | 2.861 | 2.095 |
| Fibre: Maturity | 66.000 | 90.000 | 24.000 | 76.240 | 4.539 | 5.954 | 20.603 |
| Seed cotton yield/plant (g) | 15.750 | 135.780 | 120.030 | 70.080 | 27.625 | 39.419 | 763.137 |
Table 2: Correlation coefficient for yield and quantitative traits in extant varieties of upland cotton.
|
Traits |
G | SG | PS | RL | SL | VI | DMS | PH | PGH | NSP | BNP | BW | LW | SI | GI | FL | FS | FF | FU | FM | SCYP |
| G |
1.00 |
0.60 |
0.17 |
0.11 |
0.29 |
0.63 |
0.16 |
0.07 |
0.10 |
-0.03 |
0.05 |
0.17 |
0.20 |
0.00 |
0.06 |
0.15 |
0.03 |
0.05 |
-0.13 |
0.04 |
0.09 |
| SG |
1.00 |
0.13 |
-0.07 |
0.69 |
0.63 |
0.59 |
-0.03 |
0.12 |
-0.17 |
0.09 |
0.16 |
0.24 |
-0.05 |
0.19 |
0.23 |
0.00 |
-0.03 |
-0.18 |
0.03 |
0.12 |
|
| PS |
1.00 |
-0.01 |
0.08 |
0.10 |
0.18 |
-0.06 |
-0.06 |
0.02 |
-0.01 |
0.40 |
0.29 |
0.09 |
0.15 |
-0.11 |
-0.16 |
-0.01 |
0.10 |
-0.08 |
0.08 |
||
| RL |
1.00 |
0.11 |
0.58 |
-0.09 |
0.00 |
0.01 |
-0.07 |
-0.04 |
-0.09 |
-0.07 |
-0.07 |
-0.02 |
0.03 |
0.10 |
-0.13 |
0.05 |
-0.02 |
-0.07 |
|||
| SL |
1.00 |
0.78 |
0.75 |
0.13 |
0.28 |
-0.10 |
0.16 |
0.15 |
0.18 |
0.07 |
0.09 |
0.30 |
0.01 |
-0.15 |
-0.28 |
-0.06 |
0.17 |
||||
| VI |
1.00 |
0.48 |
0.11 |
0.21 |
-0.11 |
0.09 |
0.12 |
0.16 |
0.01 |
0.07 |
0.25 |
0.07 |
-0.13 |
-0.19 |
-0.02 |
0.10 |
|||||
| DMS |
1.00 |
-0.01 |
0.12 |
-0.05 |
0.09 |
0.20 |
0.25 |
0.22 |
0.13 |
0.37 |
0.13 |
-0.18 |
-0.31 |
-0.13 |
0.12 |
||||||
| PH |
1.00 |
0.96 |
0.63 |
0.21 |
0.04 |
-0.02 |
-0.13 |
0.02 |
-0.04 |
-0.16 |
0.14 |
-0.10 |
0.26 |
0.23 |
|||||||
| PGH |
1.00 |
0.57 |
0.26 |
0.04 |
0.00 |
-0.19 |
0.10 |
-0.03 |
-0.15 |
0.15 |
-0.09 |
0.31 |
0.26 |
||||||||
| NSP |
1.00 |
0.20 |
-0.04 |
-0.11 |
-0.13 |
-0.05 |
-0.07 |
-0.08 |
0.09 |
-0.07 |
0.21 |
0.16 |
|||||||||
| BNP |
1.00 |
0.25 |
0.24 |
0.06 |
0.10 |
0.19 |
-0.17 |
0.05 |
-0.26 |
0.19 |
0.95 |
||||||||||
| BW |
1.00 |
0.90 |
0.53 |
0.18 |
0.31 |
-0.22 |
-0.16 |
-0.27 |
-0.13 |
0.53 |
|||||||||||
| LW |
1.00 |
0.50 |
0.46 |
0.43 |
-0.17 |
-0.12 |
-0.34 |
-0.04 |
0.50 |
||||||||||||
| SI |
1.00 |
-0.22 |
0.52 |
0.23 |
-0.31 |
-0.30 |
-0.29 |
0.21 |
|||||||||||||
| GI |
1.00 |
-0.01 |
-0.33 |
0.23 |
-0.06 |
0.27 |
0.15 |
||||||||||||||
| FL |
1.00 |
0.19 |
-0.43 |
-0.76 |
-0.31 |
0.27 |
|||||||||||||||
| FS |
1.00 |
-0.22 |
0.27 |
-0.22 |
-0.24 |
||||||||||||||||
| FF |
1.00 |
0.31 |
0.76 |
0.00 |
|||||||||||||||||
| FU |
1.00 |
0.21 |
-0.32 |
||||||||||||||||||
| FM |
1.00 |
0.13 |
|||||||||||||||||||
| SCYP |
1.00 |
Values in bold are significant at 0.05 G Germination(%); SG Speed of germination; PS Plant stand (%); RL Root length (cm); SL Shoot length (cm); VI Vigour Index; DMS Drymatter of Seedlings; PH Plant height (cm); PGH Plant Growth habit; NSP Number of sympodia /plant; BNP Boll number/plant; BW Boll weight (g); LW Lint weight(g); SI Seed index (%); GI Ginning (%); FL Fibre length; FS Fibre strength; FF Fibre fineness; FU Fibre uniformity; FM Fibre maturity; SCYP -Yield (g)
Principal Components
The Principal Component Analysis is a multivariate statistical technique, to extract the important information from the data table and simplify the description of the data set. To discern patterns of variation, PCA was performed on all variables simultaneously. The Eigen values, variability (%) and cumulative (%) are presented in Table 3
Table 3: Principal component analysis for first eight components in extant varieties of upland cotton.
| Characters |
Principal Components |
|||||||
|
PC1 |
PC2 |
PC3 |
PC4 |
PC5 |
PC6 |
PC7 |
PC8 |
|
| Germination (%) | 0.213 | 0.041 | 0.263 | 0.134 | 0.106 | 0.162 | 0.106 | 0.206 |
| Speed of germination | 0.290 | 0.014 | 0.329 | 0.173 | -0.096 | -0.201 | 0.122 | -0.054 |
| Plant stand (%) | 0.110 | -0.002 | -0.047 | 0.296 | 0.540 | -0.015 | 0.056 | -0.347 |
| Root length (cm) | 0.026 | -0.038 | 0.224 | -0.066 | 0.105 | 0.688 | -0.279 | 0.078 |
| Shoot length (cm) | 0.322 | 0.020 | 0.329 | -0.030 | -0.078 | -0.146 | 0.042 | -0.167 |
| Vigour index | 0.292 | 0.010 | 0.414 | 0.006 | 0.040 | 0.299 | -0.059 | 0.025 |
| Dry matter of seedling (g) | 0.303 | -0.063 | 0.203 | -0.007 | -0.030 | -0.374 | 0.136 | -0.135 |
| Plant: Height (cm) | 0.065 | 0.412 | 0.019 | -0.336 | 0.263 | -0.069 | -0.063 | 0.113 |
| Plant: Growth habit (cm) | 0.104 | 0.426 | 0.083 | -0.290 | 0.200 | -0.098 | -0.042 | 0.066 |
| No. of sympodia plant-1 | -0.014 | 0.326 | -0.070 | -0.323 | 0.258 | -0.095 | 0.009 | 0.002 |
| Boll number/plant | 0.200 | 0.240 | -0.215 | -0.071 | -0.349 | 0.279 | 0.272 | -0.344 |
| Boll Weight (g) | 0.304 | -0.014 | -0.312 | 0.181 | 0.304 | 0.064 | 0.054 | 0.077 |
| Lint weight(g)/10 bolls | 0.327 | -0.017 | -0.280 | 0.244 | 0.153 | 0.026 | -0.054 | 0.253 |
| Seed Index | 0.201 | -0.245 | -0.261 | -0.108 | 0.150 | 0.009 | 0.259 | 0.325 |
| Ginning % | 0.104 | 0.171 | -0.040 | 0.382 | -0.080 | -0.109 | -0.379 | 0.121 |
| Fibre Length(mm) | 0.305 | -0.188 | -0.104 | -0.243 | -0.205 | -0.048 | -0.126 | 0.291 |
| Fibre Strength (g/tex) | -0.041 | -0.237 | 0.155 | -0.224 | 0.062 | 0.061 | 0.523 | 0.265 |
| Fibre Fineness (micronaire) | -0.140 | 0.321 | 0.046 | 0.311 | -0.151 | -0.041 | 0.205 | 0.317 |
| Fibre Uniformity (%) | -0.282 | 0.045 | 0.138 | 0.218 | 0.266 | 0.128 | 0.400 | -0.096 |
| Fibre Maturity (%) | -0.073 | 0.382 | 0.049 | 0.221 | -0.199 | 0.034 | 0.164 | 0.355 |
| Yield/plant (g) | 0.268 | 0.214 | -0.294 | -0.016 | -0.220 | 0.257 | 0.232 | -0.255 |
| Eigen value | 4.617 | 3.280 | 2.670 | 2.094 | 1.343 | 1.299 | 1.147 | 1.004 |
| Variability (%) | 21.986 | 15.617 | 12.714 | 9.972 | 6.396 | 6.187 | 5.460 | 4.780 |
| Cumulative (%) | 21.986 | 37.603 | 50.317 | 60.289 | 66.685 | 72.872 | 78.332 | 83.112 |
Out of 21 principal components, eight components had extracted Eigen value of >1. This contributed for 83.11% of the variation among the extant cotton varieties. Principal component 1, contributed for 21.99%, to the total variability. The variation on principal component 1 was mainly attributed due to lint weight, shoot length, fibre length, boll weight and dry matter of seedlings. These results are in accordance with.23 The PC2 contributed for 15.62% to the total variability and was depicted mainly by plant height followed by growth habit, fibre maturity, number of sympodia plant-1 and fibre fineness. The PC3 contributed for 12.71% of the total variability and was mainly attributed to vigour index, shoot length and speed of germination. Principal component 4 contributed 9.97% to the total variability and was mainly ascribed to ginning percent and fibre fineness with their positive loadings and negative loadings with plant height and number of sympodia plant-1. The PC5 described contribution of 6.40% to the total variability, illustrated primarily the divergence in plant stand and boll weight with their positive loadings and negative loadings with boll number/plant. The first three PCs exhibited high variation for the traits under study and therefore good cotton improvement may be accomplished through inter varietal development.
Score Plot
The principal component scatter plot of the cotton accessions depicted that the accessions those were close together were perceived as being similar when rated based on the variables. Thus accessions RST-9 and F 505, CPD 428 and ACP 71, LRA 5166 (SB) and VIKRAM, PG 5 and RHC 005 were close to each other on both PC1 and PC2 respectively. The accessions SRT GMS-1, Surat Dwarf, LRA 5166, GSAV 1056, GSB 39 and DHY 286-1 were separated from other accessions. The accession SRT GMS-1 was opposite to GMS 39 because SRT GMS-1 lied in the negative region and GMS 39 lied in positive region. The genotypes in the positive ordination may be utilized for heterosis breeding program (Fig.1, Table 4).
Table 4: Grouping of genotypes based on the score plot of Principal component analysis.
|
S.No. |
Groups |
Name of extant varieties |
| 1 |
A |
70 E, AB 6, ACP 71, Ca/H-128, Ca/ H-129, Ca/ MH -133, CPD 423, CSH -8, CSH-19, DHY 286-1, H 1098, M 12, NH 452, VC 21, J 34, LH 1134, LSS, L 389, HS 6, AC738, AH 107, AK 23 B, AK 32, AKH 07 R, Bikaneri Nerma, MDH 89, CPD 420, CPD 428, DS 28 F, G COT 18, Gujarat 67, H 1117, H 1157, K 34007, BN Red, MCU 13, MCU 4, PRS 74, PUSA 8-6, Reba B50, RHC 003, RST -9, SH-2379, Suman, T 7, TCH 1218, H 1220, VC 22 , Vikas , Vikram, H 974, HHM -1, F 286, F 320, LH 372, J 205, Badnawar 1, Khandwa 3, AKH 081, F 1054, F 1378, F 1861, G COT 16, PIL 43, HLS 329, Kanchana, M 2 , MCU 3, MCU 7, MCU 8, NCH 11, PH 325, PH 93, RS- 810, RS-875, VC 31, VC 32, LH 886, GSHV 112, Deviraj, F 505, F 846, G COT 10, G COT 100, LH 1556, LH 900, PIL 8 , RHC 006, KH 11, PG 5, PG 6, JK 35, L 604, LRA 5166 (SB), Khandwa 2 |
| 2 |
B |
GSB 39 |
| 3 |
C |
SURAT DWARF, LRA 5166, RS-2013 |
| 4 |
D |
SRT-GMS 1, GSAV 1056 |
Table 5: Grouping of genotypes based on clustering upon yield and quantitative traits in extant Gossypium hirsutum varieties.
|
Clusters |
Number |
Name of extant varieties |
|
I |
19 |
70 E, AB 6, ACP 71, Ca/H-128, Ca/ H-129, Ca/ MH -133, CPD 423, CSH -8, CSH-19, DHY 286-1, H 1098, M 12, NH 452, VC 21, J 34, LH 1134, LSS, L 389, HS 6 |
|
II |
47 |
AC738, AH 107, AK 23 B, AK 32, AKH 07 R, Bikaneri Nerma, MDH 89, CPD 420, CPD 428, DS 28 F, G COT 18, Gujarat 67, H 1117, H 1157, K 34007, BN Red, MCU 13, MCU 4, PRS 74, PUSA 8-6, Reba B50, RHC 003, RST -9, SH-2379, Suman, T 7, TCH 1218, H 1220, VC 22 , Vikas , Vikram, H 974 , HHM -1, F 286, F 320, LH 372, J 205, Badnawar 1 , Khandwa 3, GSB 39, G SAV 1056, AKH 081, F 1054, F 1378, F 1861, G COT 16, PIL 43 |
|
III |
35 |
HLS 329, Kanchana, LRA 5166, M 2 , MCU 3, MCU 7, MCU 8, NCH 11, PH 325, PH 93, RS -2013, RS- 810, RS-875, VC 31, VC 32, LH 886, GSHV 112, SRT-GMS 1, Deviraj, F 505, F 846, G COT 10, G COT 100, LH 1556, LH 900, PIL 8 , RHC 006, Surat Dwarf, KH 11, PG 5, PG 6, JK 35, L 604, LRA 5166 (SB) , Khandwa 2 |
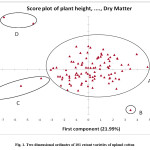 |
Figure 1: Two dimensional ordinates of 101 extant varieties of upland cotton. Click here to View figure |
Biplot
These variables were super imposed on the plot as vectors in the biplot, the relative length of the vector represents the relative proportion of variability in each variable. The extant variety distant from origin showed more variation and less similarity with other varieties. Traits such as fibre fineness, fibre maturity, number of sympodia plant-1, plant growth habit, plant height, boll number per plant, yield per plant, germination percent, speed of germination, shoot length, vigour index, lint weight per plant, boll weight per plant, dry matter of seedlings, fibre length and seed index were well represented with high amount of variability, while root length and plant stand showed the lowest variability. The quality traits, such as fibre uniformity, strength were not in desirable direction (Fig. 2). A similar result of least variability in fibre uniformity in cotton was reported.23 The range of variability in each trait, among the varieties under study, exhibited greater divergence which may be useful for an effective cotton breeding program.
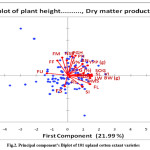 |
Figure 2: Principal component’s Biplot of 101 upland cotton extant varieties. Click here to View figure |
Clustering
The factors corresponding to 21 PCs were subjected to cluster analysis based on Agglomerative hierarchical clustering performed on the Euclidean distance matrix utilizing Ward’s linkage method and the resultant dendrogram showed three distinct clusters (Fig.3). The cluster II was the biggest comprising of 47 genotypes followed by cluster III, which occupies 35 genotypes and cluster I with 19 genotypes (Table 5). The cluster analysis identifies groups of cotton cultivars those were of more closely related as reported.24 These results are in confirmation with the earlier studies of.25,26 The geographical distribution of genotypes is not the lone factor that causes morphological and genetic diversity. It may be the outcome of several other factors like natural or artificial selection, exchange of breeding materials, genetic drift and environmental variations. Therefore, the emphasis for selection of parents should be based on genetic rather than geographical diversity.
Cluster analysis using Ward’s method of minimum variance exhibited a distinct pattern of group formation (Table 6). The genotypes in cluster I showed higher values for germination per cent, rate of germination, root and shoot length, vigour index, dry matter of seedlings, plant growth habit, boll weight, ginning (%), fibre length, fibre maturity and lint weight/10 bolls. Similarly, cluster II was comprised of genotypes having the highest values for plant height, seed index, fibre strength, boll number/plant and yield/plant. The members of the III cluster were characterized by higher values for plant stand (%), fibre fineness, fibre uniformity and number of sympodia plant-1.
Table 6: Mean values of clusters for various traits in extant varieties of upland cotton.
| Characters | Cluster I | Cluster II | Cluster III |
| Germination (%) | 94.684 | 93.915 | 89.943 |
| Speed of germination | 20.049 | 19.104 | 16.340 |
| Root length (cm) | 11.124 | 9.810 | 9.215 |
| Shoot length (cm) | 10.573 | 9.230 | 7.558 |
| Vigour index | 2050.888 | 1786.695 | 1513.205 |
| Dry matter of seedling (g) | 0.502 | 0.453 | 0.396 |
| Plant: Height (cm) | 97.436 | 99.360 | 88.809 |
| Plant: Growth habit (cm) | 35.006 | 34.099 | 29.603 |
| Plant stand (%) | 53.895 | 50.638 | 54.429 |
| No. of sympodia plant-1 | 18.500 | 18.598 | 18.874 |
| Boll number/plant | 15.526 | 16.333 | 14.838 |
| Boll Weight (g) | 4.468 | 4.414 | 4.400 |
| Lint weight (g)/10 bolls | 16.121 | 15.966 | 15.677 |
| Seed Index | 9.574 | 9.783 | 9.689 |
| Ginning % | 36.347 | 35.840 | 35.994 |
| Fibre Length (mm) | 27.603 | 27.349 | 26.873 |
| Fibre Strength (g/tex) | 21.495 | 21.680 | 21.130 |
| Fibre Fineness (micronaire) | 4.318 | 4.439 | 4.541 |
| Fibre Uniformity (%) | 50.445 | 50.512 | 50.781 |
| Fibre Maturity (%) | 76.500 | 76.309 | 76.000 |
| Yield /plant (g) | 68.750 | 73.565 | 66.120 |
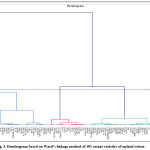 |
Figure 3: Dendrogram based on Ward’s linkage method of 101 extant varieties of upland cotton. Click here to View figure |
Largest variation was found for vigour index, plant height, germination percent, fibre maturity, yield per plant, plant stand, fibre uniformity and ginning percent. Seed cotton yield exhibited significantly positive correlation with boll number per plant, boll weight, lint weight, fibre length, plant growth habit and plant height. The Principal component analysis summarized maximum diversity present among the genotypes in eight components. In the cluster analysis the genotypes like Surat Dwarf, GSAV 1039, DHY 39, SRT GMS-1, forms different clusters and in the biplot also it found distantly when compared to rest of the genotypes. So, these varieties may be useful for further breeding programme to develop high yielding cultivars. The classification of varieties into different clusters, aids for selection of genotypes for designed future breeding program. Varieties which are in diverse nature may be useful for transfer of the desired gene for cotton yield improvement, suitable for different ambiances.
Acknowledgements
The author acknowledges, the technical support rendered by Ms.H.Kavitha, Research Associate while recording of observations under DUS project. I wish to thank Dr. C. Priyadarshini, Senior Research fellow for her support in preparation of this manuscript. I thank The PPV and FRA New Delhi for generous funding and technical support extended in execution of work during the project period.
References
- Anonumous., The Protection of Plant Varieties and Farmers Rights Act, 2001, Universal Law Publishing Co.Pvt.Ltd. New Delhi. 2008;127.
- Abdukarimov, A.S., Djataev, S., Abdukarimov, I. Cotton research in Uzbekistan: Elite varieties and future cotton breeding, Proceeding world cotton research conference, Cape Town, South Africa. 2003;5-15.
- McCarty, J.C., Jenkins, J. N., Wu, J. Primitive accession derived germplasm by cultivar crosses as sources for cotton improvement: II.Genetic effects and genotypic values, Crop Science. 2004;44:1231-1235.
CrossRef - Li, R.L., Long, Z.,Chen, J. Comparison of fibre quality characteristics of different varieties of hybrid cotton. Journal of Hunan Agricultural University. 2005;31:492.
- Jian, C., Wei, L., Ruili, L., Feng, L. F. W. Genetic diversity detected by cluster analysis North of Anhui major wheat cultivars. Chinese Agricultural Science Bulletin. 2006;11:031.
- Qiaoling, W., Zhe, L. Principal Component analysis of F2 individual selection in upland cotton (Gossypium hirsutum L.). Journal of Henan Institute of Science and Technology (Natural Sci. Ed.), 2011;5:004.
- ISTA. International Rules for Seed Testing. Seed Science and Technology. 1999;27:30-35.
- Maguire, J.D. Speed of germination aid in selection and evaluation for seedling emergence and vigour. Crop Science. 1962;2:176-177.
CrossRef - Abdul – Baki, A.A., Anderson, J. D. Vigour determination in soybean by multiple criteria. Crop Science. 1973;10:31–34.
- Matsoukis, A.S., Gasparatos,D., Chronopoulou-Sereli,A. Micronutrient content in relation to specific leaf area, light regime and drenched-applied paclobutrazol in Lantanacamara L.Current Agriculture Research Journal. 2015;3(2):101-104.
CrossRef - Gunasekera, H.K.L.K., De Costa,W.A.J.M., Nugawela,A. Canopy photosynthetic capacity and light response parameters of rubber Heveabrasiliensis with reference to exploitation. Current Agriculture Research Journal. 2013;1(1):1-12.
CrossRef - Roussos P., Matsoukis, A., Pontikis,C., Chronopoulou-Sereli,A. Relations of environmental factors with the phenol content and oxidative enzyme activities of olive explants. Scientia Horticulturae. 2007;113:100-102.
CrossRef - Hammer, Ø., Harper, D. A. T., Ryan, P. D. PAST: Paleontological statistics software package for education and data analysis. Palaeontologia Electronica. 2001;4:1–9.
- Ward, J. H. Hierarchical grouping to optimize an objective function. Journal of American Statistical Association. 1963;58:236-244.
CrossRef - Alkuddsi, Y.,Patil, S. S., Manjula, S. M., Patil, B.C. Correlation Studies on Yield and its Components in Inter Specific Cotton Hybrids (G. hirsutumx G. barbadense) for developing heterotic Box. Molecular Plant Breeding, 2013;4(28):228-237.
- Farooq, J., Anwar, J., Riaz, M., Farooq, M., Mahmood, A., Shahid, A., Rafiq, M.T.H., Ilahi, F. Correlation and path coefficient analysis of earliness, fibre quality and yield contributing traits in cotton (Gossypiumhirsutum L.). The Journal of Animal and Plant Sciences. 2014;24(3):781-790.
- Vinodhana, K.N., Gunasekaran, M., Vindhiyavarman, P. Genetic studies of variability, correlation and path coefficient analysis in cotton genotypes. International Journal of Pure and Applied Biosciences. 2013;1(5):6-10.
- Preetha,S., Raveendran,T.S. Genetic variability and association analysis in three different morphological groups of cotton Gossypium hirsutum L. Asian Journal of plant sciences. 6(1):122-128.
- Ekinci, R., Basbag, S., Gencer, O. Path coefficient analysis between seed cotton yield and some characters in cotton (Gossypium hirsutum L.). Journal of Environmental Biology. 2010;31(5):861-864.
- Srinivas, B., Bhadru,D., Brahmeswara Rao,M.V. Correlation and path coefficient analysis for seed cotton yield and its components in American cotton (Gossypium hirsutumL.). Agriculture Science Digest. 2015;35(1):13-18.
CrossRef - Erande, C.S., Kalpande, H.V., Deosarkar, D.B., Chavan, S.K., Patil, V.S., Deshmukh, J.D., Chinchane, V.N., Anil Kumar., UtpalDey., Puttawar, M.R. Genetic variability, correlation and path analysis among different traits in desi cotton (Gossypium arboretum L.). African Journal of Agricultural Research; 2014;9(29):2278-2286.
CrossRef - Meredith, W.R., Bridge, R.R. Break up of linkage blocks in cotton, Gossypium hirsutumL. Crop Science. 1971;11:695-697.
CrossRef - Shakeel, A., Talib, I., Rashid, M., Saeed, A., Ziaf, K., Saleem, M. F. Genetic diversity among upland cotton genotypes for quality and yield related traits. Pakistan Journal of Agricultural Sciences. 2015;52(1):73-77.
- May, O. L., Bowman, D. T., Calhoun, D. S. Genetic diversity of US Upland cotton cultivars released between1980 and 1990. Crop Science. 1995;35:1570–1574.
CrossRef - Gopinath, M., Rajamani, S., Naik, R. K., Rao, C. H. M. Genetic divergence for lint characters for upland cotton (G.hirusutum L.). Journal of Cotton Research Development. 2009;23:18–22.
- Satish, Y., Jain, P. P., Chhabra, B.S. Studies on genetic diversity in upland cotton (G. hirsutum L.). Journal of Cotton Research Development. 2009;23:18–22.