

Introduction
Water is very much essential for plant growth. The organic and inorganic contaminants degrade the water quality and make it polluted which affect directly on seed germination and plant growth. Not only that industrial effluents including organic and inorganic have strong influence on the development of growth of plants. But there can be both beneficial and damaging effects of waste water irrigation on corps including vegetables.1, 2 So it is very necessary to study the impact of water on any plant before they are recommended for irrigation. Pandey et al., (2008) 3 studied the pollution level in distillery effluent of Lucknow based distillery which showed high acidity (pH – 5.5), high B.O.D., alkalinity, TS and its phytotoxic effects on seed germination and early growth of maize and rice. It inhibited germination and early seedling growth of maize and rice in relation to germination percentage of seeds, length of radical and plumule, fresh and dry weight of seedlings.
Use of domestic waste water in agriculture contributes considerably to alleviate the pressure in using fresh water resources.4 Waste water from different sources contains high concentration of cations and anions induce morphological and physiological disorders, such as reduction in growth, inhibition of germination and root growth.5 The effects of any water vary from quality to quality and also from species to species. The present study is designed to evaluate the effect of different quality water on morphological, chlorophyll content and some biochemical assessment of Bengal gram (Cicer arietinum) and Indian mustard (Brassica juncea) associated with seed germination.
Materials and Methods
Two edible and economically important varieties of plants (Seeds) were taken in the present study i.e. Bengal gram (Cicer arietinum)& Indian mustard (Brassica juncea). Treatment was executed with water from four different water bodies including one control (Table 1).
Table 1: Water Resources for treatment of plants
| Legend Used in Study | Type of Water Body |
| A | A domestic pond (Station 1) |
| B | An Aquaculture (fish) pond & also used for domestic purposes(Station 2) |
| C | An Aquaculture (fish) pond(Station 3) |
| D | A canal where many industrial effluents are discharged( Station 4) |
| T | Control or Tap Water |
Seed Germination
The seeds (approximately 50 seeds per plant) were treated with 1% HgCl2 for surface sterilization and washed several times with distilled water to remove all traces of HgCl2. For germination seeds were spread on water(water samples collected from the respective water bodies as mentioned in Table 1) soaked filter papers kept in petri dishes at room temperature and incubated in dark for 24 hrs. Seeds soaked in tap water were kept as control. After 24 hrs they were exposed to controlled sunlight for root and shoot elongation. After 15 days the results were observed.
Shoot length was measured from the base of primary leaf to the base of hypocotyls & root length was measured from tip of the primary root to the base of hypocotyl. By adding the root length and shoot length, seedling length was calculated. Total germination was calculated and expressed as germination percentage, Seedling Vigour Index was computed by adopting the formula suggested by Abdul Baki and Anderson [Seedling Vigour Index=Germination % × seedling length](1970),6 and expressed in number.7 Numbers of root Hairs were also counted and expressed in number. The chlorophyll (total chlorophyll, chlorophyll a and b) content was estimated by extracting fresh leaves with 80% acetone& after centrifugation the supernatants were collected &color intensity were measured at 645nm & 663nm respectively.8 Total carbohydrate was estimated by Anthrone Method,9 total reducing sugar is estimated by DNS method,10 total protein was estimated by Bradford Method11 and total DNA was estimated by Diphenylamine test.12 Statistical analysis was done by using IBM SPSS Statistical Software.
Results and Discussion
Table 2 depict the physico-chemical quality of the water samples collected from the water bodies and used in this study. In our past study13 it was found that station 3 and station 4 is more polluted than station 1 and station 2. Although pH of four stations are in the permissible limit given by WHO and Indian Standards but in previous year all the stations have high BOD values which are not suitable for drinking or outdoor bathing or fisheries and agriculture purposes. In Station 3 and station 4 BOD is increasing day by day. Total hardness should not be more than 200 mg/L according to Indian Standard but all the stations have higher content than the limit. Station 1 and station 2 bearing hard water (150-300mg/L) and station 3 and station 4 bearing very hard water. TDS is very high in station 3 and station 4 and are not suitable for agricultural or fisheries purposes. Chloride content should not be more than 250mg/L. But t station 3 has average 387.88 mg/L chloride content and station 4 has average 329.2 mg/L chloride content. Average COD of station 4 is higher (248mg/L) in second year than first year findings (240mg/L). It seems that organic pollutants load is increasing rapidly.13
The water samples used for the treatment of plants (table1) do not suffice the standard CPCB norms of effluent discharge. The effluent is either devoid of or of incomplete treatment; although a lot of anthropological exploitations are happening in station 1 and station 2. As inorganic contents are increasing so station 3 and station 4 are getting eutrophicated. Using of organic manure may result in greater abundance of pathogenic bacteria in station 3. As station 2 and station 3 are surrounded by paddy fields, so use of fertilizer for yielding of crop is affecting the water body indirectly as it constantly receives the drain-off of the fertilizers. In station 4 we observed the fishing and anthropological practices have stopped which was a regular practice of the surrounding people.
Table 2: Quality parameters of different water bodies in summer season
| Station | PH | Conductivity (mS ) | Total Solids (mg/L) | Total Dissolved Solids (mg/L) | Total Suspended Solids (mg/L) | BOD5 (mg/L) | COD (mg/L) | Chloride (mg/L) | Hardness (mg/L) |
| 1 | 6.5 | 1.120 | 420 | 390 | 30 | 3.5 | 43.6 | 280 | 232 |
| 2 | 6.2 | 1.543 | 180 | 150 | 30 | 3.2 | 48 | 219.93 | 252 |
| 3 | 5.9 | 7.294 | 2990 | 1410 | 1580 | 3.9 | 36 | 395.88 | 1044 |
| 4 | 6.6 | 9.120 | 4220 | 410 | 3810 | 65.5 | 262 | 259.9 | 268 |
In Table 3 and Table 4, they show that seed germination of Indian mustard and Bengal gram were seriously affected by different quality of water applied.
Table 3: Assessment of growth parameters of Brassica juncea and Cicer arietinum
| Plant Species | Treatment | Germination (%) | Seedling Growth (cm.) | Seedling Vigour Index(SVI) | Number of Root Hairs | Length of Root Hair (cm) | Chlorophyll Content (mg/gm) | ||||
| Root Length (cm.) | Shoot Length (cm.) | Seedling Length(cm) | Total Chlorophyll | Chlorophyll ‘a’ | Chlorophyll ‘b’ | ||||||
| Indian Mustard(Brassica juncea) | A | 100 | 7.28 | 3.14 | 10.42 | 1042 | 18 | 1.44 | 0.98 | 0.57 | 0.41 |
| B | 60 | 2.73 | 5.03 | 7.76 | 465.6 | 12 | 0.6 | 1.1 | 0.66 | 0.45 | |
| C | 75 | 4.68 | 3.61 | 8.29 | 621.75 | 11 | 0.94 | 0.86 | 0.51 | 0.35 | |
| D | 85 | 6.94 | 3.3 | 10.24 | 870.4 | 16 | 0.73 | 1.0 | 0.62 | 0.38 | |
| T (Control) | 90 | 5.43 | 4.31 | 9.74 | 876.6 | 13 | 0.76 | 0.97 | 0.54 | 0.43 | |
| Bengal Gram(Cicer arietinum) | A | 95 | 12.8 | 24.23 | 37.03 | 3517.85 | 22 | 9.56 | 2.71 | 1.15 | 1.56 |
| B | 80 | 7.97 | 23.27 | 31.24 | 2499.2 | 18 | 11.6 | 2.88 | 1.21 | 1.67 | |
| C | 83 | 3.18 | 14.73 | 17.91 | 1486.53 | 13 | 5.02 | 2.78 | 1.21 | 1.57 | |
| D | 78 | 2.98 | 2.67 | 5.65 | 440.7 | 8 | 1.62 | 1.44 | 0.84 | 0.6 | |
| T (Control) | 97 | 4.01 | 21.75 | 25.76 | 2498.72 | 21 | 5.6 | 2.09 | 1.09 | 1.0 | |
Table 4: Few biochemical assessment of Brassica juncea and Cicer arietinum
| Plant Species | Treatment | Total Carbohydrate(mg/ml) | Total Reducing Sugar (mg/ml) | Total Protein (mg/ml) |
Total DNA (mg/L) |
||||
| In Shoot Extract | In Root Extract | In Shoot Extract | In Root Extract | In Shoot Extract | In Root Extract | In Shoot Extract | In Root Extract | ||
| Indian Mustard(Brassica juncea) | A | 0.58 | 1.74 | 0.3 | 0.55 | 1.01 | 0.61 | 134.75 | 55.75 |
| B | 0.9 | 2.0 | 0.66 | 0.4 | 1.15 | 0.65 | 88 | 33 | |
| C | 0.6 | 1.84 | 0.43 | 0.33 | 0.47 | 0.23 | 71.5 | 46.75 | |
| D | 1.12 | 1.78 | 0.33 | 0.1 | 0.62 | 0.26 | 44 | 24 | |
| T (Control) | 0.92 | 1.77 | 0.27 | 0.37 | 0.9 | 0.71 | 57.75 | 16.5 | |
| Bengal Gram(Cicer arietinum) | A | 0.95 | 4.01 | 0.44 | 1.2 | 0.33 | 0.15 | 66 | 38.5 |
| B | 0.56 | 2.4 | 0.4 | 1.05 | 0.36 | 0.3 | 30.25 | 33.25 | |
| C | 0.55 | 3.22 | 0.48 | 1.34 | 0.24 | 0.03 | 59.75 | 19.25 | |
| D | 1.38 | 3.08 | 0.86 | 0.62 | 0.1 | 0.05 | 33 | 27 | |
| T (Control) | 0.5 | 4.64 | 0.22 | 0.6 | 0.08 | 0.17 | 110 | 99 | |
In case of Bengal gram germination rate is higher for treatment‘T’ than Indian mustard. But for treatment ‘A’ it is higher in Indian mustard and i.e. 100% [Figure 1]. The lower percentage of germination is noted at treatment ‘B’ for Indian mustard i.e. 60%. Divyapriya et al., (2014) reported the lowest percentage of germination was noted in 100% effluent treated seeds.14
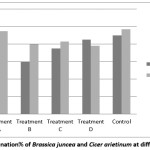 |
Figure 1: Germination% of Brassica juncea and Cicer arietinum at different treatment Click here to View Figure |
The higher concentration of effluent decrease enzyme dehydrogenase activity that is considered as one of the biochemical change which may have disrupted germination and seedling growth.15 This might be due to inhibition of enzyme activity.16 The ability of seeds to germinate under high osmotic pressure differs with variety as well as species.17 Seedling length varies with the variation of treatment water. In both cases where plant grows from treatment ‘A’ their seedling length is highest for both the species of Indian mustard & Bengal gram. Indian mustard’s seedling length for treatment ‘D’ is higher than treatment ‘B’, ‘C’ and control but in case of Bengal gram it is lower than others [Figure 2].
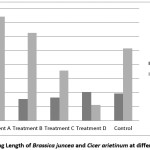 |
Figure 2: Seedling Length of Brassica juncea and Cicer arietinum at different treatment Click here to View Figure |
So from this result it can be said that effects of water vary from species to species. Seedling Vigour Index is also higher at treatment ‘A’ for both the species but Seedling Vigour Index is found lower at treatment ‘B’ for Indian mustard and it is very low at treatment ‘D’ for Bengal gram [Figure 3].
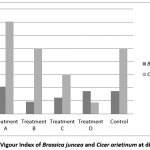 |
Figure 3: Seedling Vigour Index of Brassica juncea and Cicer arietinum at different treatment Click here to View Figure |
Water quality also leaves a noticeable effect on number of root hairs & length of root hairs. Higher number of root hair has found for both the species at treatment ‘A’& it is very lower for Bengal gram at treatment ‘D’. But for Indian mustard it is lower at treatment ‘C’ [Figure 4].
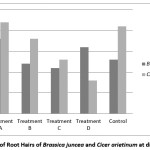 |
Figure 4: Number of Root Hairs of Brassica juncea and Cicer arietinum at different treatment Click here to View Figure |
During whole experiment it has seen that at treatment ‘B’ Bengal gram have higher length of root hair but also have lower length of root hair for Indian mustard [Figure 5]. Osmotic stress affects plant growth and development which induces by salinity. Salinity alters general metabolic processes & enzymatic activity causing harmful and adversely affects in the production.18 Light intensity also plays an important role on seedling growth.19 This light intensity depends on total solids of any water & also controls the temperature. May be seedling growth of Bengal gram is very lower at treatment ‘D’ as its total solids are very higher due to sewage disposal, wastes from industry, heavy metals and organic compounds accumulating in canal water. But for Indian mustard, this species may be coping up at low light & temperature that is why high total solids did not affect too much on seedling growth. The pH greatly affects chemical reactions. If the water pH is highly alkaline, many of micronutrients precipitate out and if it is acidic, then micronutrients become extremely soluble and ion levels may become high enough to injure the plant.20 Rana et al. (2012) observed the effect of raw dairy waste water, chemical treatment and physical treatment on seed germination and growth of Abelmoschus esculentus and found Abelmoschus esculentus was able to meet its nutrient requirements from waste water treated and showed good and enhancing the growth of plants.21
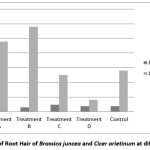 |
Figure 5: Length of Root Hair of Brassica juncea and Cicer arietinum at different treatment Click here to View Figure |
Depending on the nutrient uptake, synthesis, availability of beneficiary plant nutrients chlorophyll content varies with the quality of water. Water stress reduces the chlorophyll content. In the present study highest chlorophyll content is found for Bengal gram at treatment ‘C’ and lowest content found for Indian mustard at same treatment. Chlorophyll ‘a’ ranging from 0.51 mg/g to 0.66 mg/g for Indian mustard and 0.84 mg/g to 1.21 mg/g for Bengal gram. Chlorophyll ‘b’ ranging from 0.35 mg/g to 0.45 mg/g for Indian mustard and 0.60 mg/gm to 1.67 mg/gm for Bengal gram [Figure 6]. Khan et al., (2011) suggested that higher concentration of waste water are inhibitory to synthesis of chlorophyll molecules particularly chlorophyll ‘a’.22 Giri et al., (2013) observed the concentration of chlorophyll ‘a’ in the leaves of Mangifera indica at polluted sites was recorded as 1.87 ± 0.35 mg/g &2.37 ± 0.42 mg/g at control site.23 Das (2012) found germination efficiency, seedling length, Seedling Vigour Index & total chlorophyll content to be increased with increase in concentration of sewage up to 50% dilution after which it decreases. 24 According to Prabhakar et al. (2004) the significant fall in the chlorophyll content under the higher percentage of effluent concentration may be due to inhibitory effect of toxicants of effluent on chlorophyll synthesis in exposed plant.25
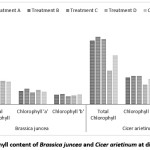 |
Figure 6: Chlorophyll content of Brassica juncea and Cicer arietinum at different treatment Click here to View Figure |
The amount of total carbohydrate varies from0.58 mg/ml to1.12mg/ml in shoot extract &1.74 mg/ml to2 mg/ml in root extract of Indian mustard. The total carbohydrate varies from 0.5mg/ml to 1.38 mg/ml in shoot extract & 2.4 mg/ml to 4.64 mg/ml in root extract for Bengal gram [Figure 7].
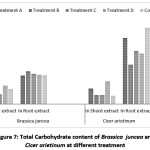 |
Figure 7: Total Carbohydrate content of Brassica juncea and Cicer arietinum at different treatment Click here to View Figure |
Divyapriya et al., (2014) found higher carbohydrate content in 30% effluent treated seeds than in control. The increased level may be due to increased amylase activity & increased soluble sugars.14 Increased accumulation of sugars has been reported in many plant species exposed to salinity.26, 27, 28 The reduction of photosynthesis& metabolic alterations by sugar accumulation could contribute to salt sensitivity which limits the growth of salt sensitivity cultivar under salt stress conditions.29
In the present investigation the total reducing sugar was found 0.27mg/ml to 0.66 mg/ml for shoot extract of Indian mustard & 0.22 mg/ml to 0.86 mg/ml for shoot extract of Bengal gram. There highest value of reducing sugar of Indian mustard for root extract is 0.55 mg/ml at treatment ‘A’ and 1.34 mg/ml at treatment ‘C’ for Bengal gram [Figure 8].
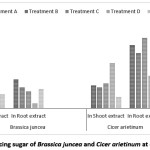 |
Figure 8: Total Reducing sugar of Brassica juncea and Cicer arietinum at different treatment Click here to View Figure |
Protein content was found higher in Indian mustard than Bengal gram both for shoot and root extract. At treatment ‘B’ for Indian mustard it is 1.15 mg/ml for shoot extract & 0.65 mg/ml for root extract. There for Bengal gram it is 0.36 mg/ml for shoot extract & 0.30 mg/ml for root extract [Figure 9]. Thakur and Rai (1982) found significant changes in protein content in two maize cultivars differing in drought resistance.30 Lin et al., (1990) has reported an increase in protein amount wheat leaves treated by magnetic water. Magnetic water increase protein biosynthesis in few cases.31 Babaloo et al. (2015) reported difference in total protein content belonged to magnetic water (0.9315 mg/ml) and nonmagnetic water (0.8025 mg/ml).32
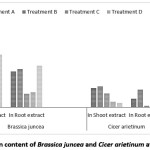 |
Figure 9: Total Protein content of Brassica juncea and Cicer arietinum at different treatment Click here to View Figure |
Total DNA count varies from 30.25 mg/L to 134.75 mg/L for two species in shoot extract and 16.5 mg/L to 99 mg/Lin root extract [Figure 10]. At treatment ‘A’, Indian mustard showed very high DNA content in shoot extract than other treatment.
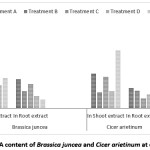 |
Figure 10: Total DNA content of Brassica juncea and Cicer arietinum at different treatment Click here to View Figure |
Fonseca et al., (2012) revealed that the possibility of observed DNA damage could be related to cytotoxic rather than genotoxic effects of cytindrospermopsin (CYN) & its related byproducts.33 Humpage et al., (2005) demonstrated the ability of CYN to induce DNA strand breaks in primary mouse hepatocytes.34 So presence of toxic bacteria in water also effect in the growth of plants. As microbial load of treatment ‘A’ is lower than other treatment and may be cyanobacterial load is low that is why the DNA breakage is prevented. At treatment ‘D’ bacterial load is very high, for that reason we may have found low DNA count in shoot extract.
Statistical Analysis
By using SPSS Statistical software Pearson’s correlation coefficient was measured to check the association between variables and correlation(r value) is significant or not at the 0.05 and 0.01 levels. In most the cases the correlation between two parameters, where one is physico-chemical parameter of water quality and another isgrowth parameter or biochemical assessment parameter of two treated plants(variables) is negative and significant at 0.05 levels. Mostly the label of rstands at – .4 to -.59 that means negative moderate. Correlation between biological oxygen demand and total shoot carbohydrate of two treated plants is strong and it showed positive correlation. Correlation between biological oxygen demand and total reducing sugar of root extract of Indian mustard is very strong but when correlation was checked between C.O.D. and Seedling Vigour Index of both plants, it was weak and not significant. Correlation between C.O.D. and total reducing sugar of shoot extract of both plants, relation is significantly positive. Statistical analysis results are presented in table 5.
Table 5: Table for Statistical Analysis
| Correlation checked between variables | Pearson correlation(r-value) | Interpretation | p-value |
| Total solids and SVI | -.477 | Negative moderate | .034** |
| Total solids and root length of treated plants | -.505 | Negative moderate | .023** |
| Total solids and total DNA in root extract of treated plants | -.446 | Negative moderate | .049** |
| C.O.D. and chlorophyll content of treated plants | -.493 | Negative moderate | .012** |
| C.O.D. and total reducing sugar of shoot extract of treated plants | +.452 | Positive moderate | .046** |
| C.O.D. and SVI | -.381 | Negative weak | .097 |
| B.O.D. and total shoot carbohydrate of treated plants | +.731 | Positive strong | .016** |
| B.O.D. and total reducing sugar of root extract of Indian mustard | -.847 | Negative very strong | .002* |
| B.O. D. and protein of shoot extract of Indian mustard | -.428 | Negative moderate | .033** |
| B.O.D. and protein of shoot extract of Bengal gram | -.530 | Negative moderate | .042** |
| * Significant at .01 level (2-tailed) ** Significant at .05 level (2-tailed) |
|||
The correlation studies among different physico-chemical parameters of treated water and growth parameter or biochemical assessment parameter of two treated plants (variables)would certainly provide an idea, which might be utilized for selection of desirable parameters for future plantation. The significant positive correlation between desirable characters is favorable to a plant breeder because it might help in simultaneous improvement of both the characters. On the other hand, the negative correlation would hinder the synchronized expression of both the characters.35 From negative significant r value it can be concluded that there is an inverse relationship between two variables. B.O.D. and total reducing sugar of root extract of Indian mustard shows a very strong anticorrelation indicate that, when water is much polluted, the reducing sugar of root extract values are got down. When B.O.D. is increasing, shoot carbohydrate also increases because high B.O.D. water is warmer water. According to Rafael V. R. et al., (2012) mature leaves had higher concentration of carbohydrates when plants were grown under warmer conditions, being the starch concentration at 30/20ºC around 4.5 times higher than the one found at 25/20ºC. Young leaves followed the same pattern of response to thermal treatment.36 C.O.D. and total reducing sugar of shoot extract of treated plants correlation is a positive correlation may be due to bio fertilizer and chemical fertilizers which increase the carbohydrates content.37 In most cases the correlation coefficients are found moderate as the plants are treated only for 15 days with treated water. D. Panda et al., (2015) found that number of pods per plant, number of seeds per plant, 1000 seed weight, total aerial biomass, harvest index are the major contributors towards grain yield since these characters had high correlation in chickpea.38 U. A. Burio et al., (2004) observed the correlation coefficient values of growth and yield traits of Kiran-95 wheat variety under different nitrogen levels and placements which will help in estimating the degree of relationship which could be used for predicting the response of yield in any crop.39
From the above result it can be concluded that depending on quality of water the growth parameters as well as the biochemical parameters also change species wise. As seedling growth and seed germination is different, so we have found a variation in Seedling Vigour Index. Although treatment ‘D’ is quality wise very poor but due to abundance of minerals the seedling length is higher than treatment ‘B’, ‘C’ and ‘T’ for Indian mustard. But this same quality water show very low seedling length for Bengal gram. Brassica juncea shows high tolerance to pollutants but Cicer arietinum shows low tolerance to pollutants in this case. Treatment ‘D’ also showing highest carbohydrate concentration for shoot extract in both the species. There at treatment ‘B’ highest chlorophyll content is found for both the species. Treatment ‘A’ shows highest DNA content in shoot extract for Indian mustard. Statistical analysis help to understand the relationship between two variables and from negative relationship of variables it can be concluded that when water pollution level increases it decreases the level of growth parameters of plants in most cases. Overall above study could be helpful to understand the plant’s nature against different quality of water that could be helpful for future agriculture purposes.
Conclusion
The paper discusses the effect of some polluted water bodies. Two seed varieties were subjected to germination spiked with the polluted water samples. Detrimental effect on them were asseed with the aid of some biochemical parameters. It was seen the that water from staions 1,2 & 3 had some effect but the most detrimental effect was observed in the water from station 4. The study concludes that the water bodies demand for an immediate remediation and restoration of the water quality as most of them have human- animal interface activities and anthropological activities too. Further studies may be conducted on the exact nature of the toxicant in the water and suitable measures can be adopted to restore the quality of water.
Acknowledgement
This work was carried out on a self-funded initiative. However, the authors are thankful to the department of Food Technology and Biotechnology, Haldia Institute of Technology, Haldia, WB, India for the infrastructural support provided during the study.
Funding
This work was carried out on a self-funded initiative.
Conflict of Interest
The authors do not have any conflict of interest.
References
- Raman S., Biswas A.K., Kundu S., Saha J.K., Yadav R.B.R. Effect of distillery effluent on seed germination in some vegetable crops. Bioresource Technology. 2002: 82: 273–275.
- Saravanamoorthy M.D., Ranjitha K. B.D. Effect of textile waste water on morpho-physiology and yield on two varieties of peanut (Arachis hypogea L.). Journal of Agricultural Technology. 2007: 3: 335–343.
- Pandey S.N., Nautiyal B. D., Sharma C.P. Pollution level in distillery effluent and its phytotoxic effect on seed germination and early growth of maize and rice. Journal of Environmental Biology. 2008:29(2): 267-270.
- Pathrol M. and Bafna A. Effect of sewage on Growth Parameters and Chlorophyll content of Trigonella foenum graecum (Methi). International Research Journal of Environment Sciences. 2013:2(9):5-9.
- Bama Ezhil M. Effect of Dairy Effluent on Germination and Morphological changes Associated With the Growth of Oryza sativa Seeds. International Journal of Agricultural and Food Science. 2014:4(3): 90-93.
- Abdul B., A.A. and Anderson J.D. Vigor determination in soybean seed by multiple criteria. Crop Science. 1973:13: 630- 633.
- Masuthi D., Mukesh L., Chavan L., Khaja Rubina S., Ramangouda S.H., Abdul Kareen M., Itagi P., Mohammed W., Kulkarni S., Tejagouda B., and Haleshkumar B. Different priming treatments on germination and viability of cluster bean seeds.International Journal of Advanced Research. 2015: 3(5): 108-111.
- Witham F.H., Blaydes D.F., Devlin R.M. Experiments in plant physiology Van Nostrand, New York. 1971: 2(3): 245-248.
- https://biochemden.com/anthrone-method
- Miller G. L. Use of Dinitrosalicylic Acid Reagent for Determination of Reducing Sugar. Analytical Chemistry. 1959: 31(3): 426-428.
- Marion M. BradfordA Rapid and Sensitive Method for the Quantitation of Microgram Quantities of Protein Utilizing the Principle of Protein-Dye Binding. Analytical Biochemistry. 1976:72: 248-254.
- Estimation of DNA using diphenylamine method- NPTEL
- Maity M., Banerjee, R. Seasonal Variations in Physico- Chemical and Microbiological Parameters as Indication to Surmounting Pollution in some Selected Water bodies in a Port City in West Bengal. EM International. Poll Res. 2018:37(2):565-573.
- Divyapriya S., Dimi D., Deepthi K. P. Biochemical Effect of Industrial Effluence on Germinating Seeds of Cicerarientum. International Journal of Pharmacy and Pharmaceutical Sciences. 2014: 6(2): 538-542.
- Nagajyoti P. C., Dinakar N., PrasadT.N.V.K.V.,Damodharan S.C. Heavy metal toxicity: Industrial effluent effect on groundnut (Arachis hypogaea) Seedling. Journal of Applied Science Research. 2008:4(1): 110-121.
- Agarwal S.K., Swarnlata T., Dubey S.P. Sources of water pollution in Biodiversity and Environment APH-Publishing corporation, New Delhi. 1996: 3(7): 180-182.
- Unger L.A. Halophyte seed germination. Botanical Review. 1987: 44: 233-264.
- Hameed A., Naseer S., Iqbal T., Syed H., Haq A. M. Effects of NaCl Salinity on Seedling Growth, Senescence, Catalase and Protease Activities in Two Wheat Genotypes Differing in Salt Tolerance. Pak. J. Bot. 2008:40(3): 1043-1051.
- Brix H. Growth response of Sitka spruce and white spruce seedlings to temperature and light intensity. Can. Dep. Environ.https.wikipedia.org/wiki/Seedling.
- MG Manual Reference. Environmental Factors That Affect Plant Growth. University of Arizona. 1: 34-38:
- Rana I., Khaleel, N.I., Mahamad. H. Ibrahim. The Impact of Waste Water Treatments on Seed Germination and Biochemical Parameter of Abelmoschus esculentusL. Procedia – Social and Behavioral Sciences. 2013:91: 453 – 460.
- Khan M.G., Danle G.L., Konji M., Thomas A., Eyasu S.S. and Awoke G. Impact of textile waste water on seed germination and some physiological parameters in pea (Pisum sativum L.), Lentil (Lens esculentum L.) and gram (Cicer arietinum L.).Asian Journal of Plant Science. 2011: 10: 269-273.
- Giri S., Shrivastava D., Deshmukhi K., Dubey P. Effect of Air Pollution on Chlorophyll Content of Leaves. Current Agriculture Research Journal. 2013:1(2): 93-98.
- Das K. A. Impact of Domestic Waste Water on Seed Germination and Physiological Parameters of Rice and Wheat.IJRRAS. 2012:12 (2).
- Prabhakar P. S., Mall M. and Singh J. Impact of fertilizer factory effluent on SeedGermination, Seedling growth and Chlorophyll content of Gram (Cicer arietinum). J. Environ. Biol. 2004: 27 (1):153-156.
- Dubey R.S., Singh A.K. Salinity Induces accumulation of Soluble Sugars and Alters The Activity of Sugar Metabolizing enzymes in Rice Plants. Biol Plantarum. 1999:42: 233-239.
- Flowers T. J. Improving Crop Salt Tolerance. J. Exp. Bot. 2004:55: 307-319.
- Pattanagul W., Thitisaksakul M. Effect of Salinity Stress on Growth and Carbohydrate Metabolism in Tree Rice (Oryza sativa L.) Cultivars Differing in Salinity Tolerance. .Indian J. Exp. Biol. 2008:46: 736-742.
- Amirjani R. M. Effect of Salinity Stress on Growth, Sugar Content, Pigments and Enzyme Activity of Rice. International Journal of Botany. 2011:7(1): 73-81.
- Thakur P. S., Rai V. K. Effect of Water Stress on Protein Content in Two Maize Cultivars Differing in Draught Resistance. BiologiaPlantrum. 1982: 24: 96.
- Lin I. J, Yotvat J. Exposure of Irrigation and Drinking Water to a Magnetic Field withControlled Power and Direction. J MagnMagn Mater. 1990: 83: 525-526.
- Babaloo F., Majd M., Arbabian S., Niya S.F., Ghanati F. The study of magnetic water effect on the total protein content, and the activity of catalase, peroxidase and superoxide dismutase of rice (OryzasativaL.)Var Hashemi. DAV International Journal of Science. 2015: 4(4).
- Fonseca A. L., Lankoff A., Azevedo O. F. M. S.,Soares M. R. Effects on DNA and cell viability of treated water contaminated with Cylindrospermopsisraciborskiiextract including cylindrospermopsin. Ecotoxicol. Environ. Contam. 2013:8(1): 135-141.
- Humpage A.R., Fontaine F., Froscio S., Burcham P., Falconer I.R. Cylindrospermopsin genotoxicity and cytotoxicity: role of cytochrome P-450 and oxidative stress. J. Toxicol. Environ. Health. Part A. 2005: 68: 739-753.
- Shiva B., Nagaraja A., Srivastav M. and Goswami A.K. Correlation studies among vegetative, fruit physic-chemical characters of guava (Psidium guajava L.).International Journal of Agriculture Sciences. 2017:9(26): 4322-4324.
- Rafael V. R., Eduardo C. M., Erick E.-N.,Rômulo A. R., Daniela F. S. P. M. Moderate warm temperature improves shoot growth, affects carbohydrate status and stimulates photosynthesis of sweet orange plants.Brazilian. Journal. Plant Physiol. 2012:24 (1).
- PatilN.M. Biofertilizer effect on growth, protein and carbohydrate content in Stevia rebaudianaVarBertoni.Recent Research in Science and Technology. 2010: 2(10): 42-44.
- Panda D., Sen A., Dhakre D. S. and Mondal Correlation analysis of some growth, physiological parameters, yield and yield attributes of chick pea (Cicer arietinum).International Journal of Bio-Resource, Environment andAgriculture Sciences. 2015:1(3):90-95.
- Burio U. A., Oad F. C. and Agha S. K. Correlation Coefficient (r) values of growth and yield components of wheat under different nitrogen levels and placements.Asian Journal of Plant Sciences. 2004: (3); 372-374.