Introduction
Chickpea (Cicer arietinum L.) is the fourth most imperative grain legume crop subsequently following soybean, bean, and pea, but the crop contributes only 3.1% to the world grain legumes production.1 It is a self-pollinated crop species, having 2n = 2x = 16 chromosomes and genome size of 732 Mb.2 Chickpea is a plenteous source of carbohydrates and proteins, together rendering about 80% of the entire seed dry weight. The chickpea grains are rich in minerals and vitamins, and also it is an ample source of livestock feed. Knowledge and management of the genetic diversity in cultivated and wild relatives are analytical for any crop improvement programs. Prior to the discovery of PCR-based markers Hybridization, seed protein electrophoresis and isozyme analysis, were used to establish genetic relationships among the Cicer species.3, 4 Subsequently, molecular markers like as RAPD, RFLP, AFLP, ISSR, and SSR (also known as microsatellites) were utilized to assess the genetic diversity and species relationships in chickpea; with most of these studies specifically narrating generous diversity in wild Cicer sp. but limited variation in cultivated chickpea.5-11 Accordingly, germplasm characterization is a crucial link between the conservation and application of plant genetic resources. With this background the present study has been undertaken to assess the genetic diversity in chickpea genotypes at morphological and molecular level for the selection of most diverse genotypes for future breeding program.
Materials and Methods
Seven chickpea genotypes including some cultivars were considered in this study. The genotypes were collected from different parts of India, by Central Germplasm Conservation Unit, Directorate of Research, Uttar Banga Krishi Viswavidyalaya. The collections were from diverse agro-ecological zones of the major chickpea production areas in India. The experiment was conducted at Agricultural Research Farm, Regional Research Station Terai Zone, Pundibari, Coochbehar, West Bengal. The site is located at latitude 26o23′57′′ N and longitude 89o23′15′′ E with an altitude of 44 m above mean sea level. The soil of the study area was developed on alluvial deposits under the influence of high rainfall and intense leaching, coarse textured, poor in water retention with low pH and CEC with high in Al saturation. It is characterized by multiple nutrition deficiencies including some of the micronutrients (B, Mo, and Zn). The area experienced typical sub-tropical pre-humid climate with high annual rainfall (higher than 3000 mm), high relative humidity (avg. max. and min. of 95 % and 65%, respectively) and moderate air temperature (avg. max. and min. of 31oC and 11oC, respectively).12 The experiment was laid out in Random Complete Block Design (RCBD) with three replications. Cultivation practices and weeding were carried out as and when necessary. The numerical values for all the characters were estimated from the analysis of genetic component and variance was conducted to check the significant difference among the genotypes in respect to those characters at 1% and 5% probability level. Quantitative data were analyzed by using GENRES v. 3.11 software and SPSS v. 16.0 software .13-16
Molecular characterization was done utilizing RAPD marker systems. RAPD techniques are maker system because they are help to find the unknown polymorphic DNA fragments but SSRs are used to visualize known polymorphic DNA loci. High quality genomic DNA was required for all the molecular analysis. Seven genotypes of chickpea were used to investigate the level of polymorphism detected by RAPD. Fresh leaf samples were collected in the icebox at morning from the site of field experimentation. DNA was extracted from leaf samples following the methods developed by Mandal et al.,17 The quality of extracted DNA was evaluated by agarose gel electrophoresis (0.8%), succeeded by ethidium bromide staining. The purity of the DNA was estimated by spectrophotometry using A260/A280 ratio, and the yield was estimated by measuring absorbance at 260 nm. A set of six screened random decamer oligonucleotide primers18 were used for RAPD analysis (Table 4). Each 25μl of PCR mixture consisted of 20 ng of template DNA, 100 μM of each deoxynucleotide triphosphate, 20 ng of decanucleotide primers (Sigma-Aldrich, USA), 1.5 mM MgCl2, 1X Taq buffer (supplied with the Taq Polymerase enzyme), 1U of Taq DNA polymerase (Xcelris Genomics, India). Amplifications were carried out in Veriti Thermal Cycler (Applied Biosystems, USA). The PCR reaction mixtures were denatured at an initial step of 94°C for 3 min and then commanded to 35 cycles of following programme: 94°C for 30 s, 40°C for 45 s and 2°C for 1 min. After the last cycle temperature was confined at 72°C for 5 min. Amplified PCR products were resolved on a 1.5% agarose gel consisting 0.5 mg/mlethidium bromide and visualized under UV light. Gel photographs were captured through Gel Doc System (QUANTUM-ST4, LED’s bar Epi-illumination, France). Clear bands were discovered and were scored for their presence (1) or absence (0). All profiles were reproducible and accorded distinct and easy scoring bands.
Results and Discussion
Analysis of variance revealed significant diversity among the genotypes for all the 10 characters (Table 1). A wide range of variability was exhibited by most of the characters under study.
Table 1: Analysis of variance based on ten quantitative characters for chickpea.
| Source of Variation | df | PH | NOB | NOPP | NOS | TW | SL | SB | DTF | DTM | GY |
| Replication | 2 | 0.58 | 0.52 | 24.31 | 0.01 | 11.59 | 0.09 | 0.12 | 1.19 | 0.05 | 10781.71 |
| Treatment | 6 | 46.91** | 0.86** | 46.91** | 0.61** | 65.76** | 1.01** | 0.84** | 14.54** | 0.09** | 35249.78** |
| Error | 12 | 1.37 | 0.07 | 1.37 | 0.01 | 2.61 | 0.12 | 0.07 | 0.82 | 0.55 | 4303.82 |
** Significant at 1% alpha level
[PH: Plant Height; NOB: Number of Branches per plant; NOPP: Number of pod per plant; NOS: Number of Seeds per pod; TW: Test Weight; SL: Seed Length; SB: Seed Width; DTF: Days of to 50% flowering; DTM: Days to 50% maturity; GY: grain Yield]
The estimates of genotypic and phenotypic covariance (GCV and PCV, respectively), broad sense heritability (h2), and genetic advance in percentages of means (GAM) are indicated in Table 2. The magnitude of phenotypic coefficient of variation (1.23 % – 33.71%) in the present study was slightly wider than GCV (1.13 % -33.02%) suggesting that environmental factors have high contribution to the observed variation among chickpea accessions. In general, it was revealed that the chickpea accessions used in this study were phenotypically and genotypically diverse. This indicates the existence of large diversity in chickpea for quantitative characters. All the characters showed high heritability with estimates ranged from 70.56% for grain yield per plant to 95.96% for number of pod per plant (Table 2).
Table 2: Genotypic, phenotypic and enviornmental covariance heritability and genetic advance for 10 quantitative characters of Chickpea.
| Traits | GCV | PCV | ECV | Heritability (%) | Genetic Advance of Mean |
| PH | 8.64 | 9.02 | 2.59 | 91.73 | 17.04 |
| NOB | 10.75 | 12.12 | 5.58 | 78.77 | 19.66 |
| NOPP | 33.02 | 33.71 | 6.78 | 95.96 | 66.64 |
| NOS | 32.56 | 33.38 | 7.35 | 95.15 | 65.42 |
| TW | 24.39 | 25.86 | 8.59 | 88.97 | 47.39 |
| SL | 6.66 | 7.92 | 4.29 | 71.00 | 11.54 |
| SB | 8.84 | 10.01 | 4.70 | 77.95 | 16.07 |
| DTF | 2.94 | 3.19 | 1.23 | 85.1 | 5.59 |
| DTM | 1.13 | 1.23 | 0.49 | 83.91 | 2.13 |
| GY | 7.66 | 9.11 | 4.94 | 70.56 | 13.25 |
[PH: Plant Height; NOP: Number of Branches per plant; NOPP: Number of pod per plant; NOS: Number of Seeds per pod; TW: Test Weight; SL: Seed Length; SB: Seed Width; DTF: Days to 50% flowering; DTM: Days to 50% maturity; GY: grain Yield]
The estimates of genetic advance in percentages of means were highest for number of pod per plant (66.64%). Johnson et al.,19 suggested for consideration of both, heritability and genetic advance together to selection of superior genotypes. The heritability and genetic advance as per cent of mean was high for number of pod per plant, number of seeds per pod and test weight, which indicates the preponderance of additive gene action.
Path Coefficient Analysis
Path coefficient analysis at genotypic level showed that number of seeds per pod had a maximum direct positive effect on grain yield per plant (p = 0.99) followed by number of pod per plant (p=0.97), seed length (p=0.72), number of branch per plant (p=0.43), plant height (p=0.41) and width of seed (p=0.37) (Figure 1).
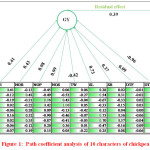 |
Figure 1: Path coefficient analysis of 10 characters of chickpea. |
On the other hand, the maximum negative direct effect of days to maturity on grain yield per plant may be explained by the fact that the late maturity of grain reduced the total yield. The residual effect (0.39) is relatively low indicating that the characters considered in this analysis successfully explained the variation existing in the accessions of chickpea. Therefore, selection based on these characters is efficient to maximize grain yield as well as future improvement program of chickpea.
Principal Component Analysis
The eigen values depicting the variance of the principal components and the cumulative percent of the eigen values expressing percentage contribution to the total variance attributable to each principal component are given in Table 3.
Table 3: Eigen values and percentage of variation for corresponding four components in seven genotypes of chickpea.
| Component | Eigen Value | % of Variance | Cumulative % |
| 1 | 4.247 | 42.470 | 42.470 |
| 2 | 2.435 | 24.351 | 66.821 |
| 3 | 1.328 | 13.283 | 80.104 |
| 4 | 1.152 | 11.525 | 91.629 |
Eigen vectors implying the degree of association among original data and each principal component have also been expressed 20. The first four PC axes estimated for 91.63% of the multivariate variation among entries illustrating a moderate degree of correlation among characters for these entries. The first principal component accounted for 42.47% of variation mostly influenced number of branch per plant, seed length, seed width, test weight and days to maturity. The second component accounted for 24.35% of the variance and thus was comparable in importance to the first. The characters with the largest coefficients and which contributed to it were grain yield, plant height, and seed width and seed length. Plant height, number of seeds per pod and days to maturity had some importance in the third component. Although there is no clear distinction between important and trivial principal components, it is impressive to note that seed length, seed width, days to maturity, grain yield and plant height appears firmly in the first four components. It indicates that these characters have maximum variability among the genotypes.
Scree plot elucidated the percentage variance associated with each principal component attained by drawing a graph between eigen values and Principal component numbers (Figure 2). PC1 showed 42.47% variability with eigen value 4.23 in germplasm which then reduced gradually. Elbow type line is obtained which after 7th PC tended to straight. After that little variance observed in each PC and it ended at 7.35 x 10⁻¹⁶% at 10th PC with eigen value 7.35 x 10⁻¹⁷. From graph it was cleared that maximum variation was present in first PC. So selection of genotypes from this PC will be useful.
![Figure 2: Scree plot [A] and component plot [B] of 10 characters of chickpea](http://www.agriculturejournal.org/wp-content/uploads/2017/03/Vol5_No1_Unl_Rup_Fig2-150x150.jpg) |
Figure 2: Scree plot [A] and component plot [B] of 10 characters of chickpea. Click here to View figure |
A Principal component plot showed that variables are super imposed on the plot as vectors. Distance of each variable with respect to PCl and PC2 showed the contribution of this variable in the variation of germplasm (Figure 2A & 2B). In our study, it has been showed that seed length, seed width, days to maturity, grain yield and plant height are more important towards the variability for the selection of germplasm. While, in PCl only most of the yield contributing traits were responsible for the variability which were good for further use of this germplasm in breeding programs.
Based on 10 quantitative characters seven genotypes were grouped in to two clusters. Cluster I had the six genotypes and cluster II have only one genotype (Figure 3).
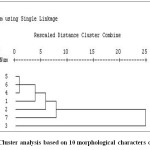 |
Figure 3: Cluster analysis based on 10 morphological characters of chickpea. Click here to View figure |
Characterization using RAPD marker system
Analysis of polymorphism and marker efficiency
The data collected from random amplification of polymorphic DNA with six arbitrary primers produced 30 loci in total with 145 amplicons. Out of the 30 loci produced, 25 were polymorphic, amounting to a total polymorphism percentage of 81.67 (Table 4). Four primers out of the 6 analyzed, produced more than 80% polymorphism. The primers OPA-04, OPE-06, OPE-12 were showed 100% polymorphism in the population. Examples of RAPD profile OPA-01, OPE-01, OPE-12, OPA-04, OPE-06 and OPE-19 14 are presented in Figure 4.
Table 4: Various parameters related to efficiency of 6 primers for RAPD analysis.
| Primer | NTB | NTP | PP | PIC | DI | Rp | MI |
| OPA-01 | 5.00 | 4.00 | 80.00 | 0.20 | 0.44 | 1.42 | 10.68 |
| OPA-04 | 3.00 | 3.00 | 100.00 | 0.44 | 0.31 | 2.02 | 9.18 |
| OPE-01 | 5.00 | 3.00 | 60.00 | 0.18 | 0.80 | 1.14 | 14.33 |
| OPE-06 | 10.00 | 10.00 | 100.00 | 0.36 | 0.48 | 5.42 | 14.33 |
| OPE-12 | 3.00 | 3.00 | 100.00 | 0.35 | 0.59 | 1.44 | 17.55 |
| OPE-19 | 4.00 | 2.00 | 50.00 | 0.22 | 0.67 | 1.44 | 10.10 |
| Mean | 5.00 | 4.17 | 81.67 | 0.29 | 0.55 | 2.15 | 12.69 |
[PIC: Polymorphic Information Content; DI: Diversity Index; MI: Marker Index; RP: Resolving Power: NTB: Number of Total Bands; NPB: Number of Polymorphic Band; PP: Percentage of Polymorphism]
The polymorphic Information Content (PIC) values ranged from 0.23 (OPE-01) to 0.44 (OPA-04) with an average value of 0.29, indicating hypervariability among the accessions studied. The maximum diversity index (DI) was recorded for the primer OPE-01 (0.80), followed by OPE-19 (0.67), OPE-12 (0.59), OPE-06 (0.48) and OPA-01 (0.44) with an average value 0.55. The lowest DI was found for the primer OPA-04 (0.31).
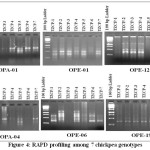 |
Figure 4: RAPD profiling among 7 chickpea genotypes. |
The average marker index (MI) value for the RAPD primers was 12.69. The highest MI value was found for the primer OPE-12 (17.55) and the lowest for the primer OPE-04 (9.18). Out of 6 RAPD primers only one primer has MI values greater than 15.00. The estimated resolving power (RP) value was highest for the primer OPE-06 (5.42) followed by OPA-04 (2.02), OPE-12 (1.44), OPE-19 (1.44) and OPA-01 (1.42) and with the average value 2.15. The lowest RP value found for the primer OPE-01 (1.14). RP values ranged from 1.14 to 5.42 indicating the low variability in the discriminating capacity of the primer.
Associations between the maximum efficiency parameters were non-significant. The DI showed the negative relation with the Resolving Power (Table 5). However, the PIC value showed positive relation with other parameters except DI. This result indicates that all the efficiency parameters were not equally important and selection of primer on the basis of MI value will be effective for future study.
Table 5: Correlation coefficient between efficiency parameters of RAPD primers.
| Parameters | PIC | DI | RP | MI |
| PIC | 1.00 | |||
| DI | -0.69 | 1.00 | ||
| RP | 0.45 | -0.34 | 1.00 | |
| MI | 0.05 | 0.43 | 0.15 | 1.00 |
[PIC: Polymorphic Information Content; DI: Diversity Index; MI: Marker Index; RP: Resolving Power]
Cluster analysis of 7 chickpea genotypes using RAPD profiling
The genotypic data generated through RAPD profiling of 7 chickpea genotypes were used to study genetic diversity or interrelationship. The pair wise Jaccard’s similarity coefficient ranged from 0.47 (TZCP-3 and TZCP-5) to 0.87 (TZCP-2 and TZCP-4 and TZCP-3 and TZCP-5). The dendrogram based on UPGMA clearly revealed two major clusters (Figure 5). The cluster II was the largest with 4 (57.14%) accessions followed by cluster I with 3 (42.85%) accessions. In order to validate efficiency of primers in distinguishing genetic diversity, PCA was performed, which supported the results of cluster analysis using pair wise Jaccard’s similarity coefficient (Figure 6). The genetic distances predicted on the support of 6 primers presented a vast range citing that chickpea genotypes personify genetically diverse populations. Selection for breeding programmes can be done from the obtained clustering patterns and the genetic relationship.
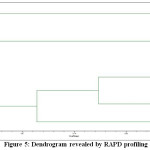 |
Figure 5: Dendrogram revealed by RAPD profiling. |
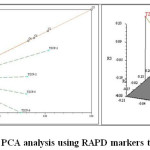 |
Figure 6: PCA analysis using RAPD markers technology. Click here to View figure |
Acknowledgements
The authors are thankful to Regional Research Station, Terai Zone, UBKV, Pundibari, India for providing all the funds during the research work. We do sincerely acknowledge Mr. Kuddus Alam for his generous help throughout the research work.
References
- Upadhyaya H. D., Dwivedi S.L., Baum M., Varshney R.K., Udupa S.M., Gowda C.L.L., Hoisington D., Singh S., Genetic structure, diversity, and allelic richness in composite collection and reference set in chickpea (Cicer arietinum L.). BMC Plant Biology., 8 (106), 1-12 (2008).
CrossRef - Arumuganathan K., Earle E.D., Nuclear DNA content of some important plant species. Plant Molecular Biology Reporter. 9, 208-219 (1991).
CrossRef - Labdi M., Robertson L.D., Singh K.B., Charrier A. Genetic diversity and phylogenetic relationships among the annual Cicer species as revealed by isozyme polymorphism. Euphytica, 88, 181-188 (1996).
CrossRef - Kazan K., Muehlbauer F.J., Allozyme variation and phylogeny in annual species of Cicer (Leguminosae). Plant Systematics and Evolution. 175, 11-21 (1991).
CrossRef - Sharma P.C., Winter P., Bunger T., Huttel B., Weigand F., Weising K., Kahl G. Abundance and polymorphism of di-, tri-, and tetra-nucleotide tandem repeats in chickpea (Cicer arietinum L.). Theoretical and Applied Genetetic, 90, 90-96 (1995).
CrossRef - Sant V.J., Patankar A.G., Sarode N.D., Mhase L.B., Sainani M.N., Deshmukh R.B., Ranjekar P.K., Gupta V.S., Potential of DNA markers in detecting divergence and in analysing heterosis in Indian elite chickpea cultivars. Theoretical and Applied Genetics. 98, 1217-1225 (1999).
CrossRef - Iruela M., Rubio J., Cubero J.I., Gil J., Millan T., Phylogenetic analysis in the genus Cicer and cultivated chickpea using RAPD and ISSR markers. Theor Appl Genet. 104(4), 643-651 (2002).
CrossRef - Sudupak M.A., Akkaya M.S., Kence A., Analysis of genetic relationships among perennial and annual Cicer species growing in Turkey using RAPD markers. Theor Appl Genet. 105(8), 1220-1228 (2002).
CrossRef - Rajesh P.N., Sant V.J., Gupta V.S., Muehlbauer F.J., Rajesh P.K., Genetic relationships among annual and perennial wild species of Cicer using inter simple sequence repeat (ISSR) polymorphism. Euphytica, 129, 15-23 (2003).
CrossRef - Shan F., Clarke H.C., Plummer J.A., Yan G., Siddique K.H.M., Geographical patterns of genetic variation in the world collections of wild annual Cicer characterized by amplified fragment length polymorphisms. Theor Appl Genet. 110(2), 381-391 (2005).
CrossRef - Aggarwal H., Singh J., Pal K.T., Chhokar V., Genetic Diversity in chickpea using various Molecular Markers: First step towards Molecular Breeding. International Journal of Advanced Research. 1(4), 393-398 (2013).
- Coochbehar KVK (http://www.coochbeharkvk.in/) 10/10/2016.
- GENRES, Data entry module for genres statistical software Pascal Intl. software solution. Version 3.11, (1994).
- Babbie E., Halley F., Wagner W.E., Zaino JAdventures in social research: Data analysis using IBM® SPSS® statistics (7th edn.). Thousand Oaks, CA: Pine Forge Press (2010).
- Matsoukis A.S., Gasparatos D., Chronopoulou-Sereli A., Micronutrient content in relation to specific leaf area, light regime and drenched-applied paclobutrazol in Lantana camara L. Current Agriculture Research Journal 3, 101-104 (2015).
CrossRef - Ita B.N, Ariga E.S., Michieka R.W., Muiru W.M., Comparative efficiency of tillage practices in maize. Current Agriculture Research Journal, 2, 89-93 (2014).
CrossRef - Mandal R., Mukherjee A., Roy P., Tarafdar, J., Mandal N., Improved and convenient method of high quality DNA isolation from grasspea (Lathyrus sativus L.) : A protein rich crop, Trends in Biosciences, 7(16), 2106-2109 (2014).
- Datta S.K., Mandal R., Roy P., Mandal N., Tarafdar J., Detection of genetic diversity in Lathyrus sativus L. using RAPD marker system. International journal of Agriculture, Environment and Biotechnology, 7(4), 729-733 (2015).
- Johnson H.W., Robinson H.P., Comstoc R.E., Estimation of genetic and environmental variability in soybeans. Agron. J. 47, 314-318 (1955).
CrossRef - Naskar S.K., Sreekumar J., Evaluation of Taro (Colocasia esculenta (L.) Schott.) Germplasm Using Multivariate Analysis, Journal of Root Crops, 37(2), 150-154 (2011)