Introduction
Oilseed and pulses are the important part of human diet as they are rich sources of proteins and quality nutrition. There are several pulse and oilseed crops sown as commercial crops in India. In India, pulse crops occupy an area of 23.82 million hectares with a production of 14-15 million tones. In the Northern India, pulses are generally grown for home consumption and generally those fields are selected, which are not suitable for other cereal crop like paddy and wheat. As a result, pulses production is not fulfilled the demand of the present population of the country and these are imported to the tune of 0.5 to 1.5 million tones.5 They also play vital role in sustainable agriculture through the concept of crop diversification. A Technology Mission on Oilseeds and Pulses (TMOP) was organized for enhancing productivity and decreasing the use of foreign exchange on the import of these crops, which was about of Rs. 1000 crore per year. This mission followed an integrated policy using four partners as farmers, consumers, processing industry and trade for improving the economy of the country. Front line demonstration (FLD) was observed to be major constituent for the policy of TMOP. The FLDs are the one of the systematic methods to test the potential of technology at the farm by acquiring the participating farmers and its adoption by non-participating farmers. Modern crop management practices like fertilizer application, weed control and fungicide spray are developed and are generally seen these are not adopted by the farmers. There is observed a difference in productivity and returns from the crops due to the gap between recommended and farmers’ practices. The consideration of the above, the FLDs of gram were carried out by KVK, Amritsar at farmer’s fields in irrigated conditions in Rabi from 2009-10 to 2013-14. The goals of the study are given below:
- To study the performance of recommended gram varieties with the improved technologies under the irrigated conditions.
- To determine the yield difference of crop in local check (farmers’ field) and FLD
Materials And Methods
By Krishi Vigyan Kendra, Amritsar were conducted the front line demonstrations with recommended practices including improved varieties of gram at the farmer’s fields in 38 villages of district Amritsar (Punjab) under irrigated conditions during the years of 2009- 10 to 2013-14. A total 71 farmers were selected for conducting the FLDs. The area of one demonstration varies from 0.5 to 1.0 acre and total areas of 16 ha were used for conducting the demonstrations in 5 years. In one plot of the demonstration farmer’s practices were applied which was considered as control plot. One day training was given to the participating farmers of the respective villages to discuss with them the improved technologies from sowing to harvesting and other steps like site, farmer’s selection and lay out of the demonstration, before the sowing of the demonstration. Farmer-scientist interaction were organized at demonstration plots to disseminate the message among the other farmers. Data were collected from control (Farmer’s practice) and demonstration plots related to seed yield and cost of cultivation, net income and B: C ratio.
Table 1: Package of practices followed for demonstrations and control (farmers’ practice) plots in gram crop.
|
Sr. No.
|
Practices |
Demonstration |
Control (Farmers’ practice) |
|
1
|
Variety | PBG-5 | Non descript varieties |
|
2
|
Seed Rate | 60 kg/ha | Desi gram:35 kg/haKabuli gram: 80 kg/ha |
|
3 |
Seed Treatment | Chloropyriphos 20 E C + Captan @ 3g/kg seed + Rhizobium culture | Not applied |
|
4
|
Time of sowing | October 25 to November 10 | Last week of November |
|
5
|
Sowing depth | 10-12.5 cm | Shallow depth |
|
6 |
Weed control | Pre-emergence spray of pendimethalin @ 2.5 litre/ha | Some farmers do one hoeing |
|
7 |
Fertilizer dose | Urea @ 32.5 kg/ha and SSP @ 125 kg/ha(On soil test basis) | Irrational use of nitrogenous fertilizers and non application of SSP |
|
8
|
Method of fertilizer application | Fertilizers drilled at the time of sowing | Broadcasting |
|
9
|
Plant protection measures | On ET level of insects | Over dose/ un recommended brands of insecticides and fungicides |
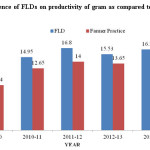 |
Figure 1: Influence of FLDs on productivity of gram as compared to farmers practices. Click here to View figure |
Results and Discussions
The differences in adoption of gram production technologies under demonstrations and local farmers’ practices were measured. The major differences were observed regarding recommended varieties, seed rate, seed treatment, time of sowing, sowing depth, fertilizer dose, method of fertilizer application and plant protection measures. Table 1 shows that under the demonstrated plot, only recommended varieties and insecticide for plant protection measures were given to farmer by the KVK and all the other package and practices were timely performed by the farmer itself under the supervision of KVK scientist. Under farmers’ practices, they generally sow local/self seed at low seed rate without any seed treatment. It is also observed that under farmer situation normally sowing of gram is late. Regarding the method of fertilization, under demonstration, all fertilizers were drilled at the time of sowing whereas under farmers’ practice broadcast method of fertilization was adopted. Similar findings have also been observed in different studies.1
Table 2: Influence of FLDs on seed yield and economic parameters of gram (var. PBG 5).
|
Year |
No. of Demonstrations |
Area |
Yield (q/ha) |
% change in yield |
*Economics of demonstration (Rs./ha) |
*Economics of check |
|||||||
|
(ha) |
(Rs./ha) |
||||||||||||
|
Demons |
Check |
Gross |
Gross |
Net return |
** |
Gross |
Gross |
Net return |
** |
||||
|
ration |
cost |
return |
B: C |
cost |
return |
B: C |
|||||||
| 2009-10 |
4 |
2 |
10.53 |
9.24 |
14 |
17210 |
21850 |
4640 |
1.27 |
16150 |
17860 |
1710 |
1.11 |
| 2010-11 |
7 |
2 |
14.95 |
12.65 |
18.2 |
23900 |
31395 |
7495 |
1.31 |
22310 |
26565 |
4255 |
1.19 |
| 2011-12 |
10 |
2 |
16.8 |
14 |
20 |
24230 |
47040 |
22810 |
1.94 |
22740 |
39200 |
16460 |
1.72 |
| 2012-13 |
10 |
2 |
15.53 |
13.65 |
13.7 |
24870 |
46590 |
21720 |
1.87 |
23300 |
40950 |
17650 |
1.76 |
| 2013-14 |
40 |
8 |
16.5 |
13.5 |
15 |
25300 |
51150 |
25850 |
2.02 |
23700 |
41850 |
18150 |
1.77 |
|
Average |
71 |
16 |
14.86 |
12.61 |
16.18 |
23102 |
39605 |
16503 |
1.68 |
21640 |
33285 |
11645 |
1.51 |
 |
Figure 2: Click here to View figure |
Effect of FLD programme on production performance of gram
Data of yield and economic parameters are presented in table 2. The results revealed that the yield of gram was considerably more under demonstration plots as compared to local check in the years of 2009-10 to 2013-14. The yield of gram under demonstration plots were received as 10.53, 14.95, 16.8, 15.53 and 16.5 qha-1 in 2009-10, 2010-11, 2011-12, 2012-13 and 2013-14, respectively (Fig. 1). The improvement in yield due to technological intervention was 14.0, 18.2, 20.0, 13.7 and 15.0 % as compared to control. The pronounced influence of adoption of improved technologies over five years, gave the yield of 14.86 qha-1 , which was 16.18 % more as compared to local check. It might be due to the various factors like social and economic conditions and prevailing microclimatic conditions, which affect the yield of this crop. It has also been confirmed by other studies that identification, farming conditions and site interventions have great importance to enhance the productivity. Increased productivity under front line demonstrations has also supported by various studies3,7,8,9
The data related economic parameters i.e. total cost, gross returns, net returns and B: C ratio of front line demonstrations are given in table 2. The results revealed that the net returns from the demonstrated plots were received more than control plot in all the years of investigation. The net return from the demonstration plot was recorded Rs 16503 as compared to control plot i.e. Rs 11645. The additional income of Rs 4858 was due to the technological interventions in demonstration plots.
Economic analysis of the yield performance revealed that B: C from demonstration plots were considerably higher than control plots. The benefit cost ratio of demonstrated and control plots were 1.27 and 1.11, 1.31 and 1.19, 1.94 and 1.72, 1.87 and 1.76 and 2.02 and 1.77 during 2009-10, 2010-11, 2011-12, 2012-13 and 2013-14, respectively. The higher benefit cost ratios were the evidences the intervention of technologies is economically feasible and convincing the farmers for the adoption it. Similar findings were reported moth bean (8) and sorghum (2). The data clearly showed the maximum increase in yield during 2011-12, while maximum benefit cost ratio was observed during 2013-14. The variation in benefit cost ratio during different years may mainly be on account of yield performance and input output cost in that particular year.
Conclusion
The findings of front line demonstrations showed that the yield of gram can be enhanced by 13.7 to 20.0 % with the use of improved technologies in Amritsar district. Higher benefit cost ratio has confirmed the economic viability of the demonstration and the adoption of improved technologies by the farmers. These demonstrations create a confidence and friendly relationship between farmers and scientists. The participated farmers in FLDs act as source of information and improved seeds for larger spreading of the improved varieties of gram (Chickpea) for other adjoining areas of farmers. The improved technologies are very important for increasing the yield of gram crop and other crops. It will also help in disseminating other technical information by KVKs for the benefit of the farmers.
Acknowledgements
Authors are very grateful to the Directorate of Extension Education, PAU, Ludhiana and Agricultural Technology Application Research Institute (ATARI), Zone-1, PAU campus, Ludhiana for providing financial assistance for conducting Front Line Demonstrations on chickpea (gram).
References
- Asiwal, B.L., and Hussain, A. Demonstration- An Effective Technology For Increasing The Productivity Of Gram. Rajasthan Journal of Extension Education. 2008;6:22-25.
- Gurumukhi, D. R., and Mishra,S. Sorghum front line demonstration – A success story. Agriculture Extension Review. 2003;154):22-23.
- Haque, M. S. Impact of compact block demonstration on increase in productivity of rice. Madras Journal of Extension Education. 2000;191):22-27.
- Mukherjee., N. Participatory Learning and Action. Concept Publishing Company, New Delhi, India. 2003;63-65.
- Roy, B., Singh, R., Singh,S.K. and Singh, A.K. Adoption of Improved Pulses Production Technologies and related Constraints in Uttar Pradesh. Indian Journal of Pulses Research. 2006;19(1):104-106.
- Sharma., O.P.Moth bean yield improvement through Front Line Demonstrations. Agrilcultural. Extension Review. 2003;15(5):11-13.
- Tiwari, K. B. and Saxena, A. Economic analysis of FLD of oilseeds in Chindwara. Bhartiya Krishi Anusandhan Patrika. 2001;16(3&4):185-189.
- Tiwari, K. B., Singh,V. and Parihar, P. Role of front line demonstration in transfer of gram production technology. Maharashtra Journal of Extension Education. 2003;22(1):19.
- Tomar, L. S., Sharma, P. B. and Joshi, K. Study on yield gap and adaptation level of Potato production technology in grid region. Maharashtra Journal of Extension Education. 2003;22(1):15-18.