Introduction
Taro [Colocasia esculenta (L.) Schott] is one of the oldest cultivated crops grown for its edible corms and leaves (Plucket, 1976; Kuruvilla & Singh, 1981; Coates et al., 1988). It is an important tropical tuber crop, used as a staple food or subsistence food by millions of people in the developing countries in Asia, Africa and Central America. World-wide it is the fifth most consumed root vegetable (FAOSTAT, 2005) with over 25% produced in Oceania and South-East Asia. The corms, leaves and petioles are used as a vegetable and considered as a rich source of carbohydrates, proteins, minerals and vitamins. They are a good source of thiamin, riboflavin, iron, phosphorus, zinc and a very good source of vitamin B6, vitamin C, niacin, potassium, copper, and manganese. Taro corms are very high in starch, and are a good source of dietary fiber. Oxalic acid may be present in the corm and especially in the leaf and these foods should be eaten with milk or other foods rich in calcium. Taro corms and leaves are also credited with having medicinal values. In India, two taro types, i.e., Colocasia esculenta var esculenta (Dasheen type) and C. esculenta var antiquorum (Eddoe type), are commonly cultivated throughout the country. Like most other root and tuber crops, taro is vegetatively propagated, although seeds are also naturally formed. Taro is a member of the Araceae family, which is made up of at least 100 genera and more than 1500 species. Colocasia is the most important edible genus while Colocasia esculenta being the most important species (Maga, 1992). Germplasm characterization and evolutionary process in viable populations are important links between the conservation and utilization of plant genetic resources. Taro cultivars in the Asia Pacific regions exhibit remarkable morphological variation. This variation may be associated with cross-pollination and sexual recombination, and perhaps mutation, followed by intensive selection by isolated human communities in diverse environments (Rao et al., 1998). It is also likely that continuous vegetative propagation and selection has contributed to the phenotypic diversity observed. The origin of existing landraces or farmer varieties can only be elucidated by assessing genetic diversity to establish varietal identity and the extent and distribution of genetic variation. The study of agro-morphological variability is the traditional method of assessing genetic diversity. Agro-morphological characterization, however, is often hindered by the limited number of polymorphic features and the need for multiple test environments (Kresovich et al., 1997). The present investigation was done to analyze and identify some promising local collections and genotypes of taro, aiming at the characterization of the extent and distribution of genetic diversity using D2 statistics based on agro-morphological parameters.
Materials Methods
The experiment was conducted at the Central Horticultural Research Station, Mondouri, Bidhan Chandra Krishi Viswavidyalaya, Nadia, West Bengal. The site is situated at 9.75 MSL, at approximately 22057` N latitude and 88020`E longitude. Topographical situation of the experimental site is under gangetic new alluvial plains of West Bengal. The soil is sandy loam and slightly acidic.
The total of twenty Colocasia esculenta (L.) Schott accessions were considered in this study. The accessions were collected from different parts of West Bengal and other states (Assam, Orissa, Kerala) India. An overview of the genotypes that have been studied is given below in Table-1. Representative samples were collected based on traditional knowledge of inhabitants and phenotypic variations observed.
The experiment was laid out in randomise complete block design using 10m x 5m plots with three replications. Corms of the same size were used as a planting material and planted on a ridge during onset of rainy season. One month after planting, after the crop was well established, the plants were earthed up. Cultivation and weeding were carried out when necessary.
Descriptor of taro (Colocasia esculenta) developed by IPGRI (IPGRI, 1999) were followed for data collection. There were two sets of data’s (qualitative and quantitative) collected for assessing the diversity and to find key morphological traits in taro cultivars. In regarding to the qualitative traits, only the first replication of the experiment was considered, whereas, for quantitative characters the entire replications were considered. Both foliar and subterranean data’s were considered. For foliar traits, scored at five months after planting, while, subterranean traits were evaluated at harvest (8 months). Most of the data (qualitative and quantitative traits) were recorded on individual plant basis using sample averages of six plants selected at random from the row. The data were analysed for coefficient of variation (Burton and De Vane, 1953), heritability (Hanson et al., 1956), genetic advance (Johanson et al., 1955), D2 statistics by P. C. Mahalanobis (1936) and clusters analysis through Tocher method (Rao, 1952).
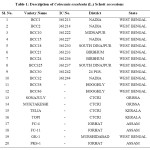 |
Table 1: Description of Colocasia esculenta (L.) Schott accessions. Click here to View table |
Results and Discussion
Leaf Colour and Shape
Diversity in leaf colour and shape is considered to be most important as it is the primary criteria frequently used to characterize each of the diverse germplasm and to distinguish them visually which are given bellow in Table 2. A wide degree of variation in leaf colour existed among the genotypes. BCC-1, BCC-2, BCC-10, BCC-15, BCC-21, BCC-25, Sonajuly, Muktakeshi and PKS-1 had deep green leaf colour while the leaves of BCC-32 and BCC-38 were bass green. GK-1 had yellow green and BCC-18, FC-4, FC-11 had light green leaves. Variation in leaf shape was also observed. BCC-1, BCC-2, BCC-18, BCC-21, BCC-30, Topi and PKS-1 had lanceolate leaf shape while the leaves of BCC-10, BCC-15, BCC-24, BCC-32 and Muktakeshi were cup shaped. BCC-25, Sonajuly, FC-4, FC-11 and GK-1had cordate and Telia had oval shaped leaves. It is quite evident that based on leaf colour and shape though some of these genotypes could be identified, but the genotypes belonging to same colour group might not always be easily identifiable as there was no clear colour variation amongst them.
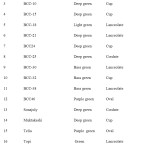 |
Table 2: Variation in leaf colour and shape observed in 20 taro germplasm. Click here to View table |
Variation in Physical Parameters
Mean value of the genotypes for different character and estimates of different genetic variability parameters are presented in Table 3. Length of main sucker was highest in Muktakeshi (91.7 cm.) and lowest in BCC-26 (46.3cm) with mean value 72.4cm. The character had moderately high GCV and PCV indicating higher variability among the genotype. The character had high heritability (97.36%) with moderately high GA % over mean indicating additive nature and possibility of improvement through selection. Girth of main sucker ranged from 10.57cm to 16.31cm. with mean value 13.43 cm. BCC-46 had the highest girth. The character had moderate GCV and PCV with high heritability (89.72%) and moderate GA % over mean indicating less influence of the environment and possibility of improvement of the character through selection. Numbers of side sucker per plant were highest in Muktakeshi and lowest in PKS-1 with mean value of 3.31. The character had moderately low heritability (68.4%) with moderate GA% (38.20) over mean indicating less possibility of improvement of the character. Number of petioles/clump, number of side tuber/plants, weight of side tubers/plants and corm yield had high GCV and PCV (>30%) with high heritability (>80%) and high GA % over mean indicating greater variability of the characters and greater possibility of improvement through selection. Length of leaf and breath of leaf lamina had moderately low GCV and PCV indicating less variability for the character but had high heritability with moderate GA% over mean indicating less possibility of improvement. This results also supported by Yared Dagne, (2007).
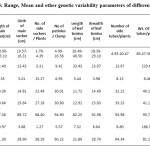 |
Table 3: Range, Mean and other genetic variability parameters of different characters. Click here to View table |
Variation in Genetic Characters
Genetic diversity plays an important role in crop improvement program. However, as taro is mainly propagated through clones and hybridization is rarely possible in this climate the objective of present study was to identify closely or distantly related groups of genotypes. In the presence study D2 statistics was used for assessing the underline genetic diversity within the population of 20 genotypes of taro collected from different district of West Bengal and other parts of India. Distribution of 20 genotypes of taro (based on D2 value) is presented in Table 4. From the clustering pattern of the genotypes it was revealed that the 20 genotypes were grouped under six clusters. Cluster no. II had maximum no. of genotypes 9. Among this 8 genotypes viz. BCC-1, BCC-2, BCC-10, BCC15, BCC-18, BCC21, BCC24 and BCC25 were collected from different districts of West Bengal (Table 1). The genotypes seem to be similar. Another genotype i.e., Topi was a collection from CTCRI, Kerala and was grouped in Cluster II. The Cluster I included 4 genotypes out of which BCC-38, BCC-46 were collected from Hoogly and GK-1 were collected from Murshidabad district. Another variety Telia, collected from Kerala was also grouped in Cluster I indicating its similarity with these Bengal genotypes. Cluster III included 3 genotypes viz., FC-4, FC-11 and PKS-1. All these genotypes were collected from Assam. Cluster IV and Cluster VI included one genotype each. BCC-32 was categorised under Cluster IV which was a collection from Nadia, West Bengal. Sonajuly, a local genotype of Orissa was categorised under Cluster VI. The Cluster V had 2 genotypes viz., BCC-30 and Muktakeshi. BCC-30 was collected from 24 Pgs., West Bengal and Muktakeshi was a collection from Kerala.
Average Intra and Inter Cluster Distance
Average intra and inter cluster distance value of 20 taro genotypes (Table 5) revealed that Cluster V had highest intra cluster distance (16.23) indicating the dissimilarity between the two genotypes viz., BCC-30 and Muktakeshi. The lowest intra cluster D2 value was noticed in Cluster III (8.70) indicating closeness of the 3 genotypes (FC-4, FC-11 and PKS-1) in this group. All this 3 genotypes were collected from Jorhat, Assam. Intra cluster D2 value of Cluster II was 13.39 and that of Cluster I was 12.77. These 2 clusters included 9 and 4 genotypes respectively. In the former cluster out of 9 genotypes, 8 where collected from different districts of West Bengal which indicated their closeness though variation in leaf shape and colour was observed in few cases. In the Cluster I also BCC-38, BCC-46 and GK-1 were collected from nearby districts of Bengal but morphologically all of them were not similar. The inter cluster D2 value ranged from 16.73 between Cluster II and V to 50.89 between Cluster III and IV. All the genotypes of Cluster III were collected from Assam where as the one genotypes of Cluster IV (BCC-32) collected from southern part of Bengal which showed their real dissimilarity. Inter cluster distances between Cluster III and V (37.67), Cluster I and IV (35.01), Cluster II and III (32.24) and Cluster IV and VI (32.69) were also comparatively larger in magnitude. The distance between Cluster I and VI, Cluster II and VI were comparatively small in magnitude which indicated there similarity. This is similar results was observed in study of Mandal et al., (2013) morphological and RAPD markers showed the high degree of polymorphism which is effective for assessment of diversity among the local genotypes of West Bengal.
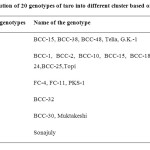 |
Table 4: Distribution of 20 genotypes of taro into different cluster based on D2 Values. Click here to View table |
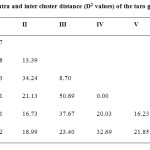 |
Table 5: Average intra and inter cluster distance (D2 values) of the taro genotype. Click here to View table |
A comparison between the clusters of different characters is presented in Table 6. A perusal of the cluster mean value for different character revealed that Custer IV represented highest length of main sucker (84.72cm.), maximum number of side tuber (20.47cm.), maximum weight of side tuber (378.97gm.) and highest corm yield (24.20t/ha). This cluster is also the presented smallest breath of leaf lamina (21.73cm.). Cluster V represented maximum girth main sucker (16.92cm), maximum number of side sucker (4.48) and maximum number of petioles per clump (14.6). Cluster III represented maximum length of leaf lamina (36.70cm.) whereas Cluster VI represented breath of leaf lamina (29.10cm.). Cluster III represented least corm yield (3.37t/ha.), least wt. of side tuber (112.49 gm.) and least number of side tuber (6.02).Cluster IV had the highest length of main sucker (84.72cm).
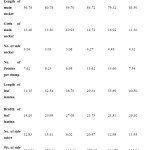 |
Table 6: Mean values of different character of each clusters. |
Summary and Conclusion
Upland taro [Colocassia esculenta var. antiqurium (L). Schott] is an important dietary food of millions in the developing countries and mostly used as vegetable and has been rated fifth major root vegetable. In the present study attempt was made to group 20 taro genotypes collected from different parts of West Bengal and India on the basis of D2 statistics based on several agro-morphological parameters. Out of these 20 genotypes, thirteen were collected from different parts of West Bengal, while, rest of the genotypes were collected from the other parts of the country through AICRP on Tuber Crops. On the basis of D2 statistics the 20 genotypes were grouped into six different clusters (I-VI). Most of the local taro genotypes collected from nearby districts (BCC-1, BCC-2, BCC10, BCC15, BCC18, BCC-21, BCC24 and BCC-25) were placed in Cluster II with moderate intra cluster distance indicating their closeness. The collected lines with morphological similarity may be a duplication one. The genotypes collected from Assam (FC-4, FC-11 and PKS-1) were grouped into Cluster III with least intra cluster distance indicating their closeness and similarity.
References
- Burton, G.W. and de Vane, D.H. 1953. Estimating heritability in tall fescue (Festuca arundinacea) from replicated clonal material. Agron. J. 4 : 78-81.
- Coates DJ, Yen DE and Gaffey PM Chromosome variation in taro. Co/ocasia esculenta: implications for its origin in the Pacific. Cytologia 53: 551-560 (1988).
CrossRef - Coates DJ, Yen DE and Gaffey PM Chromosome variation in taro. Co/ocasia esculenta: implications for its origin in the Pacific. Cytologia 53: 551-560 (1988).
CrossRef - FAO. (Publication.: http://www.fao.org) (2005).
- Hanson, G.H., Robinson, H. F. and Comstock, R. E. Biometrical studies of yield in segregating population of Korean lespedeza. Agron. J. 48: 476-490 (1956).
CrossRef - IPGRI/IITA. Descriptors for taro (Collocasia spp.) International Institute for Tropical Agriculture, Ibadan, Nigeria/ International Plant Genetic Resources Institute, Rome,Italy. (1999).
- Johnson, H.W., Robinson, H.F. and Comstock, R.E. Estimates of genetic and environment variability in soybean. Agron. J. 47: 314-418 (1955).
CrossRef - Kuruvilla, K.M. and Singh, A. Karyotypic and electrophoretic studies on taro and its origin. Euphytica, 30 : 405 – 413 (1981).
CrossRef - Maga, J.A.,. Taro- composition and food uses. Food Rev Int 8; 443-473 (1992).
CrossRef - Mahalanobis, P.C. On the Generalized Distance in Statistics.Proc. Natl. Scence. India B. 2: 49- 55, (1936).
- Mandal, R., Bhattacharya, M. and Tarafdar, J. Assessment of genetic diversity in taro [Colocassia esculenta var. antiqurium (L). Schott] genotypes using morphological parameters and RAPD profiling. ICTRT 2013 Abstracts: 47 (2013).
- Plucknett DL Edible aroids: Alocasia, ‘Colocasia, Cyrtosperma, Xantbosoma. In: Simmonds NW (ed.) Euolution of Crop Plants. London: Longman, pp. 10-12 (1976).
- Rao, C.R. Advanced Statistical Methods in Biometric Reaserch. John Willey and sons, New York (1952).
- Yared Dagne. Studies on indigenous production and evaluation of landrace taro clones (Colocasia esculenta L. (Schott) at Dalbo watershed, Wolaita, South Ethiopia. M.Sc. thesis, Presented to School of Graduate Studies, Hawassa University, Awassa. (2007)