
Introduction
Sweet potato (Ipomoea batatas (L) Lam) is an incredibly versatile vegetable species, known for its tuberous root. It thrives in tropical areas, making it a popular choice for both domestic and industrial purposes. But sweet potato is much more than just a root; it is a nutritional powerhouse, packed with essential vitamins and minerals such as vitamin A, B6, C, riboflavin, copper, pantothenic acid, and folic acid.1 In this article, we will explore the various uses and significance of sweet potato, particularly in Ethiopia’s agricultural landscape.
Sweet potato not only serves as a staple food but also finds its place in various industries and medicinal applications. According to different authors this crop holds immense potential in medicinal practices, including the treatment of diabetes, hookworms, ulcers, and internal bleeding. Its therapeutic properties make it a valuable resource for healthcare needs.2
In Ethiopia, where more than 85% of the population resides in rural areas, agriculture plays a crucial role in livelihoods.3 However, despite its significance, agricultural productivity remains low. This can be attributed to several factors, including the limited use of improved agricultural technologies, vulnerability to weather conditions, pests and diseases, and the dwindling land resources due to population pressure.4,5 These challenges hinder the ability of farmers to meet the consumption requirements of their households. While sweet potato may not claim the top spot globally, it certainly holds its own as the second most important root and tuber crop worldwide, after the potato.14, 15
In the Sub-Saharan African region, sweet potato ranks third among root crops, following cassava and yam.6 Ethiopia, standing as the fourth largest producer of sweet potato in Africa and the seventh globally.7 The crop plays a significant role in cultivation and production for food security.
One of the remarkable aspects of sweet potato is its resilience in the face of adversity. It can withstand drought, thrive in low soil fertility conditions, and endure high levels of rainfall. These characteristics make it an ideal food security crop, reinforcing its importance, especially for small-scale, resource-poor farmers. Not only is sweet potato a vital source of sustenance for human consumption, but it also serves as an essential feed for animals, particularly during stressful periods. In many agricultural communities, women shoulder the major responsibility for growing sweet potatoes. Their invaluable contribution ensures the success of sweet potato cultivation. In Ethiopia, the tuberous root is the most profitable part of the plant, while the leaves find utility as livestock feed during periods of scarcity, generating significant returns for farmers.8
The crop with its diverse benefits and adaptability, continues to play a pivotal role in agriculture and food security. It offers an alternative source of nutrition and livelihood for countless individuals, and its versatility makes it a valuable asset in various industries and medicinal practices. The journey of sweet potato cultivation in Ethiopia is a testament to its resilience and the indispensable role it plays in the lives of farmers and consumers alike. Let’s continue to appreciate and harness the potential of this extraordinary vegetable root crop.9
In today’s agro-ecological and socio-economic context, there is an urgent need for agricultural technologies that can produce nutritious and marketable food. One of the crops that offers a strategic opportunity to improve nutrition and rural incomes in areas affected by micronutrient deficiencies is sweet potato. Its hardiness to grow in difficult conditions makes it an important part of agricultural systems around the world. However, the low nutrient status of the soil, particularly in nitrogen and phosphorus, hampers the yields of crops like sweet potato.10 To meet the ever-increasing food demands of the growing population, inorganic fertilizers have been used for decades to increase crop yield per unit area of land. Unfortunately, despite the known health benefits and importance of sweet potatoes, their availability and consumption remain inadequate in tropical and subtropical Africa. This can be attributed to factors such as low production, seasonality, and vulnerability to environmental stress.11
Traditionally, farmers in these regions rely on single or single fertilizers. However, studies12 have shown that factors such as stem density, plant number, and nutrient supply have a significant impact on sweet potato growth and yield. As a result, the potential contribution of this crop to food security in Ethiopia is greatly underestimated due to a significant gap between potential yield and the yield of peasant farmers. Inappropriate tillage practices, lack of knowledge regarding fertilizer types and rates needed by the crop, and other factors contribute to farmers’ low yields.
Appropriate tillage systems and proper nutrition play a crucial role in improving aeration, water transmission, root growth, and nutrient uptake. Phosphorus, in particular, is a vital nutrient for many plant species, including sweet potatoes. However, in many crop production systems, most of the applied phosphorus is converted into an unavailable form through reactions with soil constituents, rendering it less accessible to plants.13
The productivity of sweet potatoes is often low under farmer conditions due to various factors. According to,14 the unavailability of improved varieties and poor agronomic practices contribute to low yields in farmers’ fields. In Ethiopia, the average yield of sweet potatoes is 8 tons per hectare, indicating the need to focus on soil nutrient management to improve soil fertility and optimize crop production. To achieve this, integrated nutrient management is crucial, as it offers an efficient and environmentally friendly approach to increase crop productivity without sacrificing future soil productivity.15 It is essential to establish appropriate fertilizer rates for sweet potatoes specific to each location. Overcoming these challenges by implementing effective agricultural techniques and appropriate fertilizer management to ensure the production of nutritious and marketable sweet potatoes for the benefit of local communities and the agricultural sector as a whole. Therefore the objective of the study was to determine the combined application rate of inorganic mixed NPSB and N fertilizer that maximizes the yield and yield components of sweet potato varieties while being economically feasible.
Material and Methods
Visual observations
The picture below is taken the same day as the plants were at vegetative stage and harvesting from all 16 treatments.
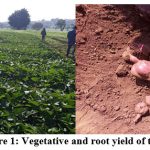 |
Picture 1: Vegetative and root yield of the crop |
Description of the Study Sites
The Experiment was conducted at Bore Agricultural Research Center during 2020 and 2021 summer cropping season for two years at Adola areas.The area was located in Guji zone; southern Ethiopia estimated 470 km far from Addis Ababa. Geographically the district is located between 050 53’ 680’’ and 0380 59’ 007’’ northing and easting latitude respectively.
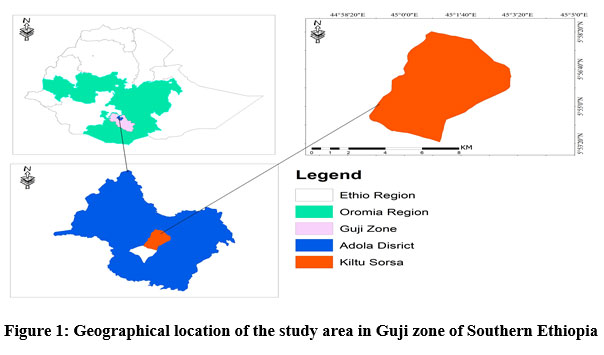 |
Figure 1: Geographical location of the study area in Guji zone of Southern Ethiopia |
Description of Experimental Materials
Sweet Potato variety Naspot-13, which was released by Hawasa Agricultural Research Center and evaluated for yield at our center, was used for the experiment.16 This variety was recommended for lowland and midland areas between 1650 and 2000 meters above sea level.
Description of Experimental Design and Treatments
Table 1. Description of the experimental treatments
|
Treatment |
Descriptions |
Test crop and variety |
|
NP1N1 |
0 kg NPSB + 0 kg N ha-1 blended fertilizers |
Sweet potato Naspot-13 |
|
NP1N2 |
0 kg NPSB + 23 kg N ha-1 blended fertilizers |
|
|
NP1N3 |
0 kg NPSB + 46 kg N ha-1 blended fertilizers |
|
|
NP1N4 |
0 kg NPSB + 69 kg N ha-1 blended fertilizers |
|
|
NP2N1 |
50 kg NPSB + 0 kg N ha-1 blended fertilizers |
|
|
NP2N2 |
50 kg NPSB + 23 kg N ha-1 blended fertilizers |
|
|
NP2N3 |
50 kg NPSB + 46 kg N ha-1 blended fertilizers |
|
|
NP2N4 |
50 kg NPSB + 69 kg N ha-1 blended fertilizers |
|
|
NP3N1 |
100 kg NPSB + 0 kg N ha-1 blended fertilizers |
|
|
NP3N2 |
100 kg NPSB + 23 kg N ha-1 blended fertilizers |
|
|
NP3N3 |
100 kg NPSB + 46 kg N ha-1 blended fertilizers |
|
|
NP3N4 |
100 kg NPSB + 69 kg N ha-1 blended fertilizers |
|
|
NP4N1 |
150 kg NPSB + 0 kg N ha-1 blended fertilizers |
|
|
NP4N2 |
150 kg NPSB + 23 kg N ha-1 blended fertilizers |
|
|
NP4N3 |
150 kg NPSB + 46 kg N ha-1 blended fertilizers |
|
|
NP4N4 |
150 kg NPSB + 69 kg N ha-1 blended fertilizers |
Considering utilization efficiency, full amount of NPSB which is a blended fertilizer formulations containing both four elements together and NPSB fertilizer type was identified for the study area by the EthioSis and half amount of N fertilizer were applied at the time of planting. The other half of N is applied 45 days after planting. Urea (46% N) and NPSB (18% N + 36% P2O5 + 7% S + 0.71% B) were used as fertilizer sources of N, P, S, and B. All possible combinations of treatments were created and assigned to the diagram. The design consisted of a 4×4 factorial experiment organized in a randomized complete block and repeated three times. This variety was tested with a distance between rows or plants of 100 cm x 30 cm. The area occupied by one plot is 4 x 2.1 m, and the distance between the block and the plot is 1.5 x 1 m. Twenty-eight cuttings were used in each plot. Plots were observed periodically to record data related to the experiment.
Data Collection and Analysis
At planting, plant height at maturity, number of branches on the main stem, and number of individuals at harvest were recorded. At harvest, record the number of roots per plant, average root weight per plant, marketable root yield per plot, non-market root yield per plot, and total yield per plot, and converted it to around.
Soil Sampling and Analysis
Soil samples were collected in the field before and after the intervention to analyze and determine the physical and chemical properties of the soil. First, before preparing the field, soil samples were taken from different locations in the experimental field at a depth of 30 cm using an auger. Composite soil samples were then prepared, air-dried in the laboratory, ground, and sieved through a 2 mm sieve to analyze the soil’s physicochemical properties. After harvest, soil samples were collected at a depth of 0-30 cm for each replicate and combined treatment. The composite soils were then analyzed to determine soil structural class, pH, CEC, organic carbon, exchangeable cations, organic matter, total nitrogen, available phosphorus, available potassium, and sulfur. The values of individual physicochemical properties of the tested soils are presented in the results and discussion section.
Simple Correlation Coefficient (r) Analysis
Explain the obvious relationships between nutritional parameters and yield components. This value explains that changes in one variable are accompanied by changes in other variables.
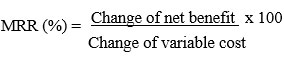
Partial Budget Analysis
A partial economic analysis was conducted using the methodology described in.17 Only costs that vary by treatment are taken into account. Crop yields were adjusted downward by 10% to reflect the difference between tested yields and what farmers expected from the same treatment. Treatments yield the highest net yield and MRR (>1 or 100%) above the minimum level acceptable to farmers. To compare different net costs and benefits, the marginal benefit is calculated as follows:
Statistical Data Analysis
The data collected on various parameters of the studied crops were statistically analyzed using SAS statistical package and Genestat 18th edition. The Fisher comparison method was used to classify the means with the least significant difference at the 5% significance level.18
Results and Discussion
Soil Physicochemical Properties
Soil Physicochemical Properties of Site before Planting for first year
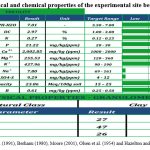 |
Table 2: Soil physical and chemical properties of the experimental site before planting. |
The content of plant-available nutrients in the soil is a formal requirement for plant growth and yield. The physical and chemical properties of the soil in the experimental fields are presented in the table. The soil class of the experimental site is sandy soil. Following a review by,19, 20, 21, 22 the soil in the experimental field had a neutral pH (7.01), neither acidic nor alkaline, with normal organic carbon content (2.97%), high total nitrogen content (0.27%), and moderate available phosphorus. content (21.22 ppm) and high calcium content (2002.85 ppm), high exchangeable potassium content (437.96 ppm), low sodium content (7.80 ppm), low organic sulfur content (9.29 ppm), high boron content (0.61 mg/kg) and the exchange capacity of arable soil in the moderate cation Adola areas (23.86 Meq /100g) (Table 1). Based on soil analysis results, it is not necessary to fertilize potassium to treat soil in the experimental area.
First year Soil Physico-chemical Properties of Experimental Site after Crop Harvest
Soil testing is usually the only way to adjust crop nutrient management programs. Table 2 summarizes some post-harvest soil physicochemical properties affected by experimental treatments. Postharvest soil analysis showed an increase in organic carbon independent of the different nutrient treatments. Although the total nitrogen content of the plants was high before planting in the soil, analysis showed that there was an excess nitrogen content during the post-harvest application rate. High concentrations of total nitrogen were present in the top 0-30 cm of soil. Furthermore, the total N content was lower in the minimal application treatment. In general, post-harvest soil analysis showed an increasing trend in available phosphorus in the application rate treatments, while there was no change in the standard control treatments. This may be because phosphorus is relatively immobile in the soil and remains concentrated in the topsoil near the fertilizer application site. The effects of nutrient additives can significantly increase the availability of nutrients in the soil. As other studies have shown, the effects of organic matter on soil properties can help improve soil quality several years after cessation of use.23 Increasing N, P, K, pH and C content in soil increased crop yield after one year of application.24
Table 3: First year data of Soil physical and chemical properties of the experimental site after crop harvest
|
Trt |
PH-H2O |
Avail. P |
SO4-S |
CEC |
OC |
OM |
TN |
C:N |
Fe |
Mn |
Zn |
Cu |
B |
|
0-14 |
mg |
mg |
Meq |
% |
% |
% |
mg |
mg |
mg |
mg |
mg |
||
|
0*23 |
7.14 |
1.46 |
13.52 |
23.48 |
3.66 |
6.30 |
0.22 |
16.62 |
32.17 |
27.51 |
3.22 |
5.29 |
< 0.001 |
|
100*0 |
7.42 |
2.91 |
9.88 |
25.75 |
3.66 |
6.30 |
0.23 |
15.76 |
16.86 |
20.03 |
2.98 |
4.90 |
< 0.001 |
|
150*69 |
7.18 |
3.09 |
6.69 |
25.75 |
3.48 |
6.00 |
0.23 |
15.28 |
25.55 |
25.35 |
2.98 |
5.24 |
< 0.001 |
|
150*23 |
7.33 |
2.50 |
7.80 |
24.00 |
3.61 |
6.22 |
0.23 |
15.70 |
22.09 |
20.50 |
2.93 |
5.23 |
< 0.001 |
|
50*0 |
8.72 |
2.50 |
6.24 |
26.77 |
3.58 |
6.17 |
0.23 |
15.48 |
7.76 |
9.58 |
2.98 |
4.88 |
< 0.001 |
|
0*0 |
7.37 |
1.65 |
7.21 |
27.89 |
3.85 |
6.63 |
0.22 |
17.48 |
22.42 |
25.06 |
3.10 |
5.00 |
< 0.001 |
|
0*69 |
7.24 |
1.87 |
6.24 |
24.38 |
3.89 |
6.71 |
0.24 |
16.22 |
23.56 |
22.83 |
3.20 |
5.15 |
0.27 |
|
50*46 |
7.20 |
1.87 |
11.96 |
24.05 |
3.85 |
6.63 |
0.24 |
15.82 |
24.98 |
21.06 |
3.00 |
5.37 |
0.55 |
|
100*23 |
8.39 |
3.74 |
6.76 |
26.92 |
3.24 |
5.58 |
0.22 |
14.64 |
11.72 |
11.30 |
2.98 |
5.26 |
0.69 |
|
100*69 |
7.19 |
3.95 |
14.04 |
22.61 |
3.42 |
5.90 |
0.22 |
15.56 |
22.89 |
18.64 |
2.72 |
5.67 |
0.45 |
|
100*46 |
7.52 |
3.54 |
7.80 |
26.00 |
3.66 |
6.30 |
0.24 |
15.56 |
18.17 |
18.67 |
3.15 |
5.31 |
0.66 |
|
150*46 |
8.13 |
4.37 |
11.44 |
25.02 |
3.33 |
5.74 |
0.24 |
14.17 |
12.94 |
12.82 |
2.75 |
4.70 |
0.71 |
|
50*69 |
7.66 |
1.87 |
13.00 |
27.60 |
3.38 |
5.82 |
0.24 |
14.13 |
15.63 |
13.27 |
2.66 |
5.16 |
0.68 |
|
150*0 |
7.36 |
2.06 |
6.69 |
26.29 |
3.25 |
5.60 |
0.26 |
12.46 |
20.80 |
21.18 |
3.41 |
5.34 |
0.58 |
|
50*23 |
7.32 |
2.50 |
3.64 |
26.58 |
3.61 |
6.22 |
0.25 |
14.43 |
21.80 |
21.31 |
3.11 |
5.59 |
0.56 |
|
0*46 |
8.50 |
2.08 |
7.28 |
28.18 |
3.61 |
6.22 |
0.25 |
14.20 |
10.10 |
12.37 |
2.67 |
4.74 |
0.74 |
|
Average |
7.60 |
2.62 |
8.76 |
25.70 |
3.57 |
6.15 |
0.24 |
15.22 |
19.34 |
18.84 |
2.99 |
5.18 |
0.59 |
Where, pH=soil acidity, P=phosphorus, SO4-S= sulfate, CEC=cation exchange capacity, OC=organic carbon, OM=organic matter, TN=total nitrogen, C: N=ratio of nitrogen to carbon, FE=Iron, Mn=manganese, Zn=zink, Cu=copper and B=boron.
Second Year Soil Physicochemical Properties of Site
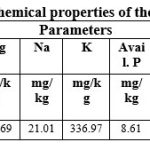 |
Table 4: First Year Soil physical and chemical properties of the experimental site before planting |
Here, we consider the process of analyzing results from an experimental soil laboratory. From understanding soil properties to identification and recommendations, we address the impact of these discoveries on plant growth and yield. To optimize agricultural practices, it is important to understand the importance of laboratory soil testing. By analyzing our soil’s composition, pH, and other nutrient levels, we can make informed decisions. Soil laboratory test results provide valuable insight into soil health and guide sustainable agricultural practices. Based on laboratory results, the soil conditions at the test site are mainly clayey and suitable for potato cultivation. Soil pH of the study site showed that it is in the normal range (6.07) for intended crops, indicating an acidic or alkaline balance. Nutrient levels are adequate for nitrogen (0.27%) and low for phosphorus (8.61 mg/kg), but potassium levels are slightly higher (33.97 mg/kg) and do not require targeted supplementation. Furthermore, soil results showed that the experimental site had high boron content (0.84 mg/kg) and high organic carbon content (3.60%) (Table 1). Soil test results have a significant impact on plant growth and productivity. The clay soil structure ensures good drainage and promotes healthy root development. Analyzing laboratory soil test results provides valuable insight into soil health and enables informed decision-making. The results of this analysis serve as the basis for implementing appropriate soil amendments to promote plant growth and optimize overall productivity. However, continuous monitoring, research and adaptation to changing environmental conditions are essential to ensure sustainable sweet potato production.
Growth Parameters of Irish Potato
Survival rate (%), days to 80% maturity, Plant height and Stem umber
Inadequate and excessive amounts of nutrients can be detrimental to sweet potato crop and can negatively affect crop yield potential.
The results of this study showed that all growth parameters in our treatments were significantly (p<0.05) affected by NPSB and nitrogen fertilizer (Table 2). As a result of the analysis, it was found that those who applied the optimal rate of fertilizer at the time of planting had a better germination rate, while those who applied less fertilizer had a lower survival rate. This shows that adequate nutrient supply during planting is important. In general, the highest survival rate (10.66) was found for the maximum (150 kg NPSB and 69 kg N ha-1) treatment and the lowest survival rate (7.00) for the zero fertilizer treatment.
Applying different NPSB and nitrogen fertilization rates has a significant impact (p<0.05) increased in of the phenolgical parameters assessed in both cropping years (Table 3). In our data analysis, significant results regarding maturity dates showed that the treatments applied 150 kg ha-1 of NPSB and 23 kg ha-1 N2. This means that the maximum ripening time (131) was recorded in the area treated with 150 kg ha-1 NPSB and 23 kg ha-1 nitrogen fertilizer. Conversely, the shortest number of days to maturity was recorded when treated with the least variety of nitrogen fertilizers. This may be due to the fact that in most cases the application of nitrogen-containing fertilizers extends the growing period and in our case most treatments with minimal nitrogen content minimize the maturation time.
Applying different amounts of NPSB and N2 fertilizer had a clear (p<0.05) effect increased in all the growth parameters experimented in both years of cropping time. The growth parameters of the studied sweet potato plants increased with different amounts of fertilizer. This indicates that as plants grow, their nutrient requirements and the uptake of nutrients by the crop increases. When applying different amounts of NPSB and nitrogen fertilizer at 100 kg ha-1 and 46 kg ha-1, the highest tree height (121.17 cm) and the lowest was 50 cm when not adding fertilizers during both growing seasons.
Application of different compound fertilizers had a significant impact on the number of sweet potato stems per plant. The maximum number of branches (8.41) was observed at fertilizer doses of 100 kg ha-1 and 46 kg ha-1, and the minimum figure (5.08) was observed in the treatments receiving fertilizer doses of 150 kg ha-1 and 46 kg ha-1.This may be because maximum nutrient levels above the optimal level may result in suboptimal vine number and plant height (Table 1). In terms of plant growth, different amounts of nutrients applied essentially increase, indicating that as the plant grows, the requirement for nutrients and the uptake of nutrients by the crop increases. In general, nutrient application has a significant impact on most growth parameters up to the desired level.25
Table 5: Pooled mean interaction effects of NPSB and N fertilizers on survival rate, days to maturity, plant height, and average vine number of Sweet potato at Adola during 2020 and 2021
|
Treatments |
SR (%) |
DM (days) |
APH (cm) |
STMN (no) |
|
NP1N2 |
10.00ab |
129.16abc |
101.44ab |
7.83abc |
|
NP3N1 |
10.667a |
128.33c |
92.00ab |
8.25ab |
|
NP4N4 |
10.667a |
129.00bc |
114.67ab |
6.41a-e |
|
NP4N2 |
8.33abc |
131.00a |
94.39ab |
6.50a-e |
|
NP2N1 |
7.66abc |
129.50abc |
90.33b |
6.16a-e |
|
NP1N1 |
7.00bc |
128.50c |
91.67ab |
4.58de |
|
NP1N4 |
6.33c |
129.00bc |
104.61ab |
6.08a-e |
|
NP2N3 |
8.66abc |
129.66abc |
105.06ab |
7.75abc |
|
NP3N2 |
7.66abc |
130.50ab |
109.28ab |
5.91a-e |
|
NP3N4 |
10.00ab |
128.50c |
110.11ab |
7.50a-d |
|
NP3N3 |
9.66ab |
129.00bc |
121.17a |
8.41a |
|
NP4N3 |
8.00abc |
129.00abc |
103.61ab |
5.08cde |
|
NP2N4 |
7.66abc |
129.00abc |
95.33ab |
5.41b-e |
|
NP4N1 |
10.333a |
128.33c |
100.06ab |
7.16a-e |
|
NP2N2 |
8.66abc |
128.50c |
95.33ab |
6.91a-e |
|
NP1N3 |
8.00abc |
130.00abc |
107.50ab |
4.33e |
|
Mean |
8.73 |
129.25 |
102.28 |
6.52 |
|
LSD (5%) |
3.31 |
1.84 |
30.04 |
2.95 |
|
CV (%) |
22.79 |
1.23 |
17.2 |
27.21 |
Means in columns and rows followed by the same letter(s) are not significantly different at 5% level of significance. Where SR=survival rate,DM=days to maturity, APH=plant height, STMN=average stem number, NP=NPS, N=Nitrogen, LSD (0.05) = Least Significant Difference at 5% level; and CV (%) = coefficient of variation in percent
Yield related Parameters of Sweet Potato
Root number and average Root weight
The main effects of NPSB and Nitrogen fertilizer rates as well as their interaction had highly significant (P<0.01) on average root number and root weight of the plant. The highest number of roots per plant (8.69) was recorded at 150 kg NPSB ha-1 and 46 kg N2 ha-1, while the lowest (6.52) was recorded in the untreated case. This is because several factors affect the efficiency of fertilizer application on plant growth. In our case, increasing the amount of fertilizer application may not increase the number of roots of plants in the hills.
Table 6: Pooled mean interaction effects of NPSB and N fertilizers on root number per hill and average root weight of Sweet potato at Adola during 2020 and 2021.
|
Treatments |
ARN (no) |
ARW (g) |
|
NP1N2 |
7.08ab |
350.78hi |
|
NP3N1 |
7.27ab |
385.33efg |
|
NP4N4 |
6.88ab |
398.47c-e |
|
NP4N2 |
6.86ab |
401.00cde |
|
NP2N1 |
7.02ab |
340.00i |
|
NP1N1 |
6.52b |
341.12i |
|
NP1N4 |
7.13ab |
391.59def |
|
NP2N3 |
6.86ab |
376.50fg |
|
NP3N2 |
8.69ab |
410.65cd |
|
NP3N4 |
6.94ab |
441.26ab |
|
NP3N3 |
8.69a |
460.96a |
|
NP4N3 |
7.58ab |
420.63bc |
|
NP2N4 |
6.77ab |
381.83efg |
|
NP4N1 |
7.58ab |
366.83gh |
|
NP2N2 |
6.55b |
344.50hi |
|
NP1N3 |
6.58b |
365.46gh |
|
Mean |
7.12 |
386.05 |
|
LSD (5%) |
1.97 |
22.91 |
|
CV (%) |
24.03 |
5.16 |
Means in columns and rows followed by the same letter(s) are not significantly different at 5% level of significance. Where ARN=average root number and ARW=average root weight, NP=NPS, N=Nitrogen, LSD (0.05) = Least Significant Difference at 5% level; and CV (%) = coefficient of variation in percent
Applying a combination of NPSB and nitrogen fertilizer ratios had a positive impact (p<0.05) on root weight parameters of sweet potato. The highest average root weight (460.9 g) was obtained in sweet potato fertilized with NPSB and nitrogen fertilizers at the rate of 150 kg NPSB ha-1 and 46 kg N2 ha-1, while the lowest average root weight (341.1 g and 340 g) resulted from application dose of 50 kg NPSB ha-1 with zero application. This could be because of nutrient utilization efficiency of the treatment and most likely crop nutrient requirements as proved by.26 Root number and weight are two important factors that determine yield. Both are critical to root crop productivity.
Yield Parameters of Sweet Potato
Marketable, Unmarketable and Total fresh root Yield
The interaction effects of N2 and NPSB blended fertilizer was resulted in highly significant (p<0.001) differences on marketable and un-marketable root yield. Sweet potato variety Naspot-13 fed with 100 kg ha-1 NPSB and 69 kg ha-1 nitrogen fertilizer showed the highest (553.09 qt ha-1) significant difference in marketable root yield but the lowest (280 qt ha-1) yield were recorded for treatments that received no nutrients. The highest (95.70 qt ha-1) non-marketable root yield produced in the treatment with 100 kg ha-1 of NPSB fertilizer without unapplied treatment and the lowest (22.41 qt per hectare) with 50 kg ha-1 of NPSB fertilizer and 69 kg ha-1 nitrogen fertilizer application. This shows that adding too much fertilizer to a plant does not necessarily increase economic yield. Once the plants have absorbed the required amount, the remaining nutrients can be removed from the soil by various mechanisms, so adding too much or too little fertilizer can lead to losses in production and income.27 Reported the yield effects of essential nutrients.
Total fresh root yield was highly significantly (P<0.01) affected by the main and their interaction effect of blended NPSB and N2 fertilizer application rates. The highest total yield of fresh roots (588.37 qt ha-1) was recorded in plots fertilized with 100 kg ha-1 of NPSB fertilizer at 69 kg ha-1 N2 fertilization rate. The lowest 375.70 qt per acre yield was obtained from unfertilized plot. Various studies have reported very significant increases in total root yield with increasing nitrogen levels and nitrogen application.
Table 7: Pooled mean interaction effects of NPSB and N fertilizers on survival rate, plant height, and average stem number of Sweet potato at Adola during 2020 and 2021
|
Treatments (kg ha-1) |
MRY (qt/ha) |
UMRY (qt/ha) |
TRY (qt/ha) |
|
|
NPSB |
Nitrogen |
|||
|
0 |
23 |
289.90o |
90.07b |
379.97o |
|
100 |
0 |
404.89k |
58.11g |
463.00k |
|
150 |
69 |
519.93d |
68.44e |
588.37a |
|
150 |
23 |
509.46e |
35.65m |
545.12e |
|
50 |
0 |
342.91m |
55.27h |
398.18n |
|
0 |
0 |
280.00p |
95.70a |
375.70p |
|
0 |
69 |
350.20l |
78.39d |
428.59l |
|
50 |
46 |
485.86g |
48.12j |
533.99g |
|
100 |
23 |
500.02e |
40.50l |
540.52f |
|
100 |
69 |
553.09a |
27.33o |
580.43b |
|
100 |
46 |
541.58b |
22.41p |
563.99c |
|
150 |
46 |
528.78c |
31.20n |
559.99d |
|
50 |
69 |
485.00h |
46.39k |
531.39h |
|
150 |
0 |
441.24j |
58.46f |
499.70j |
|
50 |
23 |
465.00i |
50.37i |
515.37i |
|
0 |
46 |
322.20n |
85.14c |
407.35m |
|
Mean |
438.75 |
55.72 |
494.48 |
|
|
LSD (0.05) |
0.766 |
0.33 |
0.86 |
|
|
CV (%) |
1.52 |
5.26 |
1.52 |
|
Means in columns and rows followed by the same letter(s) are not significantly different at 5% level of significance. Where MRY=marketable root yield, UMRY=unmarketable root yield and TRY=total root yield, NP=NPS, N=Nitrogen, LSD (0.05) = Least Significant Difference at 5% level; and CV (%) = coefficient of variation in percent
Economic Analysis of N and NPSB Fertilizer
Economic analysis was done based on the view of,17 recommendations, which clearly shows that the application of different fertilizer rates with the marginal rate of return above the minimum level (100%) is economical. As farmers attempt to judge the economic benefits of change in practice, partial budget analysis was done to identify the satisfying treatments. The marketable root yield was adjusted by 10% adjustment coefficient for management difference to reflect the difference between the experimental yield and the yield that farmers could expect from the same treatment and the marginal rate of return (MRR) and net benefits are calculated by current fertilizer NPSB and Urea price 65 and 61.50 birr kg-1, respectively and field price of sweet potato was 15 birr kg-1.
The economic analysis showed that the highest net profit of 728947 Birr ha-1 was achieved by applying 100 kg ha-1 NPSB and 69 kg ha-1 nitrogen fertilizer, while the control treatment was shown to be the lowest approximately 376500 birr ha-1. This indicates the profitability of fertilizer processing. The marginal return which determines the acceptability of all treatments, shows that the treatment fed with 100 kg ha-1 NPSB and 69 kg ha-1 nitrogen fertilizer achieved the best result, i.e. a marginal yield of 2256.02% is the best combination. This means that for every input of 100 kg ha-1 NPSB and 69 kg ha-1 N2 the producer invests 1.00 birr and applies it to the field and the farmer recovers his 1.00 birr and in addition he expect a return of 22.56 Birr. Therefore, the treatment application of 100 kg ha-1 NPSB and 69 kg ha-1 nitrogen fertilizer was the most economical rate for producers with low production costs and high profits.
Table 8: Cost Benefit Analysis of NPSB and N fertilizer rate on sweet potato root yield
|
Trt |
AJY(qt/ha) |
GB (Birr ha-1) |
TVC |
NB |
MC |
MB |
MRR (%) |
|
0*0 |
252 |
630000 |
1500 |
376500 |
0 |
0 |
0 |
|
0*23 |
260.91 |
652275 |
4575 |
386790 |
3075 |
10290 |
334.63 |
|
50*0 |
290.619 |
726547.5 |
5000 |
430928.5 |
425 |
44138.5 |
10385.53 |
|
0*46 |
289.98 |
724950 |
7650 |
427320 |
2650 |
-3608.5 |
D |
|
50*23 |
301.5 |
753750 |
8075 |
444175 |
425 |
16855 |
3965.88 |
|
100*0 |
346.401 |
866002.5 |
8500 |
511101.5 |
425 |
66926.5 |
15747.41 |
|
0*69 |
315.1809 |
787952.3 |
10725 |
462046.4 |
2225 |
-49055.1 |
D |
|
50*46 |
329.274 |
823185 |
10900 |
483011 |
175 |
20964.65 |
11979.80 |
|
100*23 |
441.918 |
1104795 |
11575 |
650902 |
1075 |
167891 |
15617.77 |
|
150*0 |
397.26 |
993150 |
12150 |
583740 |
175 |
-67162 |
D |
|
50*69 |
436.5 |
1091250 |
14225 |
640525 |
2075 |
56785 |
2736.62 |
|
100*46 |
487.422 |
1218555 |
14650 |
716483 |
425 |
75958 |
17872.47 |
|
150*23 |
458.514 |
1146285 |
15225 |
672546 |
575 |
-43937 |
D |
|
100*69 |
497.781 |
1244453 |
17725 |
728946.5 |
2500 |
56400.5 |
2256.02 |
|
150*46 |
475.902 |
1189755 |
18300 |
695553 |
575 |
-33393.5 |
D |
|
150*69 |
467.37 |
1168425 |
21375 |
679680 |
3075 |
-15873 |
D |
Where AJY=adjusted yield, GB=gross benefit, TVC=total variable cost, NB=net benefit, MC=marginal cost, MB=marginal benefit, MRR=marginal rate of returns
Pearson Matrix Correlation Coefficient (r) Analysis
Correlation analysis is a statistical method used in agricultural research to study the relationship between different variables such as yield and its components in crops such as sweet potatoes. These analyzes can help you understand the factors that most influence yield and can guide your cultivation strategy. Pearson’s correlation coefficient (r) can be used to discover how two variables are related. A positive correlation (r > 0) indicates that increasing one variable tends to increase the other variable, and a negative correlation (r < 0) indicates the opposite relationship. This helps identify which variables influence yield predictions. We will discuss how these analytical results are typically performed in relation to sweet potato yield and its composition.
In this study, we found that both the genotype and phenotypic relationship were more or less consistent. Among different yield components, stem number, root number, and non-market root yield were negatively correlated with plant nitrogen and NPSB fertilizer intake. In another case, the yield parameters of root weight, marketable root yield, and total yield were strongly positively correlated with plant nitrogen and NPSB fertilizer application. Correlation analysis between marketable yield (qt ha-1) and yield and growth traits revealed that sweet potato marketable root yield has a strong positive connection with average root weight (r=0.669**) and total root yield (r=0.989**). In general, the correlation coefficients reported in Table 7 clearly describe the patterns and interrelationships between yield and yield characteristics considered in the experiments.
Table 9: Simple linear correlation coefficient (r) for NPSB and Nitrogen fertilizer Rates on phenological, growth, yield and yield components of sweet Potato.
|
NPSB |
N |
SR |
DM |
APH |
STMN |
ARN |
ARW |
MRY |
UMRY |
TRY |
|
|
NPSB |
1.0000 |
0.0000 |
0.2051 |
0.0268 |
0.1285 |
0.1343 |
0.0957 |
0.4821 |
0.7690 |
-0.6623 |
0.7667 |
|
N |
1.0000 |
-0.0061 |
0.0302 |
0.1662 |
-0.0496 |
-0.0052 |
0.4727 |
0.4417 |
-0.2180 |
0.4898 |
|
|
SR |
1.0000 |
-0.4646 |
-0.1548 |
0.0608 |
0.4466 |
0.1568 |
0.1811 |
-0.1185 |
0.1919 |
||
|
DM |
1.0000 |
0.4657 |
0.1782 |
-0.5439 |
0.0588 |
0.0427 |
-0.0580 |
0.0361 |
|||
|
APH |
1.0000 |
0.0836 |
-0.3319 |
0.2288 |
0.1830 |
-0.1241 |
0.1926 |
||||
|
STMN |
1.0000 |
-0.0098 |
0.1164 |
0.1448 |
-0.1649 |
0.1322 |
|||||
|
ARN |
1.0000 |
0.1941 |
0.0886 |
-0.1145 |
0.0767 |
||||||
|
ARW |
1.0000 |
0.6694 |
-0.6337 |
0.6501 |
|||||||
|
MRY |
1.0000 |
-0.8847 |
0.9899 |
||||||||
|
UMRY |
1.0000 |
-0.8097 |
|||||||||
|
TRY |
1.0000 |
Conclusion and Recommendations
The crop is one of the most important root crops that can plays a major role in food security and income generation. However, the production and productivity of the crop is constrained by various factors. The average national yield of sweet potato is about 8 ton ha-1 which is very low as compared to the world`s average production 14.8 ton ha-1. Basically Fertilizers containing S and B are important for improvement of yield of sweet potato. It is evident from the research that adopting appropriate fertilizer rate recommendations can result in improved crop growth and yield while minimizing resource wastage.
The interaction effects of NPSB and Nitrogen fertilizer rates had significantly (P<0.01) affected average root number, root weight, marketable root yield, unmarketable root yield and total root yield of the plant. The treatment with 100 kg ha-1 NPSB and 69 kg ha-1 nitrogen fertilizer had the highest significant difference in marketable root yield (553.09 qt ha-1) however, the lowest yield (280 qt ha-1) was recorded in the zero nutrient treatment. The highest (95.70 qt ha-1) non-marketable root yield was gained from the treatment with 100 kg ha-1 of NPSB fertilizer without nitrogen doses and the lowest (22.41 qt ha-1) was obtained with 50 kg ha-1 of NPSB fertilizer and 69 kg ha-1 nitrogen fertilizer treatment. Although the treatment with a nutrient rate of 100 kg ha-1 NPSB and 69 kg ha-1 nitrogen fertilizer had the highest net benefit (728947 br) and the marginal return that determining the acceptability of all treatments with the application of 100 kg ha-1 NPSB and 69 kg ha-1 nitrogen fertilizer gave the best result with a marginal return of 2256.02%.
In general, research suggests that adopting appropriate fertilizer ratio recommendations can improve plant growth and yield while minimizing resource waste. Therefore through careful analysis and experimentation, our research results demonstrate that the optimal provided valuable insight in determining fertilizer application rates. It is recommended as an economic rate to achieve optimal sweet potato productivity for the Adola Rede areas and similar agro-ecologies.
Acknowledgment
I extend my heartfelt gratitude to Oromia Agricultural Research Institute and Bore Agricultural Research Center for their unwavering support and generous funding that made this research endeavor possible. Their belief in the significance of this study empowered us to delve deeper into the subject matter and explore new horizons. Their financial support not only facilitated the logistical aspects of this research but also served as a testament to their commitment to fostering basically research exploration and innovation within our organization.
Funding Sources
The research funded by Oromia Agricultural Research Institute. The funding Institute had no role in the study design, data collection and analysis, decision to publish or preparation of the manuscript.
Conflict of Interest
The authors declare that they have no conflict of interest
Authors’ Contribution
Mr. Solomon Teshome proposed, initiated, in charge of the system design and the implementation of the field trial. As well as he performed the data processing, conception and reviewed the entire article. Mr. Arega Amide and Miresa Mitiku were coordinated the general planting, data collection and harvesting parts of the trial.
References
- Abd El-Baky MMH, Ahmed AA, Abd El-Aal FS, Salman SR., 2009. Effect of Some Agricultural Practices on Growth, Productivity and Root Quality of Three Sweet Potato Cultivars. Journal of Applied Sciences Research 5: 1966-1976.
- Berberich T, Takagi T, Miyazaki A, Otani M, Shimada T, Kusano T., 2005. Production of mouse adiponectin, an anti-diabetic protein, in transgenic sweet potato plants. Journal of Plant Physiology 162:1169-1176. http://dx.doi.org/10.1016/j.jplph.2005.01.009.
CrossRef - Central Agricultural Census Commission, 2003. Agricultural Sample numeration,Addis Ababa, Ethiopia. 374 p.
- Food and Agriculture Organization, 2000. The state of food insecurity in the world 2000. ISBN 92-5-104479-1 Job No. X8200/E 36 pp.
- Food and Agriculture Organization, 2011. Statistical database. http://faostat. fao.org/site/567/Desktop Default. aspx? Page ID=567 ancor (accessed October 7, 2012).
- Ewell and Mutuura, 1994. Sweet potato in the food system of Eastern and Southern Africa. In: Ofori F, Hahn SK (eds)
CrossRef - Food and Agriculture Organization, 2014 from 23 October, version.
- Basel AO, Atif YM., 2011. Effect of fertilizers on growth, yield, yield components, quality and certain nutrient contents in broccoli (Brassica oleracea). Int. J. Agric. Biol. 10(6):627-632.
- Belehu T., 2003. Effect of planting density and cultivar on yield and yield components of sweet potato [Ipomoea batatas (Lam.)] grown in Hawassa and Melkassa Agricultural Research Centers of Ethiopia. University of Pretoria etd. 213 pp.
- Israel Z, Ali M, Solomon T. 2012. Effect of different rates of nitrogen and phosphorus fertilization on yield and yield component of potato (Solanum tuberosum L.) at Mashan, Southwestern of Ethiopia. African Journal of Plant Science 3 (2): 016-024.
- Ojeniyi SO., 1992. Food cropping, soil tillage and tillage research in sub-Saharan Africa. Paper presented at Inaugural Seminar of ISTRO, Nigeria Branch, NCAM, and Ilorin, Nigeria.
- Masarirambi MM, Mandisodja FC, Mashingaidze AB, Bhebhe E., 2012. Influence of plant population and seed tuber size on growth and yield components of potato (Solanum tuberosum). Int. J. Agric. Biol. 14(4):545-549.
- El Sayed Hameda EA, Saif El Dean A, Ezzat S, El Morsy AHA., 2011. Responses of productivity and quality of sweet potato to phosphorus fertilizer rates and application methods of the humic acid. International Research Journal of Agricultural Science and Soil Science 1: 383-393.
CrossRef - Endale, T., Terefe, B., Mukgeta, D., Geleta, L., 1994. Improvement studies on Enset and Sweet potato. In: proceedings of the second national Horticultural workshop in Ethiopia, 1-3 Dec.1992. Addis Ababa, Ethiopia.
- Arisha HM, Bradisi A (1999). Effect of mineral fertilizers and organic fertilizers on growth, yield and quality of potato under sandy soil conditions. Zagazig J. Agric. Res. 26:391 -405.
- Solomon Teshome et al., Adaptability and Evaluation of Improved Orange Fleshed Sweet Potato (Ipomoea batatas L.) Varieties in the Mid Altitude of Guji Zone, Southern Ethiopia. Advances in Bioscience and Bioengineering; 8(3): 35-41.
CrossRef - CIMMYT (The International Maize and Wheat Improvement Center), 1988. From Agronomic Data to Farmers Recommendations: An Economics Training Manual. Completely Revised Edition. Mexico, D.F. ISBN 968-61 27-18-6.
- SAS Institute, I. 2002. SAS/STAT users Guide for Personal Computers Version (9.1.3: SAS-Institute. Cary, Nc.
- Berhanu D, 1980. The physical criteria and their rating proposed for land evaluation in the highland region of Ethiopia. Land Use Planning and Regulatory Department, Ministry of Agriculture, Addis Ababa, Ethiopia.
- Hazelton, P.A. and Murphy, B.W. (2007) Interpreting Soil Test Results: What Do All the Numbers Mean? CSIRO Publishing, Australia, 1-152. https://doi.org/10.1071/9780643094680
CrossRef - Olsen SR, CV Cole, FS Watanabe, LA Dean, 1954. Estimation of available phosphorus in soils by extraction with sodium carbonate. USDA Circular 939:1-19.
- Tekalign Mamo, Haque, I. and Aduayi, E.A., 1991. Soil, plant, water, fertilizer, animal manure and compost analysis manual. Plant science division working document 13, ILCA, Addis Ababa, Ethiopia.
- Giniting, D., A.Kess AVALOV, B.E ghball, and J.W.Doran, 2003. Greenhouse gas emissions and soil indicators four years after manure and compost applications. J.Environ.qual.32:23-32.
CrossRef - Mugwira, L.M., 1979. Residual effects of dairy manure on millet and rye forage and soil properties .J. Environ. Qual. 8: 251-255.
CrossRef - Sayanowako A, Mangani R, Mtaita T, Mazarura U., 2014. Effect of stem density on growth, yield and quality of potato variety amethyst. Afr. J. Agric. Res. 9(17):1391 -1397.
- Marschner H., 1995. Mineral Nutrition of Higher Plants. 2nd Academic Press, Harcourt Brace and Company, Publishers. London, New York, Tokyo, pp 864.
- Firew G, Nigussie D, Wassu M., 2016. Response of potato (solanum tuberosum L.) to the application of mineral nitrogen and phosphorus under irrigation in Dire Dawa, Eastern Ethiopia. Journal of Natural Sciences Research. ISSN 2224-3186 (Paper) 6(7).