
Introduction
India’s agriculture industry has the ability to improve the nation’s standard of living. The agriculture industry continues to be the main source of income for over 58% of the population in India, although contributing only 14.2% of the country’s GDP, according to the country’s most recent census (2011). But with time, the proportion of large farms (> 5 ha) fell from 6% to 3%, and the proportion of small farms (< 1 ha) rose from 59% to 67% between 1991 and 20111. Because it barely occupies 2.3% of the world’s land area, the nation faces an even greater difficulty in ensuring the food security of its fuming millions, or roughly 17.5% of the global population2. However, India uses 165 kg of fertilizer per hectare, compared to the global average of 138 kg. This indicates that fertilizer is utilized excessively and inefficiently, which increases the risk of insect infestation, soil pollution, and crop nutrition issues3,4.
Chemical Agriculture’s Repercussions
More harm than good has resulted from chemically input based agriculture, despite claims to the contrary. Some of the well-known effects of chemical-based agriculture are global warming, soil micronutrient erosion, nitrification of ground water, pesticides getting into the food chain, etc. The role of naturally existing microorganisms has been hampered by previous trends in conventional Indian agriculture, such as monoculture without crop rotation, excessive use of chemical fertilizers, and widespread use of broad-spectrum organophosphate insecticides5. The beginning of the green revolution and the growing use of chemical fertilizers in agriculture were supposed to make the nation self-sufficient in food production, but instead they had a negative influence on the environment and all living things. The overuse of chemical fertilizers in agriculture is expensive and has a number of negative impacts on the soil, including a reduction in soil fertility, water-holding capacity, and nutrient disparities6.
The growing price of nitrogenous fertilizers, which is sometimes concealed by developing country governments as subsidies, further complicates the situation. A global manufacturer of nitrogenous fertilizers acknowledges this, stating that “natural gas is used as a raw material in the production of nitrogen fertilizers.” Furthermore, a lot of heat is needed for the process, which can also be provided by natural gas. However, the truth remains that in order to feed the expanding populations of developing nations, more crops must be produced and the fertility of the land must be increased7. Therefore, it became necessary to create some inexpensive, environmentally acceptable fertilizers that would function without interfering with the natural world. These days, several species of microorganisms are employed extensively because of their special capacity to produce natural compounds that could be a useful alternative to chemical fertilizers. BgM is highly relevant as an input to sustainable agriculture (MNES)8 because of all these factors.
Biogas Manure (BgM) and its features
After dung or other biomass is digested to produce methane-rich gas, the biogas plant produces biogas manure (BgM), a byproduct. BgM provides vital nutrients, improves soil aeration and water retention, speeds up root development, and prevents weed seeds from sprouting.It might be feasible to apply biogas slurry and biofertilizer to fields in order to make use of the nutrients in the slurry and reduce the risk to the environment9. One important way to assess the quality of the ecological environment is to look at how bacterial populations respond to the usage of biogas slurry and biofertilizer10.
One of the key macronutrients required for healthy plant growth is phosphorus11. According to reports, phosphorus is the limiting plant nutritional component in soils and is essential for the appropriate feeding of plants. A significant amount of the accessible phosphate in soil is transformed into insoluble forms by microbes and chemicals, which gradually accumulates in the soil as an insoluble phosphate pool12. Rhizosphere soil often contains a significantly higher concentration of phosphate solubilizing bacteria. Phosphates are known to be soluble in a variety of microorganisms, such as cyanobacteria, actinomycetes, fungi, and yeasts13. The most potent phosphate solubilizers are Pseudomonas, Bacillus, Actinomycetes, Cyanobacteria, Rhizobium, Penicillium and Aspergillus.These microorganisms can release organic acids such as fumaric, fumaric, lactic, acetic, propionic, and formic acids, which can change the insoluble phosphates in soil into soluble forms. These acids dissolve bound phosphate forms and lower pH levels14.
Improving soil management, cropping techniques, and the inoculation of a highly effective Rhizobium strain are essential for increasing the seed production of leguminous crops, especially in Asia.15. Nitrogen with phosphorus is two of the fertilizer ingredients that are essential to plant growth and development. One frequent soil bacterium is Rhizobium. Humans, plants, or animals cannot be poisoned by Rhizobium16. It is among the most advantageous microorganisms for farming. Either there aren’t enough native Rhizobium plants to nodulate the crop appropriately, or the plants aren’t doing a good job of fixing nitrogen. After years of producing legumes, Rhizobium will spread to neighbouring fields, and inoculation is cheap17. Throughout history, Rhizobium species have been incorporated into legumes as a means of providing fixed nitrogen18. Rhizobia, soil bacteria, work in symbiotic relationships with legumes to fix atmospheric nitrogen. Normally, they penetrate the root hairs, grow there, and produce nodules. The Rhizobium strain, the type of plant, and the surrounding circumstances all played a vital role how much nitrogen is fixed19.
Top state for using biofertilizers – Tamil Nadu
In terms of using bio-fertilizers, which are organic fertilizers instead of chemical ones, Tamil Nadu leads all other states in this regard. The State produces more than 14,000 biofertilizers annually, according to data provided by the National Centre of Organic Farming 20.Thus, an investigation was conducted to determine the significance of Rhizobium, PSO, and rock phosphate on the leguminous plant Phaseolusvulgaries, as well as the effects on the plant’s microbial load, growth, and nutrition (Fig.1).
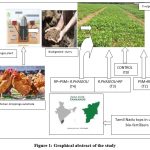 |
Figure 1: Graphical abstract of the study |
Materials and Methods
Isolation of Phosphate Solubilizing Organisms
Isolation methodology was followed by Kannan, (1996)21
100ml distilled water+1gm rhizosphere soil
Serial dilution
Pour plating on HAM
Incubation (7-14 days, room temperature)
Zones around the colonies
Isolation followed by mass cultivation
Isolation of R.phaseolifrom P.vulgaris
The leguminous plant was removed from Sankarankoil, Tamil Nadu, India, agricultural area, and the soil particles that had adhered to the root system were washed away with flowing water. After that, the plant’s shoot section was chopped off, and the nodule-filled roots were transported in polythene bags to the lab in order to isolate R.phaseoli.
A selection of firm, healthy pink nodules was made, and they were cleaned using tap water.
For 4-5 minutes, they were submerged in 0.1% acidified HgCl2 to sterilize their surfaces.
Using a glass rod and a tiny aliquot of sterile water, the nodules were crushed in a mortar. We refer to this as nodule extract.
Up to 109 serial dilutions were made. Decimally diluted nodule extracts are dispersed in aliquots over CRYEMA at the proper dilutions 22
For 3–4 days, the plates were incubated at room temperature (20–260C).
Large, gummy bacterial colonies appeared following a 5-day incubation period. They were verified, separated, cleaned, and kept in storage at 40C for future identification.
Identification
Vincent (1970)22 provided a scheme for the cultural and biochemical testing of isolated rhizobial colonies. After being moved to nutrient broth, the pure cultures of R. phaseoli were agitatedly incubated for twenty-four hours at 37±20C. Several identifying techniques were applied to these newly created broth cultures. (Table 2).
Sector Application
Using soil as the substrate, the biogas waste slurry was used in the plot culture experiment. Rock phosphate was added to the plots containing biogas waste slurry at a rate of 10g P/kg of slurry. Before planting, water was added to each plot to change the slurry’s moisture level. After rinsing in sterile water, the P. vulgaris seeds of uniform size were surface sterilized using a 0.5% sodium hypochlorite solution. In distinct plots, the seeds were planted and allowed to sprout. The plants were watered regularly to maintain 60 percent maximum Water Holding Capacity (WHC). On alternative days, the plots were inoculated with R.phaseoli and PSO for 10days. Germination count was taken for 10days after sowing. Plant growth parameters, nutrient content and microbial load were determined. The dry weight was recorded after drying in an oven at 600C for four days. Nutrient content in shoots were determined by the standard method of Jackson (1970)23.
Table 1: Different treatments for experimental plot plants
|
Treatment |
Nature of the treatment |
|
TO |
CONTROL (SOIL&SLURRY) |
|
T1 |
ROCK PHOSPHATE (RP) |
|
T2 |
PHOSPHATE SOLUBILIZING ORGANISM (PSM)+RP |
|
T3 |
R.PHASEOLI+RP |
|
T4 |
RP+PSM+ R.PHASEOLI |
Analytical Statistics
The means (±SD) of three samples are used to express each value. Furthermore, a Least Significant Difference (LSD) analysis was performed on the preflowering, flowering, and final stage data. The findings showed that there was significant observation in the final stage and during flowering (Table 10). However, there was no significant observation in the pre-flowering stage because at this stage the plants prepare themselves to accept the manurial effect, and their efficacy was only observed in the final stage and during flowering. Therefore, manure had no discernible influence during the preflowering stage but had a considerable effect throughout the flowering and final stages.
Results
Table 2: Biochemical characteristics of R.phaseoli.
|
Biochemical experiments |
Observation |
|
Microscopic observation |
G(-) |
|
Motility |
Motile |
|
Growth on Peptone-Glucose Agar |
Very poor growth |
|
Congo Red Test |
white translucent, glistening colonies with entire margin |
|
Hofer’s Alkaline Broth Test |
– |
|
Lactose Agar |
+ |
|
Catalase test |
+ |
|
Starch hydrolysis |
– |
|
Casein hydrolysis |
– |
|
Lipid hydrolysis |
– |
|
Gelatin hydrolysis |
– |
|
Production of indole |
– |
|
MR-Test |
– |
|
VP-Test |
+ |
|
Simmons citrate Test |
+ |
TPSMP, THFP, and THBP analysis in the plot soil (CFU/ml)
After collecting and analysing the rhizosphere soil from mud plots, it was discovered that THBP and THFP occurred in the range of 106 and 103 cfu/gm, respectively. The microbial density in the TPSMP example was approximately 103cfu/gm. The field soil’s THBP was 14×106±1.180cfu/gm, THFP was 16×103±1.431cfu/gm, and TPSMP was 41×103±1.078 cfu/gm prior to the amendments being applied. (Table 3).
Table 3: THBP, THFP and TPSMP in the plot soil (CFU/ml).
|
Sampling stage |
THBP |
THFP |
TPSMP |
|
Initial soil |
14×106±1.180 |
16×103±1.431 |
41×103 ±1.078 |
THBP – Values as counts of x106cfu/gm
THFP&TPSMP – Values as counts of x103cfu/gm
Examination of TPSMP, THFP, and THBP at different stages of treatment during the seedling stage (CFU/ml)
The results revealed that the control consists lower microbial population (Fig. 2).The highest THBP, THFP and TPSMP were observed in the R.phaseoli+PSO+RP applied plots in the order (194×106±0.264cfu/gm),(Fig. 2A) (89×103±0.637cfu/gm) (Fig.2B) and (158×103±0.390cfu/gm) (Fig. 2C) respectively. The minimum load observed in control (29×103±0.415cfu/ml).
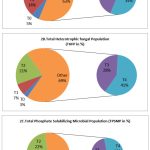 |
Figure 2: Analysis of THBP, THFP and TPSMP at various treatment during seedling stage(CFU/ml) |
Pre-flowering stage analysis of THBP, THFP, and TPSMP at different treatments (CFU/ml)
The analysis of microbial load of THBP, THFP and TPSMP during preflowering stage revealed that the maximum load was observed in the treatment plot of R.phaseoli+PSO+RP (193×106±0.358 cfu/gm, 91X103cfu/gmand 170X103cfu/gm,) respectively (Fig. 3). In flowering and final stage also, the maximum microbial load were seen in the plot containing the mixed amendments followed by R.phaseoli+RP inoculated plots PSO+RP inoculated pots and RP alone inoculated pots. The least count was observed in the control plots in all stages (Fig 3A,3B,&3C).
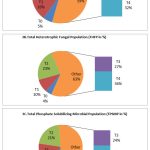 |
Figure 3: Analysis of THBP, THFP and TPSMP at various treatments during pre flowering stage (CFU/ml) |
Analysis of TPSMP, THFP, and THBP at different flowering stage treatments (CFU/ml)
During the flowering stage, the T4 treatment contained the highest number of bacteria, fungi and phosphate solubilizing organisms (Fig. 4). This is followed by T3, T2, and T1. The control considered as T0 contained very low levels of this microbial population (Fig. 4A,4B&4C).
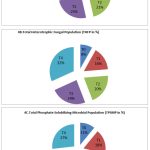 |
Figure 4: Analysis of THBP, THFP and TPSMP at various treatments during flowering stage (CFU/ml). |
Analysis of TPSMP, THFP, and THBP at different yielding stage treatments (CFU/ml)
During yielding stage also, bio slurry field containing R.phaseoli, PSM and rock phosphate encourages more bacterial (198X106±1.091cfu/ml) fungal (112X103±1.234cfu/ml) and phosphate solubilizing microorganisms (193X103±1.076cfu/ml) populations (Fig. 5). The least counting was observed in control field. In all plots, this microbial population gradually improved from the initial stage and achieved good growth during yielding.
The aforementioned findings demonstrated a significant rise in THBP, THFP, and TPSMP loads from the first to the latter stages of soil analysis. In the R.phaseoli+PSO+RPapplied field, a sharp rise in THBP, THFP, and TPSMP was also noted.
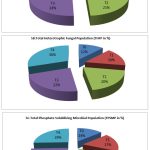 |
Figure 5: Analysis of THBP, THFP and TPSMP at various treatments during yielding stage (CFU/ml) |
NPK utility
The soil’s NPK content was measured both before and after manures were applied. A noticeable drop in the initial to final NPK concentration showed that plants were using a significant amount of NPK in the soil for growth and yield (Fig 6). The experimental plant’s morphological and biochemical characteristics were measured at various growth stages and recorded. Plants grown in pots treated along rock phosphate with Phosphate Solubilizing Organisms and enriched biodigested slurry along withR. phaseoli than others showed a more marked rise in height and dry matter content.
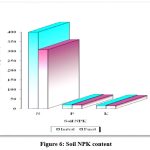 |
Figure 6: Soil NPK content |
Biodigested manurial sources’ impact during the pre-flowering stage
In pre flowering stage the root length, shoot length, total height, wet weight, dry weight and chlorophyll content were more in the plants cultivated the plots containing R.phaseoli+PSO+RP as biodigested organic manure compare to other biodigested organic amendments (Table 4).
Table 4: Influence of manurial sources on the morphological parameters and chlorophyll content of P.vulgaris grown at pre-flowering stage
|
Manurial sources |
Pre-flowering stage |
|||||
|
Root length(cm) |
Shoot length(cm) |
Total height(cm) |
Wet weight(g) |
Dry weight(g) |
Chlorophyll content(mg/lit) |
|
|
T0 |
3.9±0.190 |
5.0±0.289 |
8.9±0.557 |
5.9±0.100 |
0.760±0.110 |
0.140±0.109 |
|
T1 |
4.2±0.150 |
5.1±0.793 |
9.3±0.656 |
6.1±0.360 |
0.680±0.014 |
0.142±0.001 |
|
T2 |
4.5±0.193 |
5.3±0.468 |
9.8±0.917 |
6.2±0.017 |
0.660±0.105 |
0.152±1.009 |
|
T3 |
4.7±1.265 |
6.2±0.036 |
10.9±1.014 |
6.5±0.014 |
0.640±1.010 |
0.158±0.108 |
|
T4 |
5.3±0.070 |
6.8±0.610 |
12.1±1.058 |
6.8±0.155 |
0.720±1.006 |
0.182±0.014 |
Each value is expressed as Mean±Standard Deviation.
Manurial sources’ influence during the blossoming stage
During the blooming stage, pots treated with R.phaseoli+PSO+RP showed the highest chlorophyll content (23.6±0.265/lit), dry weight (9.1±0.265g), and wet weight (9.881±0.055g). In the R.phaseoli+PSO+RP applied field, the longest shoot length (34.20.854cm), total height (45.41.637cm), and root length (11.20.200cm) were also noted. (Table 5).
Table 5: Influence of manurial sources on the morphological parameters and chlorophyll content of P.vulgaris grown at flowering stage.
|
Manurial sources |
Flowering stage |
|||||
|
Root length(cm) |
Shoot length(cm) |
Total height(cm) |
Wet weight(g) |
Dry weight(g) |
Chlorophyll content(mg/lit) |
|
|
T0 |
8.8±0.080 |
15.3±0.265 |
24.1±0.964 |
4.553±0.056 |
0.491±0.008 |
0.426±0.007 |
|
T1 |
7.4±0.361 |
21.1±0.300 |
28.5±0.656 |
7.320±0.019 |
0.572±0.007 |
0.482±0.015 |
|
T2 |
9.1±0.265 |
23.6±0.265 |
32.7±0.656 |
7.381±0.016 |
0.714±0.005 |
0.526±0.006 |
|
T3 |
9.8±0.700 |
25.4±0.872 |
35.2±0.654 |
9.881±0.055 |
9.1±0.265 |
0.36±0.265 |
|
T4 |
11.2±0.200 |
34.2±0.854 |
45.4±1.637 |
9.433±0.014 |
0.618±0.002 |
0.448±0.002 |
Each value is expressed as Mean±Standard Deviation.
Manurial sources’ influence at the end stage
During the last phase of field plant examination, the R.phaseoli+PSO+RP treated plots showed the longest shoot length (40.1±0.625 cm), the wet weight (18.012±0.024g) and dry weight (0.813±0.012g), the longest root length (13.4±1.058cm), and the total height (53.5±0.755cm) of the plants. (Table 6).
Table 6: Influence of manurial sources at final stage
|
Manurial sources |
Final stage |
|||||
|
Root length (cm) |
Shoot length(cm) |
Total height(cm) |
Wet weight(g) |
Dry weight(g) |
Chlorophyll content(mg/lit) |
|
|
T0 |
10.4±0.458 |
18.6±0.557 |
29.0±1.039 |
6.21±0.046 |
0.52±0.006 |
0.397±0.009 |
|
T1 |
10.2±1.200 |
27.6±0.917 |
37.8±0.800 |
14.374±1.151 |
0.721±0.017 |
0.363±0.015 |
|
T2 |
11.5±0.700 |
28.4±0.755 |
39.9±0.529 |
12.637±0.012 |
0.807±0.010 |
0.472±0.011 |
|
T3 |
12.1±0.361 |
29.2±0.872 |
41.3±1.153 |
9.610±0.019 |
0.473±0.007 |
0.394±0.005 |
|
T4 |
13.4±0.608 |
40.1±0.625 |
53.5±0.755 |
18.012±0.024 |
0.813±0.012 |
0.353±0.012 |
Each value is expressed as Mean±Standard Deviation
Impact of manurial sources on the NPK content in plants cultivated at various growth stages
Because these nutrients are used to boost the production of the product, P. vulgaries plants’ NPK content increased from the seedling stage (Table 7) to the flowering stage and then decreased in the last stage of growth. (Table 8).
Table 7: NPK content at seedling stage
|
Stage |
N(%) |
P(%) |
K(%) |
|
Seedling stage |
1.262±2.608 |
0.28±0.008 |
0.26±0.609 |
Values in Mean±Standard Deviation
Table 8: Effect of manurial sources on the NPK content in P .vulgaries grown at different stages of growth.
|
Manurial sources |
Pre-flowering (%) |
Flowering (%) |
Final (%) |
||||||
|
N |
P |
K |
N |
P |
K |
N |
P |
K |
|
|
T0 |
2.126 |
0.180 |
0.32 |
2.760 |
0.32 |
0.30 |
2.4 |
0.28 |
0.28 |
|
T1 |
1.898 |
0.174 |
0.32 |
2.868 |
0.38 |
0.28 |
1.8 |
0.26 |
0.26 |
|
T2 |
2.126 |
0.178 |
0.28 |
3.000 |
0.40 |
0.28 |
2.8 |
0.38 |
0.22 |
|
T3 |
1.926 |
0.168 |
0.34 |
2.768 |
0.39 |
0.29 |
1.9 |
0.28 |
0.24 |
|
T4 |
2.826 |
0.192 |
0.38 |
3.845 |
0.48 |
0.32 |
2.8 |
0.39 |
0.28 |
Values in Mean±Standard Deviation
Nodulation of P.vulgaries in different amendments
Inoculation with R.phaseoli+PSO+RP treated pots (T4) recorded the maximum number of nodules(36) at final stage (Fig.7) and the weight of the nodule was 0.039g also showed high germination percentage. It was followed by T3, T2, T1. The control showed poor nodule formation and germination percentage (Table 9).
Table 9: Influence of R.phaseoli, PSO with RP on nodulation of P.vulgaris
|
Treatments |
Germination (%) |
Weight of nodules(g) |
|
T0 |
68.7 |
0.039 |
|
T1 |
69.5 |
0.086 |
|
T2 |
70.1 |
0.104 |
|
T3 |
72.6 |
0.211 |
|
T4 |
74.8 |
0.268 |
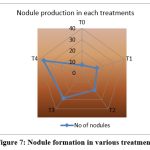 |
Figure 7: Nodule formation in various treatments |
Impact of manurial sources that have been biodigested on yield
The highest recorded cumulative output of P. vulgaris was found in the biodigested poultry droppings slurry enhanced with phosphate and phosphate-solubilizing organisms, as well as R.phaseoli (2.435 tons/hectare) followed by T3 treatment containing the applied RP with R.phaseoli (1.890tons/hec), T2 treatment holed PSM and RP (1.266tons/hec), T1(1.101tons/hec), and finally control (0.821 tons/hectare).Therefore the biodigested slurries obtained from biogas plant enriched with the rock phosphate and phosphate solubilizing organisms gave better yield than the biodigested slurries applied without enrichment (Fig. 8).
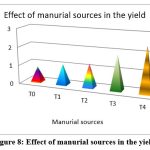 |
Figure 8. Effect of manurial sources in the yield |
Least Significant Difference Analysis
Table 10: LSD in Dry weight of Phaseolus vulgaries during preflowering*, flowering* and final* stages.
|
Manurial sources |
Preflowering Stage* |
||||||
|
Dry weight (g) |
S.Ex |
Difference from Control |
LSD at 5% |
||||
|
To |
0.760 |
0.010 |
0.18 |
0.0196 |
|||
|
T1 |
0.680 |
0.011 |
0.10 |
0.0216 |
|||
|
T2 |
0.660 |
0.005 |
0.13 |
0.0098 |
|||
|
T3 |
0.640 |
0.005 |
0.12 |
0.0098 |
|||
|
T4 |
0.720 |
0.10 |
– |
0.0059 |
|||
|
Manurial sources |
Flowering Stage* |
||||||
|
Dry weight (g) |
S.Ex |
Difference from Control |
LSD at 5% |
||||
|
To |
0.491 |
0.008 |
– |
– |
|||
|
T1 |
0.572 |
0.007 |
0.327 |
0.0118 |
|||
|
T2 |
0.714 |
0.005 |
0.223 |
0.0098 |
|||
|
T3 |
0.900 |
0.007 |
0.081 |
0.0137 |
|||
|
T4 |
0.618 |
0.002 |
0.127 |
0.0039 |
|||
|
Manurial sources |
Final Stage* |
||||||
|
Dry weight (g) |
S.Ex |
Difference from Control |
LSD at 5% |
||||
|
To |
0.52 |
0.006 |
– |
0.0118 |
|||
|
T1 |
0.72 |
0.017 |
0.201 |
0.0333 |
|||
|
T2 |
0.80 |
0.011 |
0.287 |
0.0215 |
|||
|
T3 |
0.47 |
0.007 |
– |
0.0159 |
|||
|
T4 |
0.81 |
0.012 |
0.293 |
0.0236 |
|||
Noted: During the analysis of Dry weight the difference between control and different treatments included that all the given manurial treatments are highly significant in preflowering stage*, flowering stage*and Final stage* (Table 10).
Discussion
In order to increase crop productivity, alternative fertilizer sources have to be considered due to the sharp increase in the price of chemicals and the associated health risks24. As a facet in solving this problem, in this study, PSO, Rhizobium spp., Rockphosphate (T4), and T3-treated plants produced the highest germination percentages, at 74.8 and 72.6, respectively (Table 9). More nodules (T4–36 numbers) formed after application with a mixed format, followed by T3, T2, and T1 (Fig. 7). The lowest quantity of nodule development seen in the control group. Comparable outcomes have been observed for the nodule’s fresh and dry weights.
Digested biogas slurry has a significant impact on crop output when compared to mineral fertilizers, according to studies done by a number of researchers25,26,27,28,29Pugesgaard et al. (2014)30 prioritized agricultural feedstock such as grass-clover over maize. Additionally, cow dung and poultry litter are regarded as valuable feedstock for crop development31,32,33. According to Govasmark et al. (2011)34 and Heviankova et al. (2013)35, harmful microorganisms and heavy metals are thought to be obtained through the post-digestion of agricultural waste, such as sewage sludge. Therefore, in order to manage the sludge, it must be applied to agricultural areas as biofertilizer36,37. Similarly, the slurry that had been resting was mixed fully with the agricultural field after biogas was produced from the chicken farm’s excrement.
The necessary anaerobic digestion byproduct often disregarded, bio-slurry has a high nutrient content and has no negative environmental effects38.In a similar vein, the biodigested slurry that is administered to every trial field is rich in nutrients, which not only promote plant development and yield but also the steady growth of microorganisms and other beneficial soil fauna. This is accurate, as the number of microorganisms in the control field was larger during the yielding stage than during the first stage despite no additional fertilizer being added.
The advantages of organic farming in developed to developing countries were described by Stockdale (2001)39. These benefits included increased crop yield without an excessive reliance on expensive inputs, biodiversity enhancement, environmental protection, and reduced energy use and CO2 emissions. According to extensive study, earthworm activity is higher in an organically managed field than in a farming system that uses chemicals for treatment40.The output of crops like rice (15.7%), wheat (8.9%), cotton (6.5%), and maize (15.2%) increased as a result of the use of synthetic fertilizer combined with bioslurry41. In the same way, compared to other treatments, the biodigested slurry including RP, PSO, and R.phaseoli produced superior results in the T4 treatment.
Additionally, compared to non-enriched control pots, the biodigested slurry enhanced with Rock Phosphate and Phosphate Solubilizing Organisms (RP+PSO) produced greater results next to T4. According to Liu et al. (2009)42 soil productivity is reduced if solely synthetic fertilizers are used. A P dressing was found to enhance nitrogen fixation in legumes by Albrecht et al. (1948)43 most likely as a result of enhanced nodulation and root growth.In comparison to the control, PSO and Rhizobium that were infused with RP (T4) exhibited a notable increase in shoot length. As the plant grew older, the fresh and dry weight of the shoot and root rose, reaching its maximum in the T4 treatment. There was a big difference between this treatment and the others. Due to the high expense of chemical fertilizers, it was necessary to discover an alternative. Often, using bioslurry in conjunction with synthetic fertilizers produced higher yields than using bioslurry alone 44.
The distribution of Rhizobium to increase the nitrogen requirement of growing legumes was established in the experiment of inoculating the leguminous plants with VA mycorrhizal fungi and effective strains of Rhizobium and phosphate solubilizing organisms separately and in dual form. This increased nodulation, nitrogen fixation, and accumulation.45. Like that, in this observation also, the plots enriched with R.phaseous and PSO either in a mixed form or in separate form gave comparatively good results than control. A substantial population of this agriculturally significant Rhizobium species was found when it was cultured using organic manures.
After conducting experiments, Nagarajan and Balachandar (2001)46 found that, out of all the organic amendments utilized, the biodigested slurry from the biogas plant that had been inoculated with Rhizobium produced the notable physiological parameter, and grain yield for both black and green gram, respectively. The organic manure made from biogas slurry and RP provided good morphological and biochemical observations of the experimental plants for this work as well. Three studies have found that applying RP along with PSO improved the amount of P that was accessible to the plants 47,48,.The NPK content of P. vulgaris, shoots and roots was higher in plants injected with PSO and Rhizobium in addition to RP than in plants inoculated with RP alone (Table 8).
The increased plant growth and uptake of P may be the result of soil microbes producing CO2. According to Jurinak (1986)49, CO2 accelerated the breakdown of calcium apatite. Under most circumstances, the dissociation of carbonic acid—which is mostly produced from CO2 as a result of biological respiration—is the main source of protons on the rhizosphere. During the crop growing phase, the PSO population was generally greater in the inoculation treatments compared to the uninoculated treatments (Table 3).When PSO and RP (T4) were applied, the largest number of organisms was recorded. Rhizobium sp. population was highest in treatment T3. Up until the very end, the infected organisms proliferated greatly, and the NPK content, they began to decrease during the harvest phase. There was a decrease in harvest time and a proliferation of inoculated PSO and Rhizobium up to the final stage50. The statistics unequivocally demonstrated that accessible P was more important to the population of potential PSOs than other factors. It may be concluded that nodulation and nitrogen fixation in legumes can be significantly impacted by PSO, Rhizobium, and rock phosphate.
Conclusion
In both developed and emerging nations, organic farming is necessary for ecological and economic sustainability as well as a stable means of subsistence. It produces high-quality food without degrading the environment or the condition of the soil. Digested Biogas Slurry has an average nutritional makeup of 1.262%, 0.28%, and 0.26%. These biodigested slurries improve the soil’s endophytic bacteria, which increases the amount of organic matter produced. Even in the control field, the applied bioslurry in the current study progressively increased the microbial development from the initial stage to the yielding stage. In addition to digested biogas slurry, there is an increase in organic matter in the soil, which is necessary for plant growth. Because poultry manure contains more nutrients than the slurry made from cow dung, the biogas slurry made from poultry litter produces more yields in applied field. The intake capacity of crops, vegetables, and fodders remains a crucial production parameter despite the soil’s increasing nutrient content. Utilizing digested biogas slurry (DBGS) can cut down on the usage of synthetic or chemical fertilizers by 50%. Both biogas residue and slurry are excellent for maintaining and enhancing soil fertility, as well as for improving crop productivity and quality. When bio-slurry is used in the field, production quality is improved and chemical fertilizer consumption costs are decreased, enhancing marketability and contributing to farmers’ economic prosperity. Therefore, using biogas slurry can improve the field’s sustainability while also lowering the expense of chemical fertilizer.
Acknowledgment
I would like to express my sincere appreciation to Shri.A.P.Chidambaram (Secretary), the principals of the V.O. Chidambaram Colleges, as well as A.P. C. Mahalaxmi College for Women, Thoothukudi for their ongoing support and guidance. I would also like to express my gratitude to the research supervisor Dr.D.Radhika who heads the PG & Research department of Zoology at V.O. Chidambaram College, Thoothukudi.
Funding Sources
There is no funding sources.
Conflict of Interest
The authors declare that there is no conflict of interest.
Data Availability Statement
All datasets generated or analysed during this study are included in the manuscript.
Ethics Approval Statement
This article does not contain any studies with human participants or animals performed by any of the authors.
Authors’ Contribution
All authors listed have made a substantial, direct and intellectual contribution to the work, and approved it for publication.
References
- Priyadarshini P., Abhilash P.C. Policy recommendations for enabling transition towards sustainable agriculture in India. Land Use Policy. 2020;96:104718.
CrossRef - Aher S.B,Bhaveshananda S, Sengupta B. Organic agriculture: Way towards sustainable development. International Journal of Environmental Sciences. 2012; 3(1): 209-216.
- FAO, 2019. Tracking Progress on Food and Agriculture Related SDG Indicators. Available at: Food and Agriculture Organisation. http://www.fao.org/sdg-progressreport/en/1038/ s41467.
- World Bank, 2016. World Development Indicators. Available at: http://wdi.worldbank. org/tables.
- Arya A.Biofertilizer for sustainable plant development. Everyman’s Science. 2000; 35(1): 19-25.
- Anandraj M, Venugopal M.N, Veena S.S, Kumar A, Sarma Y.R. Eco-friendly management of disease of spices. Indian species.; 2001;38(3): 28-31.
- Vasudeo G. Biogas Manure (BgM) : a viable input in sustainable agriculture – an integrated approach G.Vasudeo, Secretary Vivekananda Kendra -NARDEP, Kanyakumari, Tamil Nadu, India.
- MNES (Ministry of Non-conventional Energy Sources). 2004. Annual Report 2003/04. New Delhi: MNES, Government of India 2.
- Xianqing Zheng , Juanqin Zhang, NalingBai, Haiyun Zhang , Weiguang. Effects of biogas slurry combined with chemical fertilizer on soil bacterial and fungal community composition in a paddy field. Front. Microbiol. 2021;12:1-19.
CrossRef - Xu M, Xian, Y, Wu J, Gu Y, Yang G, Zhang X. Effect of biogas slurry addition on soil properties, yields and bacterial composition in the rice-rapr rotation ecosystem over 3 years. J. Soils Sediments. 2019;19: 2534-2542.
CrossRef - Goroji P.T, Sarangamath P.A, Channakeshava S, AnandNaik. Direct and residual effect of different P sources with organic manure on available phosphorus and its uptake under sunflower. Jowar cropping system. J. Ecobiol. .2008;22:17-23.
- Vora M.S., Shelat H.N. Isolation and screeningof microorganisms for dissolving tricalciumphosphate.MadrasAgric.J. 1995; 83:350-352.
- Bhagyaraj D.J, Krishnaraj P.U, Khanuja S.P. Mineral phosphate solubilization : Agronomic implications, mechanisms and molecular genetics. Proceedings of Indian National Science Academy. 2000,66:69-82.
- Rudresh D.L, Shivaprakash M.K, Prasad R.D.Effect of combined application of Rhizobium, phosphate solubilizing bacterium and Trichodermaspon growth, nutrient uptake and yield of chickpea.(Ciceraritenium). Applied Soil Ecology. 2004;28:139-146.
CrossRef - Unkovich M.J., Pate J.S. An appraisal of recent field measurements of symbiotic N2 fixation by annual legumes. Field Crops Res. 2000;65: 211-288.
CrossRef - Somesgaran P, Hoben H.J. Hand book of Rhizobia. Methods in Legume-Rhizobium technology, springer-Verlag, Laboratory, New York.pp.332-314.
- Atlas R., Bartha R. Microbial Ecology: Fundamentals and applications. Fourth ed. Benjamin Cummings Mento Park, Ca.1998; 694p.
- Sindhu S.S., Dadarwal KR. Competition for nodulation among rhizobia and legume Rhizobiumsymbiosis.Indian J Microbiol. 2000;40:211-246.
- Allen D.N., Allen E.K. 1961. Leguminaceae, pp. XIII-XXIII and 60-63 the University of Wisconsin. U.S.A.
- The Hindu. 2016. Tamil Nadu tops in use of bio-fertilizers.dated:18.01.2016
- Kannan,N. Laboratory Manual in General Microbiology. Palani Paramount Publication, Palani, Tamil Nadu, India, 1996. p.12-16.
- Vincent J.M.A manual for the practical study of the Root Nodule Bacteria, IBP Hand book No.15, 1970.Blackwell Scientific Publication, Oxford.
- Jackson M.L. Soil Chemical Analysis, Pretice Hall of India (Pvt) Ltd.,New Delhi. 1958.pp.187-190.
- Logakanthi S.J, Rajeshbanu J, Esakkiraj S, Vijaya Lakshmi G.S. Fungal composting –A novel method for green waste composting. Asian Jr. of Microbiol. Biotech.Env.Sc,. 2006;8:205-208.
- Sanger A, Geisseler D, Ludwig B. Effects of moisture and temperature on greenhouse gas emissions and C and N leaching losses in soil treated with biogas slurry. Biology and Fertility of Soils, 2011;47(3), 249-259.
CrossRef - Andruschkewitsch M, Wachendorf C, Wachendorf M. Effects of digestates from different biogas production systems on above and belowground grass growth and the nitrogen status of the plant‐soil‐system. Grassland Science. 2013;59(4), 183-195.
CrossRef - Terhoeven-Urselmans T, Scheller E, Raubuch M, Ludwig B, Joergensen R G. CO2 evolution and N mineralization after biogas slurry application in the field and its yield effects on spring barley. Applied Soil Ecology. 2009;42(3): 297-302.
CrossRef - Bachmann S, Wentzel S, Eichler‐Löbermann B. Codigested dairy slurry as a phosphorus and nitrogen source for Zea mays L. and Amaranthuscruentus L.Journal of Plant Nutrition and Soil Science. 2011;174(6), 908-915.
CrossRef - Joergensen R G, Mäder P, Fließbach A. Long-term effects of organic farming on fungal and bacterial residues in relation to microbial energy metabolism. Biology and Fertility of Soils.2010; 46(3):303-307.
CrossRef - Pugesgaard S, Olesen J.E, Jørgensen U, Dalgaard T. Biogas in organic agricultureeffects on productivity, energy self-sufficiency and greenhouse gas emissions. Renewable agriculture and food systems. 2014; 29(1), 28-41.
CrossRef - Aziz O, Inam A, Samiullah. Utilazation of petrochemical industry waste water for agriculture.Water air Soil Pollut. 1999;115:321-335.
CrossRef - Grameen Shakti. 2006. Field Research Report, Grameen Bank Bhavon, Mirpur.
- Singh S, Hariteja N, Sharma S, Raju N.J, Prasad T.R. Production of biogas from human faeces mixed with the co-substrate poultry litter & cow dung. Environmental Technology & Innovation. 2021;23:101551.
CrossRef - Govasmark E , Stab J, Holen B, Hoornstra D, NesbakkT, Salkinoja-Salonen M. Chemical and microbiological hazards associated with recycling of anaerobic digested residue intended for agricultural use. Waste management, 2011;31(12): 2577-2583.
CrossRef - Heviankova S, Kyncl M, Langarova S. Investigating the current management of digestate in the Czech Republic. Inżynieria Mineralna.2013; 14.
- Kowalczyk-juśko A, Szymańska M.Pofermentnawozemdlarolnictwa [Poferment fertilizer for agriculture]. Warszawa. FundacjaProgramówPomocydlaRolnictwa FAPA.
- Koszel M, Lorencowicz E. Agricultural use of biogas digestate as a replacement fertilizers. Agriculture and Agricultural Science Procedia, 2015;7:119-124.
CrossRef - Edwards C.A, Lofty J.R. Invertebrate fauna of the Park Grass plots. I. Soil fauna. Rep RothamstedExp Stn. Energy commission of Nigeria (1998). Rural renewable energy needs and five supply technologies.1975; pp. 40 – 42.
- Stockdale E.A, Lampkin N.H, Hovi M, Keatinge R, Lennartsson E.K.M, Macdonald D.W, Padel S, Tattersall F.H, Wolfe M.S, Watson C.A. (2001). Agronomic and environmental implications of organic farming systems. In Advances in Agronomy Vol. 70, pp. 261–327). Academic Press Inc. https://doi.org/10.1016/s0065-2113(01)70007-7.
CrossRef - Azcon R, Barea J.M, Hayman D.S.Utilization of rock phosphate in alkaline soils by plants inoculated with mycorrhizal fungi and phosphate phosphate solubilizing bacteria. Soil biol.Biochem. 1976;8(2):135-138.
CrossRef - Kumar S, Malav L.C, Malav M.K, Khan S.A. Biogas slurry: source of nutrients for eco-friendly agriculture. International Journal of Extensive research. 2015; 2: 42-46.
- Liu W.K, Yang Q.C, Du L. Soilless cultivation for high quality vegetables with biogas manure in China: Feasibilities and benefit analysis. In: Renewable Agriculture and food systems. 2009;24(4):300-307.
CrossRef - Albrecht WA, Klemme A, Wand Mierke W. Potassium helps put more nitrogen intosweet clover. J Am.SocAgron, 1948;40:1106-1109.
CrossRef - Groot L., Bogdanski A. Bioslurry: Brown Golg. A review of scientific literature on the co-product of biogas production. Environment ans Natural Resources Series. FAO, Rome, Italy. 2013.32p.
- Singh A., Hayashi K. Microbial cellulases.Protein Architecture molecular properties and biosynthesis Adv. Appl. Microbiol. 1995;40:1-35.
CrossRef - Nagarajan P., Balachandar D.Influence of Rhizobium and organic amendments on nodulation and grain yield of black gram and green gram in acid soil. Madras Agric.J. 2001; 88:703-705.
- Shankaralingappa B.C, Brahmaprakash G.P Saifulla M. Impact of substitution of diammonium phosphate by mussoorie rock phosphate and phosphate solubilizing bacteria as a cheap source of P in pigeonpea.Curro Res. 2002; 31:156-158.
- Omar S.A. The role of rock phosphate solubilizing fungi and vesicular-arbuscularmycorrhiza (VAM) in growth of wheat plants fertilized with rock phosphate. World J Microbiol.Biotec. 1998;14(2):211-218.
- Jurinak J.J, Dudley L.M, Allen M.F, Knight W.G. The role of calcium oxalatein the availability of phosphorous in soils of semiarid regions:athermodynamicstudy. Soil Sci. 1986;142: 255-261.
CrossRef - Baqual M.F., Das P.K. Influence of biofertilizers on macronutrients uptake by the mulberry plant and its impact on silkworm bioassay. Caspian J.Env.sci. 2006;4:98-109.