Introduction
For many developing countries, grassland and rangeland vegetation comprise a large component of the feed that is potentially available for livestock use. Worldwide, rangelands occupy almost 50 percent of the terrestrial land cover, and provide almost 75 percent of the forage used by domestic livestock.1 Livestock production using grasslands and rangelands makes a significant contribution to the overall gross domestic product (GDP) in developing countries. There are large areas occupied by grasslands and rangelands; however, their remote locations and the diverse mix of livestock species grazing on these lands, quantification of vegetation biomass for feed inventories is a challenging intervention. With changing climate, increasing human population and changes in land use/land cover, a comprehensive quantification of livestock feed is needed at different level in order for countries to develop policies for maintaining or increasing livestock production. This information can also be used for feed and livestock Livestock ownership varies depending on the wealth status and the overall farm production objectives. In mixed farming system of the highlands and mid-altitudes of Ethiopia, where crop production is common; cattle are the most important livestock species for cultivation, threshing and manure.2 Gryseels and Goe (1984) also reported that most farmers in the central highlands of Ethiopia own two oxen, a cow, few sheep and a donkey. The common livestock feed resources are pasture and crop residue. Forage and agro-industrial byproducts contribute smaller amount of feed.3 Animals depend mainly on natural pastures for their feed requirements. Natural pastures, which provide more than 90% of the livestock feed, are generally poorly managed in Ethiopia. In the mixed farming mid-altitude areas, better soils are used for cropping. The main permanent natural pasturelands are found on the upper slopes of hills, and seasonally water logged areas. Due to poor management and overstocking, natural pastures are highly overgrazed and resulted in severe land degradation, loss of valuable species and dominance by unpalatable species.4 In this respect, Gummara-Rib watershed is not an exception and the same trend has been observed by where better lands are used for cultivation and marginal land left for grazing.
Grazing land production can be judged or assessed on the basis of the production of dry matter, milk or butter, live weight or carrying capacity. The net primary productivity (NPP) is defined as the net change in weight of grazing land between any two points in time, usually over a year. The NPP depends upon type of grazing land, climate, soil and management. The NPP has been estimated to be in the range of 10.65 to 19.68 t/ha/yr in 00-200 latitude and 7.43 to 9.0 t/ha/yr in 200-500 latitude (Pearson and Ison, 1987). Above ground, net production of 0.42 t/ha/yr to 13.77t/ha/yr has been reported (Christie, 1984). Maximum dry matter yield of tropical grasses may be as high as 85t/ha/yr with high fertilizer inputs and irrigation and a yearlong growing season in the humid tropics; though the potential is less than half that value in the monsoonal tropics or sub-tropics (Cooper, 1970). Dry matter production of 6- 7 t/ha/yr is easily obtained from improved and well-managed grazing land. Under ideal condition however dry matter production as high as 25t/ha/yr has been obtained.
In the lowland areas of Ethiopia native pasture yield one tonne DM/ha and in seasonally water logged fertile areas 4-6 t DM/ha .5 Forage crops must have particular features in order to warrant their inclusion in production system. These relate generally to production yield, seasonality of yield, usability or quality, as discussed by Wheeler (1986). Browse is characteristically important as a source of feed during dry and winter periods, when either the quantity or quality of available grass is deficient. To this effect, comprehensive survey of the types, quantity, quality, availability, alternative uses and relative costs of the different feed resources is important to identify the feed resources and to facilitate the decision making process in livestock feed resource development under smallholder conditions. The results provide firm understanding of the prevailing situation and enable specific interventions to be introduced. The generation of appropriate feed technologies, however, demands careful and integrated research activity planning. Understanding of the natural, socio-economic and farming system of the area is the first and crucial step to develop environmentally sound and socially acceptable livestock technologies.6 Diagnostic surveys play a key role in identifying constraints that can be addressed by research and in providing baseline information about the target farmers.
Previous studies of Gryseels and Anderson, (1983), Alemayehu, (1987), Zinash and Seyoum, (1991) indicated that a typical smallholder farm with 2.5 ha of land in the Ethiopian highlands of Ada Woreda produces a total of approximately 6 tonnes of DM from crop residues. For an average farm stock holding of 3.67 LU in this area if the daily feed requirement is 2.5 kg DM per 100 kg of live weight, annual feed requirement becomes 8.4 tonnes DM. This is less than 75% of the feed requirement for optimal growth and it is exacerbated by poor utilization efficiency. Zinash and Seyoum (1991) reported that 63% of cereal straws is utilized as feed for livestock, 20% is used for fuel, 10 and 7% are used, for house construction and bedding respectively, indicating that the major use of crop residues by smallholders in Ethiopia is as feed for livestock. Cereal crop residues are the most important feed resources for ruminants in developing countries.7 Farmers on the Ethiopian highlands have a tradition of conserving crop residues from teff (Eragrostis teff), barley, wheat and sorghum.8
Straws from teff, barley and wheat form the largest component of livestock diet in the mid and highland areas, while maize, sorghum and millet stover’s constitute larger proportion of livestock feed in lower to medium altitudes.4 Much has been said about the importance of crop residues as livestock feed by many authors. However, adequate information on the availability of crop residues in relation to their potential for feeding livestock in Ethiopia are limited.4 Similarly, Zinash and Seyoum (1991) have reported that in the survey conducted in the central high land the available feed resources (grazing and agricultural by- products) could only meet the maintenance requirements of the existing animals and production requirements of half of the total herds of cows for a production level of 5 liters of milk per day Wani et al., 2013)
Most of the research works on the assessment of feed resources in different parts of the country so far conducted only indicated the shortage of feeds without quantifying the amount of dry matter (DM) obtained in each feed resource type. This creates a great problem to recommend a possible solution to livestock producers particularly in the extreme drought seasons of Ethiopia. Therefore, it is imperative to assess the already existing feed resources in terms of quantity in relation to the requirements of livestock on annual basis so that it would be ather easy to suggest ways of improving the existing feed resources , introducing alternative feed and designing of development and policy interventions. However, studies are lacking on assessment of the impact of land use/land cover change on the community livelihoods (crop livestock mixed production) in Gummara-Rib watershed of Lake Tana sub basin. According to McCusker and Carr (2006), land use/land cover studies are still limited as related to livelihoods throughout the world. Regarding the study area, FSPCDPO (2008) recommended the need for carrying out detailed land use /land cover classification study for flood affected areas of Dera, Fogera, Libo Kemkem and the impact on the crop and livestock mixed production.
Thus, investigating specific and detailed land use /land cover and its impact on crop and livestock mixed production of the community for the Gummara-Rib watershed could be very important, to figure out the trend of change on pasture land and its impact on livestock feed resources of the community. Therefore, the study may serve as inputs for decision makers to formulate policy and legislation. In addition, it could be used as a source of information to initiate further researches related to wetland ecosystems, land use/land cover change in the context of livelihoods, and sustainability of Lake Tana sub basin residents. The overall objectives were to address the grazing land use change and livestock feed balance in Gummara-Rib watershed.
Study Area Descriptions
Ethiopia has a total area of about 1.1 million square kilometers and is divided into 12 river basins. These basins differ widely in size and in their potential as water resources. Tana sub-basin is one the development corridors found in the upper course of the Blue Nile basin in Ethiopia. The sub-basin has a total area of 1,589,654.98 ha. Physiographically, Tana sub-basin comprises three main watersheds, namely Megech-Seraba (352,522.93ha), Gumara-rib (471,236.18ha), and Gilgel Abay (453,618.53 ha). For this study, Gumara-Rib watershed is selected considering the existence of varied agro climatic zones of the Lake Tana sub basins where the majority of the population are dependent on rain fed agriculture and predominantly practice mixed farming (production of crops and livestock husbandry (Figure 1). Despite the presence of significant potential, there is currently very little irrigated agriculture in the basin. The major types of land cover include farm land, water bodies, forest, wood land, shrubs, rangeland, grass land, settlements.
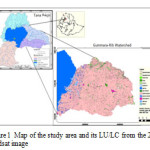 |
Figure 1: Map of the study area and its LU/LC from the 2013 Landsat image. |
Methodology
The land use land cover change of the study area was assessed by using two different period of landsat images (1985 and 2013). We have used landsat image types as indicated in Table 1. The images were analyzed to figure out the grazing lands using Environment for Visualizing Images (ENVI) and Arc GIS software.
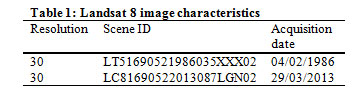 |
Table 1: Landsat 8 image characteristics. |
The feed balance was calculated using the tropical livestock unit (TLU) factor from four districts based on the areal coverage within the Gummara-Rib watershed. Whereas, the existence grazing land use change found from the satellite data from the year 1986 and 2013. Using both current area of grazing land and the tropical livestock unit,the annual requirement of dry matter for the watershed in the Lake Tana sub-basin was estimated. The feed balance was calculated
using XLSTAT and TLU conversion factor by the following Statistical Models.
Xijk = Cj + Gk + Eijk+μ,……………………………….(1)
Where
Xijk = the dry matter yield obtained by the household from grazing land
Cj = the effect of jth household grazing land size, j = 1, 2…
Gk = the effect of kth household size in tropical livestock unit (TLU), k = 1, 2…
Eijk = the random error
μ = over all mean
Yijk = Hj + Ik + Eijk +μ ………………………………….(2)
Where
Yijk = dry matter content obtained from crop residues production of the household
Hj = the effect of jth household oxen holding in tropical livestock unit (TLU), j = 1, 2…
Ik = the effect of kth household fertilizer use in tonnes per annum, k = 1, 2…114
Eijk = the random error
μ = over all mean
Zijk = Jj + Kk+ Eijk +μ, ..,…………………………….. (3)
Where
Zijk = total dry matter yield obtained from aftermath of the household
Jj = the effect of jth household cropped land total
Kk = the effect of kth each crop area in hectare
Eij = the random error
μ = over all mean
The sum total of equations 1, 2 and 3 resulted in the total DM requirement for livestock existence and maintenance in Gummara-Rib watershed. The total livestock population was standardized using conversion factors and changed in to tropical livestock unit. The current productivity of the livestock feed was assessed using the total grazing land (grassland, forestland, wetland and alpine), the crop residues, and crop aftermath by their respective conversion factors. The value difference was taken as the feed balance of the study area.
Results and Discussions
The land use land cover map analysis of the landsat image in the Gummara-Rib watershed showed that the area of grazing land (grassland, forestland, wetland and alpine) was 84,525 ha whereas the current status of grazing land cover is in the order of 55377 ha. This figure indicates that there was a change of 29148 ha of grazing land to cultivated land including settlement and urban expansion (Table 2).
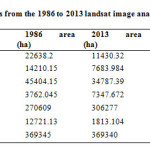 |
Table 2: Grazing Land dynamics from the 1986 to 2013 landsat image analysis. |
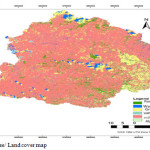 |
Figure 2: 1986 Land use/ Land cover map. |
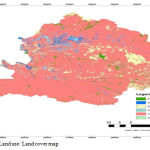 |
Figure 3: 2013 Land use/ Land cover map. |
Feed balance analysis was carried out to estimate the proportion of feed that pasturelands, crop residues and crop aftermaths can provide to the total annual dry matter required for livestock maintenance. The amount of annual feed available was calculated based on satellite image analysis on the coverage of pasture (grazing/browsing) lands and other feed sources available in the watershed. Both degraded and productive grass lands, shrub lands and seasonal wetlands, etc., were considered for the analysis. The total land available as a natural feed/forage source in the watershed was estimated at 361655.5 ha (Table 3). From these forage sources it is possible to produce 100,706.17 tons of DM per year. On the other hand, crop residues and aftermaths are also important source of feed. From these resource, it is possible to produce 579068.54 and 172925.59 tons of DM from crop residues and aftermath, respectively.
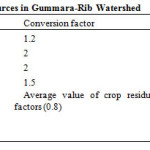 |
Table 3: Potential livestock feed sources in Gummara-Rib Watershed. |
Source: Fekade Feyisa, 2007. Grazing Land Management, Forage Production and Utilization Methods: Ethiopian Livestock Production Professionals Association.
Based on the Kossila, (1984) and FAO, (1987) the conversion of grazing land to other type of landuse type drastically decreases the livestock feed resources. The conversion factor for grassland is highest as compared to the rest feed sources (Table 4).
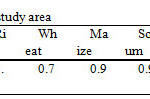 |
Table 4: Crop residue conversion factor in the study area. |
Sources: Kossila, 1984 and FAO, 1987
The total livestock population of the study area was obtained from the regional statistical agency (Table 5). Dera and Fogera districts are completely found within the watershed, whereas, few administrative kebeles from Libokemkem and Farta districts are not included. This can be compensated by the kebeles which are found in the watershed in East and West Estie districts.
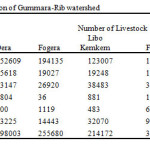 |
Table 5: Livestock population of Gummara-Rib watershed. |
Sources : CSA, 2010
For the sake of convenience and uniformity, the different livestock populations were change in to toropical livestock unit (TLU) by multiplying it with the conversion factors (Table 6). Cattle and mule have the largest conversion factor and the TLU value of cattle was found to be the largest (445079.60). This is because, cattle in Lake Tana sub-basin is an important and integral component of the agricultural sector supplying draft power for cultivation and food and income to the households, including insurance against risks. Feed requirement was calculated considering the average number of livestock per household and total household population in the watershed.
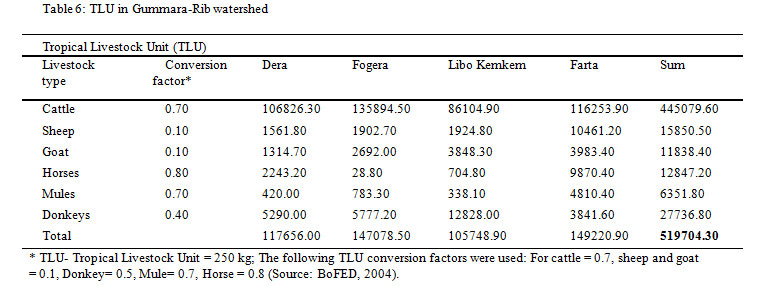 |
Table 6: TLU in Gummara-Rib watershed. |
The total number of livestock in the watershed was estimated to be 519704.3 TLU, indicating a stocking density of 9.4 TLU/ha of pastureland. Assuming that DM requirement for maintenance is about 6.25 kg/day/TLU or 2.28 tones/year/TLU, the total DM requirement was estimated in the order of 1,184,926 tones/year. This shows that the available feed/forage sources addresses only 72% of the annual DM requirement. (Table 7). To fill the gap, some farmers use concentrates like oil cake and byproducts of local alcoholic drinks. Others use locally available forage trees and homestead grown forage trees and shrubs. Many farmers have also started feeding their livestock through cut-and-carry system by using grasses from protected dense bushes/forests. The TLU per household head in Gummara-Rib watershed was calculated to be 2.91 which is less than the total Tana sub basin 5.11(TCS, 2013). This implies that as the grazing land decreased, TLU also decreased. On the other hand, agricultural density is becoming higher in the watershed which creates extra pressure on the environment.
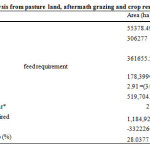 |
Table 7: Feed balance analysis from pasture land, aftermath grazing and crop residues. |
Feed balance analysis was carried out to estimate the proportion of feed that pasturelands, crop residues and crop aftermaths can provide to the total annual dry matter required for livestock maintenance. The amount of annual feed available was calculated based on satellite image analysis on the coverage of pasture (grazing/browsing) lands and other feed sources available in the watershed. Both degraded and productive grass lands, shrub lands and seasonal wetlands, etc., were considered for the analysis. The total land available as a natural feed/forage source in the watershed was estimated at 361655.5 ha (Table 3). From these forage sources it is possible to produce 100,706.17tons of DM per year. On the other hand, crop residues and aftermaths are also important source of feed. From these resource, it is possible to produce 579068.54 and 172925.59 tons of DM from crop residues and aftermath, respectively.
Conclusion
The agricultural sector in Ethiopia is the driving force for economic growth and transformation of the country’s economy. This is because agriculture has meaningful contributions to achieve food security, create job opportunity and reducing poverty at the national, regional and household levels. In this regard, livestock production could be considered as one of the strategic economic concerns since the majority of the rural people keep livestock as a means of livelihood or to use livestock as inputs for various activities like crop production. The livestock sub-sector in Lake Tana sub-basin is an important and integral component of the agricultural sector supplying draft power for cultivation and food and income to the households, including insurance against risks. In mixed farming system, livestock produce meat, milk, honey, egg and butter, which supply the required animal protein that contribute to improvement of the nutritional status of the people. In addition, animals provide power for threshing and transportation of agricultural products. Furthermore, livestock produce manure that is used to improve soil fertility and serves as a source of domestic energy. However, the livestock feed sources are becoming declining due to the excessive conversion of grazing lands in to cultivated land and settlement areas. Therefore, grazing land degradation should be given attention for the sustainable and healthy livestock productivity. The overall livestock productivity is a function of high human and animal population which in turn results in shortage of pasture land. Moreover, most of the communal grazing/browsing lands are degraded lands providing only limited feed. In general, feed shortage and poor performance of local breed affects productivity of livestock. In Gummara-Rib watershed, the concerned body should take measures that could enhance improved feeding management techniques such as rotational grazing for extended pasture lands in the highlands, forage development, fodder conservation, feeding fresh forage using the cut-and-carry method, and regulating the intake by different categories of stock to fill the gaps livestock feed. Moreover, the carrying capacity of the pasture land and stocking density needs to be balanced.
References
- Brown, J. R. & Thorpe, J. 2008. Climate change and rangelands: Responding rationally to uncertainty. Rangelands, 30(3): 3–6..
CrossRef - Getachew Asamenew, Haile Beyene, Werkneh Nigatu and Gezahegn Ayele, 1993. A survey of farming systems of vertisol areas of the Ethiopian highlands. In: Tekalign Mamo, Abiye Astatke, K.L. Srivastra and Asgelil Dibabe (eds.) Improved management of vertisols for sustainable crop-livestock production in the Ethiopian highlands. Synthesis Report 1986-92. Technical committee of the joint vertisol project, Addis Ababa, Ethiopia. p. 29-49.
- Alemayehu Mengistu, 2006. Range Management for East Africa: Concepts and Practices, Sponsored by RPSUD and Printed by A.A.U Printed Press. Addis Ababa, EthiopiaB. Smith, “An approach to graphs of linear forms (Unpublished work style),” unpublished.
- Alemayehu Mengistu, 1985. Feed resource in Ethiopia. pp 35. Proceedings of the second PANESA Workshop on Animal Feed Resources for Small Scale Livestock Producers. Nairobi, Kenya, 11-15 November 1985.
- J. Wang, “Fundamentals of erbium-doped fiber amplifiers arrays (Periodical style—Submitted for publication),” IEEE J. Quantum Electron., submitted for publication.
- Amir, P. and Knipscheer, H.C., 1987. A conceptual frame work for the economic analysis of on-farm trials with small ruminanats.In: Devendra C. (ed), Smallruminant production systems in south and southeast Asia.Proceedings of a workshop held in Bogor, Indonesia, 6-10 October 1986.IDRC (International Development Research Centre), Ottawa, Canada.pp.308-391.
- Reed, J.D., 1985. Evaluation of crop residues. Influence of species variety and environment on nutritive value.ILCA, Addis Ababa, Ethiopia.
- Reed, J .D and Goe, M .R. 1989. Estimating the nutritive value of crop residues: Implications for developing feeding standards for draught animals.ILCA Bulletin 34:2- 9.ILCA (International Livestock Centre for Africa), Addis Ababa, Ethiopia.
- Wani S. A, Chand S, Najar G. R, Teli M. A. Organic farming: as a Climate Change Adaptation and Mitigation Strategy. Curr Agri Res 2013;1(1):45-50. Available from: http://www.agriculturejournal.org/?p=510