Introduction
Flax (Linum usitatissimum L., 2n = 30), designated as fibre flax or linseed, is an annual herb and also a self-pollinated crop species, which is grown commercially for its stem fibre and seed oil since time bygone.1,2 It is the abundant and the most reasonable source of α-linolenic acid (ALA), an indispensable fatty acid of the ω-3 class. The oil derived from the seeds (40–45%) is used for a variety of industrial objectives like as, linoleum, paint, varnish, printer ink and soap. The flax fibres have enormous tensile strength, staple length, durability and fineness. The fibres are utilized for the fabrication of linen cloth and threads, and also to carve canvas, strong twine, carpets, fishing nets and seine lines, cigarette paper, writing paper and as insulating materials. In Recent years, flax varieties with low linolenic acid content have been developed for human intake.3,4 The total world production of fibre flax and tows is 3.03 lakh tonne and for linseed it is 2.30 lakh tonne.5 Canada is the leading linseed producing country and others are China Mainland, Russian Federation, Kazakhstan and India. In case of fibre flax and tows the premier country is France followed by Belgium, Belarus, Russian Federation and China Mainland. In India, linseed is cultivated on about 4.68 lakh hectares (ha) and the total linseed production is 1.63 lakh tonne with 349 kg/ha productivity.6 Madhya Pradesh, Uttar Pradesh, Chhattisgarh, Maharashtra, Bihar and Orissa are the major linseed producing states in India. It is grown to a meagre extent in Jharkhand, Karnataka, Assam, Rajasthan, West Bengal, and Himachal Pradesh.7 Decisive agronomical traits such as oil content and fibre quality are complex and polygenic in nature and are controlled by several quantitative trait loci (QTL). There are distinct ways to assess flax genetic variation such as morphological markers8, 9, 10,11,12, isozymes/biochemical markers13,14,15 and molecular markers.16,17,18,19,20,21,22,23 Morphological characters are amenable to possess more quantitative and environmentally dependent while isozymes are finite in numbers. Molecular markers have considerable characteristic advantages as they are bountiful, environment insensitive and non-tissue specific. They are also preeminent for variety identification and interpretation of DNA variation. Various molecular markers: Random Amplified Polymorphic DNA (RAPD), Restriction Fragment Length Polymorphism (RFLP), Amplified Fragment Length Polymorphism (AFLP) and Simple Sequence Repeat (SSR) have been developed and advanced to assess flax genetic diversity.24,25 However, their figures in each of these studies were narrow and limited. Microsatellites or Simple Sequence Repeats (SSRs) comprise of tandemly repeated short motifs of 2–6 nucleotides. SSR markers are characterized by the amplification size polymorphism developed when lines have variable numbers of these short tandem repeats in a distinct locus. The abundance, allocation, reproducibility and generally co-dominant essence of SSR markers make them highly advisable for linkage mapping and genetic diversity studies. 26,27 The objectives of the present research were assessment of the genetic diversity in flax varieties at molecular level and selection of most diverse genotypes for future breeding program.
Materials and Methods
The plant material comprised of 27 flax varieties collected from Chaudhary Sarwan Kumar Himachal Pradesh Krishi Visvavidyalaya (CSKHPKV), Palampur, Himachal Pradesh, India (Table 1). DNA was extracted from germinated seedlings using CTAB method28 with certain modifications. The PCR amplification was carried out (Eppendorf Mastercycler, Germany). A total number of 10 SSR markers were used for PCR amplification. Each SSR reaction mixture (20 μl) composed of 13.5 μl nuclease free water (Invitrogen), 2.0 μl 10x PCR buffer (Invitrogen), 1.1 μl MgCl2, 0.4μl dNTPs (Invitrogen), 0.8 μl primer: 0.4μl (Forward) + 0.4μl (Reverse) (Xceleris Labs), 0.2 μl Taq DNA Polymerase (2.5U) (Invitrogen), 2.0 μl DNA Sample (50ng). Cycling condition used for amplification were as follows; 94˚ C: 5 min (Initial denaturation), 94˚ C: 1min (Denaturation), Annealing temperature specific for a particular primer pair: 1min (Annealing), 72˚ C: 1min (Elongation), 72˚ C: 8min (Final elongation), 4˚ C: Hold (infinite) followed by 30 cycles. The PCR products were separated by vertical electrophoresis system (Genei) in a 10% denaturing polyacrylamide gel (Figure 1). To determine the most informative primer, following parameters were calculated: Polymorphism Percentage (PP), Polymorphic Information Content (PIC), Resolving Power (RP), Mean Resolving Power (RP̅), Marker Index (MI), Shannon’s Diversity Index (H) and Simpson Diversity Index (D). Dendrograms were constructed using the genetic similarity coefficients using Unweighted Pair Group Method for Arithmetic Average (UPGMA) following the Sequential Agglomerative Hierrarchial Network (SAHN) algorithm.29 All calculations were performed using NTSYSpc version 2.02.30 Principal Co-ordinate Analysis was also performed in support (DARWIN).31
Results and Discussions
Microsatellite/SSR Markers Selections and Characterization
The 10 primer pairs identified by Pali32 for Indian flax were amplified on the 27 flax accessions including 11 Indian collections and 16 exotic collections. The 10 polymorphic loci identified between 2 and 7 alleles with an average of 4.1 alleles per locus in 27 flax accessions. The 10 SSR loci amplified a total of 41 alleles that were used for genetic analysis. The total number of alleles and size of SSR markers varied from the ones originally reported, indicating that the source of the material tested differed from that of the previously characterized collections.32 Moreover, seven microsatellite markers (LU6, LU10, LU5, LU1, LU7, LU9 and LU8) had PIC values greater than 0.50, which was consistent with the results found for some of these loci.32 The LU6 marker was highly polymorphic and had a high PIC value of 0.95 (Table 2). The estimates of RP̅ were found to be the highest for the primer LU1 (0.68) followed by LU7 (0.64) and was lowest for the primer LU3 (0.19). The maximum MI was observed for the primer LU10 (3.56) followed by the LU1 (3.08) and LU5 (2.64). The minimum MI was observed for the primer LU2 (0.28). The Shannon’s Diversity Index (H) and Simpson Diversity Index (D) ranged from 0.26 to 1.78 and 0.36 to 5.40 with average 1.04 and 1.43, respectively. These two diversity index are the measure of locus diversity in a given plant population and it also shows population composition and takes into account the relative abundance of loci that are present in the population. Further relationship between efficiency parameters was studied using Spearman Rank Correlation. PIC and MI showed high magnitude of correlation with other parameters. This indicates that PIC and MI were most important parameters in assessing the efficiency of whole set of 10 SSR primers. However, the Simpson Diversity Index (D) showed a low magnitude of correlation with other parameters. This result implied that D is the less important parameter in determining the efficiency of SSR markers (Table 3).
Table 1: Twenty seven flax varieties along with their origin, pedigree and type.
| Sl.No. | Accession Name | Origin | Pedigree | Type |
|
1 |
Nagarkot | Himachal Pradesh | New River × LC-216 | Dual Purpose |
|
2 |
Himalini | Himachal Pradesh | K-2 × Kangra Local | |
|
3 |
Janaki | Himachal Pradesh | New River × LC-216 | |
|
4 |
Jeevan | Himachal Pradesh | Sumit × LC-216 | Dual Purpose |
|
5 |
Surabhi | Himachal Pradesh | LC-216 × LC-185 | Seed Type |
|
6 |
Him –Alsi-1 | Himachal Pradesh | K-2 ×TLP-1 | Seed Type |
|
7 |
Him-Alsi-2 | Himachal Pradesh | EC-21741 × LC-216 | Dual Purpose |
|
8 |
Binwa | Delhi | Flak-1 ×SPS47/7-10-3 | Seed Type |
|
9 |
Baner | Delhi | EC-21741 × LC-214 | Seed Type |
|
10 |
Bhagsu | Himachal Pradesh | RL-50-3 × Surabhi | Seed Type |
|
11 |
Himani | Chhattisgarh | DPL-20 × KLS-1 | Seed Type |
|
12 |
Hermes | France | Fany × (Natasja X T10) | Fibre Type |
|
13 |
Natasja | Netherland (Europe) | Wiera × Mapun | Fibre Type |
|
14 |
Viking | Netherland | Fibre Type | |
|
15 |
Regina | Netherland | Reina × (Reina X Fibra) | Fibre Type |
|
16 |
Mariena | Netherland | C.L.975 × Sheyenne | Fibre Type |
|
17 |
Ariane | France | Exotic Collection | Fibre Type |
|
18 |
Giza-5 | Egypt | Exotic Collection | Fibre Type |
|
19 |
Giza-6 | Egypt | Hindi × Giza-4 | Dual Purpose |
|
20 |
Giza-7 | Egypt | Exotic Collection | Fibre Type |
|
21 |
Giza-8 | Egypt | Giza-6 × Santa Catalina | Dual Purpose |
|
22 |
Faiking | Selection From Exotic Flax Material | ||
|
23 |
Ayogi | Germany | ||
|
24 |
Flak-1 | Selection From Exotic Flax Material | Fibre Type | |
|
25 |
Canada | Canada | ||
|
26 |
B-509 | Selection From Exotic Flax Material | ||
|
27 |
Belinka-60 | Netherland | LC-216 × LC-185 | Fibre Type |
Table 2: Information on band polymorphism by the ten microsatellite markers.
| Primer | Allele Size (Bp) | NTB | NPB | PP | PIC | RP | RP̅ | H | D | MI |
| LU1 | 150-400 |
5 |
4 |
80.0 |
0.77 |
3.44 |
0.68 |
1.51 |
0.91 |
3.08 |
| LU2 | 175-200 |
2 |
1 |
50.0 |
0.28 |
0.68 |
0.34 |
0.28 |
0.7 |
0.28 |
| LU3 | 150-275 |
4 |
1 |
25.0 |
0.49 |
0.76 |
0.19 |
0.52 |
0.49 |
0.49 |
| LU4 | 175-200 |
2 |
1 |
50.0 |
0.26 |
0.6 |
0.3 |
0.26 |
0.68 |
0.26 |
| LU5 | 150-500 |
5 |
3 |
60.0 |
0.88 |
2.47 |
0.49 |
1.51 |
1.8 |
2.64 |
| LU6 | 150-500 |
4 |
2 |
50.0 |
0.95 |
1.44 |
0.36 |
1.05 |
5.4 |
1.9 |
| LU7 | 125-175 |
3 |
2 |
66.6 |
0.7 |
1.94 |
0.64 |
0.93 |
1.13 |
1.4 |
| LU8 | 100-300 |
5 |
3 |
60.0 |
0.58 |
2.47 |
0.49 |
1.24 |
0.48 |
1.74 |
| LU9 | 100-400 |
7 |
4 |
57.1 |
0.6 |
3.81 |
0.54 |
1.78 |
0.36 |
2.4 |
| LU10 | 100-300 |
4 |
4 |
100.0 |
0.89 |
2.32 |
0.58 |
1.34 |
2.38 |
3.56 |
Genetic diversity among flax accessions
The UPGMA analysis resulted in three distinct clades with Himani forming its own clade (Figure 2A). The first clade was made up of Nagarkot, Himalini, Surabhi, Jeevan, Him-Alsi-1, Janaki, Giza-6, Giza-5, Him-Alsi-2, Binwa, Regina, Baner, B-509, Belinka-60, Mariena, Ariane and Bhagsu. This first clade is related to the second clade, which was made up of Hermis, Natasja, Viking, Giza-7, Canada, Giza-8, Faiking, Ayogi and Flak-1. This is also not surprising since most of these cultivars were developed by the breeding program at Chaudhary Sarwan Kumar Himachal Pradesh Krishi Visvavidyalaya and could have shared similar germplasm sources. Considerably most of the clusters were not remarked to consist of all genotypes aggregated from a specific collection area, illustrating the absence of correlation between the genotypes and their respective geographical origin. It was evident from the cluster that the genotypes Himani collected from Himachal Pradesh and Janaki collected from Chhattisgarh were most distantly related to the remaining genotypes followed by Baner and Binwa collected from Delhi. The study reveals that range of genetic diversity was tremendous among genotypes accommodating in these three major clusters and cross hybridizing between them may augment genetic variation in the breeding population. Complementary results were also addressed in the diversity studies of flax genotypes.33 The science of genetic variation is useful for selection of parents for breeding programs.
Table 3: Relationship between efficiency parameters using Spearman rank correlation.
| Parameters | PIC | RP̅ | H | D | MI |
| PIC | 1.00 | 0.53 | 0.61 | 0.76 | 0.82 |
| RP¯ | 1.00 | 0.62 | 0.21 | 0.70 | |
| H | 1.00 | 0.04 | 0.87 | ||
| D | 1.00 | 0.41 | |||
| MI | 1.00 |
Principal Co-ordinate Analysis
The principal co- ordinate analysis provides an alternative view of the genetic distances among flax cultivars compared to the UPGMA dendrogram (Figure 2B). The first four eigen vectors accounted for 47.15% of the variation. The PCo-A graph corresponded very well to the UPGMA cluster analysis. The similarity between these two analyses supports the genetic diversity results observed in this study.
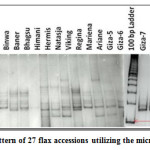 |
Figure 1: Banding pattern of 27 flax accessions utilizing the microsatellite marker LU1. Click here to View figure |
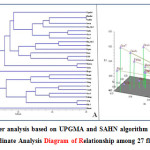 |
Figure 2: (A) Cluster analysis based on UPGMA and SAHN algorithm for 27 flax varieties (B) Principal Co-ordinate Analysis Diagram of Relationship among 27 flax varieties. Click here to View figure |
Cluster analysis based on genetic similarity values provided a clear resolution of relationships among all the 27 flax genotypes. UPGMA analysis of SSR marker variation corresponded well to the breeding histories for the cultivars evaluated with a few exceptions. These results indicate that SSR markers were effective in distinguishing flax genotypes. Moreover, SSR markers were useful in discriminating proximately related germplasm sources and may serve as an additive in morphological and agronomic data utilized for protection of plant variety and identification of cultivar. In both the UPGMA dendrogram and the PCo-A analysis of 27 flax accessions showed a high similarity between Himalini and Surabhi, two of the cultivars belonging to cluster I. Interestingly, the cultivar Flak-1 and Himani showed maximum dissimilarity (68%) followed by the Himani and Giza-7 (61%) and then Ariane and Ayogi (56%). The results of this study have an important practical application for selection of cultivars to future breeding program. The findings from the study conclude that the genetic diversity in Flax was revealed at molecular level. The markers utilized in the study can serve as efficient, stable and reliable marker system. As a future strategy for research further DUS testing and morphological characterization is needed for better insight.
Acknowledgements
We must render our sense of gratitude to the Crop Improvement Division, Central Research Institute for Jute and Allied Fibres (ICAR-CRIJAF), Barrackpore, West Bengal, India, for availing the laboratory facility and providing the essentials required for the successful accomplishment of the present research study.
References
- Dillman A.C. Classification of flax varieties, In: Technical Bulletin No. 1054, United States Department of Agriculture, Washington. 1946.
- Zohary D. Monophyletic vs. polyphyletic origin of the crops on which agriculture was founded in the Near East. Genet.Resour. Crop Evol. 1999;46:133–142.
CrossRef - Dribnenki J.C.P, Green A.G. Linola TM ´947` low linolenic acid flax. Can. J. Plant Sci. 1995;75:201–202.
CrossRef - Dribnenki J.C.P, McEachern, S.F, Green AG, Kenaschuk E.O, Rashid K.Y. LinolaTM ´1084` low linolenic acid flax. Can. J. Plant Sci. 1999;79:607–609.
CrossRef - FAO, The state of Food and Agriculture, Food and Agriculture Organization of the United Nations, Rome, Italy. 2013.
- FAO, The state of Food and Agriculture, Food and Agriculture Organization of the United Nations, Rome, Italy. 2007-2008.
- Nag S, Mitra J, Karmakar P.G. An Overview on Flax (Linum usitatissimum L.) and its Genetic Diversity. IJAEB. 2015;8(4):805-817.
- Diederichsen A, Hammer K. Variation of cultivated flax (Linum usitatissimum L. subsp. usitatissimum) and its wild progenitor pale flax (subsp. angustifolium (Huds.) Thell.). Genet.Resour. Crop Evol. 1995;42:262–272.
CrossRef - Diederichsen A. Comparison of genetic diversity of flax (Linum usitatissimum L.) between Canadian cultivars and a world collection. Plant Breeding. 2001;120(4):360-362.
CrossRef - Diederichsen A, Fu Y.B. Phenotypic and molecular (RAPD) differentiation of four infraspecific groups of cultivated flax (Linum usitatissimum L. subsp. usitatissimum. Genet.Resour. Crop Evol. 2006 a.;5377–90:.
- Diederichsen A, Raney J.P. Seed colour, seed weight and seed oil content in Linum usitatissimum accessions held by Plant Gene Resources of Canada. Plant Breeding. 2006;1254):372-377.
CrossRef - Saeidi G. Genetic variation and heritability for germination, seed vigour and field emergence in brown and yellow-seeded genotypes of flax. Int J Plant Prod. 2008;2008;2:15–22.
- Tyson H, Fieldes M.A, Cheung C, Starobin C. Isozyme relative mobility (Rm) changes related to leaf position; apparently smooth Rm trends & some implications. Biochem.Genet. 1985;23:643-654.
- German N.B, Cullis C.A, Aldrige N. Genetic and Linkage analysis of isozyme polymorphism in flax. J. of Heredity. 1993;84:73-78.
- Krulickova K, Posvec Z, Griga M. Identification of flax and linseed cultivars by isozyme markers. Biol Plant. 2002;45(3):327–336.
CrossRef - Spielmeyer W, Green A.G, Bittisnich D, Mendham N, Lagudah E.S. Identification of quantitative trait loci contributing to Fusarium wilt resistance on an AFLP linkage map of flax (Linum usitatissimum) TheorAppl Genet. 1998;97:633–641.
CrossRef - Oh T.J, Gorman M, Cullis C.A. RFLP and RAPD mapping in flax (Linum usitatissimum) TheorAppl Genet. 2000;101590–593.
CrossRef - Everaert I, Riek D.J, Loose D, Waes M.V.J, Bockstaele V.E. Most similar variety grouping for distinctness evaluation of flax and linseed (Linum usitatissimum L.) varieties by means of AFLP and morphological data. Plant Var Seed. 2001;14: 69–87.
- Fu Y.B, Peterson G, Diederichsen A, Richards K.W. RAPD analysis of genetic relationships of seven flax species in the genus Linum L. Genet Resour Crop Environ. 2002;49:253-259.
CrossRef - Fu Y.B, Rowland G.G, Duguid S.D, Richards K.W. RAPD analysis of 54 North American flax cultivars. Crop Sci. 2003a;43:1510-1515.
- Fu Y.B, Guerin S, Peterson G.W, Diederichsen A, Rowland G.G, Richards K.W. RAPD analysis of genetic variability of regenerated seeds in the Canadian flax cultivar CDC Normandy. Seed Sci. Technol. 2003b;31:207-211.
CrossRef - McBreen K, Lockhart P.J, McLenachan P.A, Scheele S, Robertson A.W. The use of molecular techniques to resolve relationships among traditional weaving cultivars of Phormium. N Zeal. J. Bot. 2003;1(2):301-310.
- Adugna W, Labuschagne M.T, Viljoen C.D. The use of morphological and AFLP markers in diversity analysis of linseed. Biodiversity and Conserv. 2006;5;3193–3205.
CrossRef - Roose Amsaleg C, Cariou Pham E, Vautrin D, Tavernier R, Solignac M. Polymorphic microsatellite loci in Linum usitatissimum. Mol. Ecol. Notes. 2006;6:796-799.
CrossRef - Cloutier, S., Niu, Z., Datla, R., Duguid, S. Development and analysis of EST-SSRs for flax (Linum usitatissimum L.). Theor Appl Genet. 2009;119:53–63.
CrossRef - Wiesner I, Wiesnerova D, Tejklova E. Effect of anchor and core sequence in microsatellite primers on flax fingerprinting patterns. J Agric Sci. 2001;137:37–44.
CrossRef - Soto-Cerda B.J, Carrasco R.A, Aravena G.A, Urbina H.A, Navarro C.S. novel polymorphic microsatellites from cultivated flax (Linum usitatissimum L.) following data mining. Plant Mol.Biol. Rep. 2011;29:753–759.
CrossRef - Doyle J.J, Doyle J.L. Isolation of plant DNA from fresh tissue. Focus. 1990;12:13–15.
- Sneath P.H.A, Sokal R.R. Numerical taxonomy: the principles and practice of numerical classification. San Francisco: Freeman. 1973;573.
- Rohlf F.J. NTSYS‑Pc. Numerical taxonomy and multivariate analysis system. Version 2.1.Setauket. Exeter Software. 2000;44.
- Perrier X, Jacquemoud-collet J.P. DARwin software. 2006.
- Pali V, Verma S.K, Xalxo M.S, Saxena R.R, Mehta N, Verulkar S.B. Identification of microsatellite markers for fingerprinting popular Indian flax (Linum usitatissimum L.) cultivars and their utilization in seed genetic purity assessments. AJCS. 2014;(1):119-126.
- Habibollahi H, Noormohammadi Z, Sheidai M, Farahani F. SSR and EST-SSR-based population genetic structure of Linum L. (Linaceae) species in Iran. Genet Resour Crop Evol. 2015;online: doi:10.1007/s10722-015-0306-7.
CrossRef