Introduction
The significance of a life supporting system in any region lies within the effective land use to give distributional patterns of crops. The rising food prices in the international market, progressive conversion of good lands to grow bio fuel crops, industrial and other non-agricultural uses demand effective soil resource management to ensure productivity, profitability and national food security.1 For sustainable use of soil resources, a detailed inventory is necessary to strengthen the sustainable development of a region. To achieve soil resource management in agro ecological regions, knowledge on morphological, physical and chemical characteristics and classification is an essential requirement. District Pulwama is a major part of Kashmir valley, India with respect to agricultural perspective2 and pertinent information about the arable soils is unavailable3 and hence the present investigation was carried out.
Materials and Methods
District Pulwama falls between 33o 46’ N to 33o 52’ N latitude and 74o 45’ to 75o 35’ longitude with a mean elevation of 1630 m amsl. The entire area is characterized by sub-humid temperate climate with a mean annual temperature of 14oC. The moisture and temperature regimes of the area are Udic and mesic, respectively. The natural vegetation of the area consists of trees like Salix spp., Populous spp., Planetarium orientalis, Roubinea spp. etc. The hill ranges are covered with forests and dominant species are Pinus sylvestris, Pinus walichiana, Cedrus deodara, Abies pindrow and Picea smitheana. The district is rich in horticulture and agriculture4 and the main crops include paddy, fodder, saffron (Croccus sativus), apple (Malus spp.) and condiments.
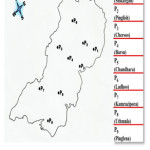 |
Figure 1: Profile Sites selected in District Pulwama. Click here to View figure |
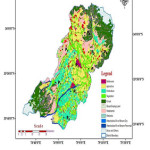 |
Figure 2: LISS III image of District Pulwama. Click here to View figure |
After a general traversing of the study area nine representative profiles were selected for study (Fig-1). Landforms were delineated on the basis of image interpretation of Resourcesat-1 LISS-III data and ground truth study i.e. geology, drainage pattern, surface features, slope characteristics and present land use (Fig-2). The reconnaissance survey was carried out in 1:50,000 scale using Survey of India toposheet as a base map of the same scale. The soil site description was made following the standard proforma of soil site description of NBSS&LUP soil bulletin no. 235. The detailed morphological description of these nine profiles was studied in the fields as per the guidelines in Field guide for Soil Survey.6 The soil samples collected from different horizons were air dried and grounded in a wooden pestle and mortar. Ambient soil was passed through 2 mm sieve and then subjected to various physical and chemical analysis. The particle size analysis was carried out by international pipette method7 using sodium-hexametaphosphate as a dispersing agent. The textural class was determined using the USDA textural triangle. Soil reaction (1:2.5 soil and water suspension) was determined by pH meter8 and electrical conductivity (EC) of soil water extract was determined with the help of conductivity bridge.9 Organic carbon (OC) was determined by chromic acid wet digestion method.10 Estimation of calcium carbonate was done by rapid titration method.7 Cation exchange capacity (CEC) was determined by Schollenberger and Simon (1945)11 method of leaching the soil with neutral normal ammonium acetate. The exchangeable cations were extracted with neutral normal ammonium acetate. Potassium (K) and sodium (Na) were determined by flame photometer while, calcium (Ca) and magnesium (Mg) were determined by atomic absorption spectrophotometer procedure.12 Bulk density (BD) and particle density (PD) were determined by Core sampler13 and Pycnometer method,14 respectively.
Table 1: Site characteristics of arable soils of district Pulwama.
|
Profile |
Latitude and Longitude |
Altitude (m amsl) |
Topography (Land form type) |
Slope (%) |
Erosion |
Drainage |
Depth of ground water (m) |
Natural vegetation |
Present land use |
|
P1 (Shikargah) |
33o 53.657’ N 75o 08.209’ E |
1800 |
Undulating Hill slope |
3-8 |
Slight |
well drained |
>10 |
Pinus, Ulmus, Populus, Salix, Ciderus |
Cultivated single crop (Apple) |
|
P2 (Pinglish) |
33o 55.345’ N 75o 07.603’ E |
1717 |
Level Plain Inland Valley |
0-1 |
Very slow |
Moderately well drained |
5-10 |
Ulmus, Populus, Salix |
Cultivated double crop (Kharif – Paddy) (Rabi- Mustard) |
|
P3 (Chersoo) |
33o 54.121’ N 75o 01.603’ E |
1605 |
Level Plain Inland Valley |
0-1 |
No erosion |
Somewhat poorly drained |
1-2 |
Populus, Salix, Plantarinum |
Cultivated single crop (Paddy) |
|
P4 (Barusu) |
33o 59.366’ N 74o 55.862’ E |
1779 |
Rolling Foot Hills |
8-16 |
Severe |
Excessively drained |
>10 |
Juglans, Wild Apricot, Chestnut |
Cultivated single crop (Almond) |
|
P5 (Chandhara) |
33o 54.345’ N 74o 53.862’ E |
1617 |
Level Inland Valley |
0-1 |
Very slow |
Well drained |
>10 |
Salix and some wild grasses |
Cultivated single crop (Saffron) |
|
P6 (Ladhoo) |
33o 59.985’ N 75o 00.125’ E |
1685 |
Nearly Level Inland Valley |
1-3 |
Very slow |
Well drained |
>10 |
Populus, Ulmus, Juglans, Chestnut, Salix |
Cultivated single crop (Maize) |
|
P7(Kamrazipora) |
33o 49.898’ N 74o 47.944’E |
1940 |
Undulating Low Hill Plateau |
3-8 |
Slight |
Well drained |
>10 |
Acacia, Populus, Chestnut, Juglans, Salix |
Cultivated double crop (Kharif-Maize or Beans) (Rabi-Oats or Mustard) |
|
P8 (Uthmula) |
33o 42.060’ N 74o 52.441’ E |
1810 |
Nearly Level Inland Valley |
0-1 |
Very slow |
Well drained |
2-5 |
Morus, Populus, Ulmus, Juglans, Salix |
Cultivated single crop (Apple)
|
|
P9 (Pinglena) |
33o 48.385’ N 74o 55.708’ E |
1599 |
Level Inland Valley |
0-1 |
Very slow |
Moderately well drained |
2-5 |
Typhus, Populus, Ulmus, Juglans, Salix and other grasses |
Cultivated double crop (Kharif – Paddy) (Rabi- Mustard) |
The soils were classified taxonomically up to sub-group level following Keys to Soil Taxonomy.15 Moreover, considering limitations and potentials of the soils, Land Capability Classification was evaluated as per guidelines outlined by Klingebiel and Montgomery (1961).16
Results and Discussion
Soil Morphology
The solum (A+B horizon) was moderately deep to deep in all the profiles except P4 which was shallow (Table-2). The colour hue was 10YR in all the profiles with a value of 2 to 5 and chroma from 1 to 4. In general, all the soils were characterized by brown colour mixed with shades of grey and yellow. The soil colour appears to be the function of chemical and mineralogical composition as well as the textural makeup of the soils and conditioned by topographic position and moisture regime.17 The various shades like dark brown, very dark brown, yellow brown colour in surface and sub-surface horizons of profiles indicate a good drainage condition of the soils.18 The structure of the surface soils varied from fine weak granular to medium moderate crumb which can be attributed to continuous soil manipulation and continuous addition of organic matter.19 The sub-surface horizons showed a definite structure of sub-angular to angular blocky which may be attributed to the increase in clay fraction and compaction.20
The consistence of the soils varied from slightly hard to hard (dry), friable to very firm (moist) and slightly sticky to sticky (wet). The increase in hardness, firmness and stickiness with depth is due to increase in compaction and clay content in sub-surface horizons.1 Slight to strong
Table 2: Morphological Properties of arable soils of district Pulwama
|
Profile |
Horizon |
Depth (cm) |
Boundary |
Colour (moist) |
Structure |
Consistency |
Plasticity |
Effervescence |
Special features |
|
|
P1 (Shikargah) |
Ap
|
0-18
|
cs
|
10YR 4/3 (Brown) |
m 2 gr
|
sh fr ss
|
sp
|
–
|
Many fine roots |
|
|
Bt1 |
18-47 |
ds |
10YR 3/3 (Dark brown) |
c 2 abk
|
h fi ss
|
sp
|
–
|
Few fine roots |
||
|
Bt2
|
47-75
|
dw
|
10YR 3/2 (Dark grayish brown) |
c 3 abk
|
vh vfi s
|
mp
|
e
|
few medium roots
|
||
|
Bt3 |
75-90 |
– |
10YR2/2 (Very dark grayish brown) |
c 3 abk |
vh vfi s |
mp |
e |
Many fine roots |
||
|
P2 (Pinglish) |
Ap
|
0-29
|
cs
|
10YR 3/3 (Dark brown) |
m 2 cr
|
sh fr ss
|
sp
|
–
|
Many medium roots |
|
|
AB
|
29-55
|
cs
|
10YR 3/2 (Dark grayish brown) |
m 3 sbk
|
h fi ss
|
sp
|
–
|
Few fine roots
|
||
|
Bt1
|
55-95
|
cs
|
10YR 3/2 (Dark grayish brown) |
c 3 sbk
|
vh vfi s
|
mp
|
–
|
Very few fine roots
|
||
|
Bt2
|
95-133
|
ds
|
10YR 2/2 (Very dark grayish brown) |
c 3 abk
|
vh efi s
|
p
|
–
|
– |
||
|
BC |
133-160 |
– |
10YR 2/2 (Very dark grayish brown) |
c3abk |
vh vfi ss |
sp |
– |
– |
||
|
P3 (Chersoo) |
Ap
|
0-19
|
cs
|
10YR 3/2 (Dark grayish brown) |
f 2 sbk
|
h fi ms
|
mp
|
e
|
Many fine roots |
|
|
AB
|
19-57
|
cs
|
10YR 4/1 (Dark gray) |
m 3 abk
|
vh vfi ms
|
p
|
es
|
Few fine roots and redox concentrations |
||
|
Bt1
|
57-80
|
ds
|
10YR 3/2 (Dark grayish brown) |
f 3 abk
|
vh vfi vs
|
p
|
es
|
Very few fine roots and redox concentrations |
||
|
Bt2 |
80-110 |
– |
10YR 4/2 (Very dark grayish brown) |
f 3 abk |
vh fi ss |
sp |
es |
– |
||
|
P4 (Barsu) |
A
|
0-16
|
cs
|
10YR 4/3 (Brown) |
f 1 gr
|
sh fr ss |
sp
|
es |
Few fine roots |
|
|
AC
|
16-47
|
gb
|
10YR 3/2 (Dark grayish brown) |
f 1 gr
|
sh fr ss
|
sp
|
es
|
Very few fine roots |
||
|
C |
47-72 |
– |
10YR 3/4 (Dark yellowish brown) |
f 2 sbk |
l fr ss |
sp |
es |
– |
||
|
P5 (Chandhara) |
Ap
|
0-20
|
cs
|
10YR 3/3 (Dark brown) |
f 1 sbk
|
sh l ss
|
sp
|
–
|
Few fine roots |
|
|
Bw1 |
20-43 |
dw |
10YR 3/2 (Dark grayish brown) |
m2 sbk
|
h l ss
|
sp
|
–
|
Few fine roots |
||
|
Bw2
|
43-66
|
cs
|
10YR 4/3 (Brown) |
m2 sbk
|
h vfr s
|
sp
|
e
|
Very few very fine roots |
||
|
Bw3 |
66-190 |
– |
10YR 5/4 (Light brown) |
f 2 abk |
h vfr s |
sp |
es |
– |
||
|
P6 (Ladhoo) |
Ap |
0-22 |
cs |
10YR 3/3 (Dark brown) |
m 2 cr |
sh fr ss |
so |
– |
few fine roots |
|
|
Bw1 |
22-42 |
gs |
10YR 4/3 (brown) |
m 2 sbk |
sh vfr ss |
so
|
– |
Few very fine roots |
||
|
Bw2 |
42-58 |
cs
|
10YR 3/3 (Dark grayish brown) |
m 2 abk |
h fi s
|
sp
|
– |
Very few very fine roots |
||
|
Bw3
|
58-93 |
– |
10YR 3/2 (Dark grayish brown)
|
m 1 abk |
h fi s |
sp |
– |
Very few very fine roots |
||
|
P7 (Kamrazipora) |
Ap |
0-21 |
cs |
10YR 3/3 (Dark brown) |
m 2 cr |
h fr ss |
sp |
– |
Fine few roots |
|
|
Bw1 |
21-79 |
ds |
10YR 3/4 (Grayish brown) |
m 2 sbk |
vh fr ss |
sp |
– |
very few fine roots |
||
|
Bw2 |
79-135 |
cs |
10YR 3/2 (Dark grayish brown) |
m 3 abk |
eh vfi s |
sp |
e |
Very few fine roots |
||
|
BC |
135-170 |
cs |
10YR 3/3 (Dark brown) |
c 3 abk |
eh vfi s |
p |
es |
– |
||
|
C |
170-194 |
– |
10YR 3/3 (Dark brown) |
vc 3 abk |
eh vfi s |
p |
es |
– |
||
|
P8 (Uthmula) |
Ap |
0-22 |
cs |
10YR 3/3 (Dark brown) |
m 2 cr |
sh fr ss |
sp |
– |
Few fine roots |
|
|
Bw1 |
22-54 |
ds |
10YR 3/2 (Dark grayish brown) |
m 2 sbk |
h fi ss |
sp |
– |
Few fine roots |
||
|
Bw2 |
54-82 |
gs |
10YR 4/2 (Grayish brown |
c 2 sbk |
vh efi ss |
sp |
– |
Few medium roots |
||
|
Bw3 |
82-120 |
– |
10YR 2/1 (Very dark brown) |
vc 3 abk |
vh efi s |
sp |
– |
few fine roots |
||
|
P9 (Pinglena) |
Ap |
0-29 |
cs
|
10YR 2/1 (Very dark brown) |
f 2 cr
|
sh fr ss |
sp |
– |
Medium fine roots |
|
|
Bt1 |
29-64 |
ds |
10YR 3/3 (Dark brown) |
m 2 abk |
vh fi s |
p |
–
|
Few fine roots |
||
|
Bt2 |
64-120 |
– |
10YR 3/2 (Dark grayish brown) |
m 3 abk |
vh fi s |
p
|
– |
Very few fine roots |
||
Symbols used in Morphological characterization of (Table-2) soils
|
Boundary |
Structure |
Effervescence |
Texture |
Consistency |
|||||||||||
|
b |
: |
broken |
1 |
: |
weak |
e |
: |
slight |
sl |
: |
sandy loam |
h |
: |
hard | |
|
c |
: |
clear |
2 |
: |
moderate |
es |
: |
strong |
scl |
: |
sandy clay loam |
sh |
: |
slightly hard | |
|
d |
: |
diffused |
3 |
: |
strong |
sil |
: |
silt loam |
vh |
: |
very hard | ||||
|
g |
: |
gradual |
f |
: |
fine |
sicl |
: |
silty clay loam |
l |
: |
loose | ||||
|
s |
: |
smooth |
m |
: |
medium |
l |
: |
loam |
vfr |
: |
very friable | ||||
|
w |
: |
wavy |
c |
: |
coarse |
cl |
: |
clay loam |
fr |
: |
friable | ||||
|
cr |
: |
crumb |
fi |
: |
firm | ||||||||||
|
gr |
: |
granular |
vfi |
: |
very firm | ||||||||||
|
sbk |
: |
sub-angular blocky |
ss |
: |
slightly sticky | ||||||||||
|
abk |
: |
angular blocky |
s |
: |
sticky | ||||||||||
|
ms |
: |
moderately sticky | |||||||||||||
|
vs |
: |
very sticky | |||||||||||||
|
so |
: |
non-plastic | |||||||||||||
|
sp |
: |
slightly plastic | |||||||||||||
|
mp |
: |
moderately plastic | |||||||||||||
|
p |
: |
plastic | |||||||||||||
Soil Characteristics
Physical characteristics
The detailed physical characteristics of the soils are presented in table-3. Perusal of the data reveals that the sand, silt and clay content are in the range of 11.7 % to 60.6 %, 22.3 % to 60.5 % and 17.1 % to 35.3 % with mean value of 32.14 %, 42.01 % and 25.84 %, respectively. All profiles showed a decrease in sand fraction down the depth except P3 and P6 which showed an increasing trend that can be attributed to the in situ weathering of the parent material. The silt fraction showed a decrease with depth in all the profiles except P3 with an increase in silt fraction down the depth which may be due to the less weathering intensity and alluvial depositions of the parent material.21 Clay exhibit a decrease down the depth in P4 which may be attributed to the less intense weathering due to low rainfall, severe erosion and sparse vegetation.18 The bulk density and particle density ranged from 1.21 to 1.58 Mgm-3 and 2.3 to 2.8 Mgm-3, respectively with a regular increasing trend with the depth. The increase in bulk density may be attributed to the increase in organic matter and more compaction of finer particles in deeper layers caused by over-head weight of surface soil.17 The increase in particle density could be attributed to increase in total sand fraction in sub-surface horizon.22
Chemical Characteristics
In general, the soils were neutral to slightly alkaline in reaction with the pH variation from 6.49 to 8.42 (Table 4). The pH showed a regular increase with the depth in all the profiles which can be attributed to decrease in organic matter, leaching of bases and accumulation of calcium carbonate at sub-surface horizons of the profiles.23 EC of the soils showed non-saline nature and ranged between 0.01 to 0.19 dSm-1 with a regular increase with the depth in all the profiles, attributed to the leaching of soluble salts.19
The organic carbon content of these soils showed a conspicuous variation within the profile which was higher in surface than in the sub-surface horizons. It ranged from 0.02 to 1.72 percent with a mean value of 0.42 percent. The higher values in surface horizons may be due to the continuous organic manuring, addition through vegetation and low mineralization rates in these soils.19
The exchangeable calcium was dominant cation in all the soil profiles followed by magnesium, potassium and sodium with their values ranging
Table 3: Physical properties of arable soils of district Pulwama.
|
Profile |
Horizon |
Depth (cm) |
Bulk density (Mg m-3) |
Particle density (Mg m-3) |
Porosity (%) |
Sand |
Silt (%) |
Clay (%) |
Textural class |
||
|
Coarse Sand (%) |
Fine sand (%) |
Total sand (%) |
|||||||||
|
P1 (Shikargah) |
Ap |
0-18 |
1.25 |
2.3 |
45.65 |
1.1 |
23.3 |
24.4 |
53.1 |
22.5 |
sil |
|
|
Bt1 |
18-47 |
1.37 |
2.5 |
45.20 |
0.9 |
24.1 |
25.0 |
50.2 |
24.8 |
sil |
|
|
Bt2 |
47-75 |
1.39 |
2.5 |
44.40 |
0.1 |
28.1 |
28.2 |
43.1 |
28.7 |
cl |
|
|
Bt3 |
75-90 |
1.46 |
2.5 |
41.60 |
0.7 |
29.3 |
30.0 |
40.5 |
29.5 |
cl |
|
|
|||||||||||
|
P2 (Pinglish) |
Ap |
0-29 |
1.36 |
2.3 |
40.87 |
1.8 |
47.9 |
49.7 |
30.2 |
20.1 |
l |
|
|
AB |
29-55 |
1.32 |
2.3 |
42.61 |
1.4 |
49.4 |
50.8 |
28.1 |
21.1 |
l |
|
|
Bt1 |
55-95 |
1.37 |
2.5 |
45.20 |
1.1 |
43.1 |
44.2 |
26.5 |
29.3 |
cl |
|
|
Bt2 |
95-133 |
1.41 |
2.7 |
47.78 |
0.8 |
41.8 |
42.6 |
24.2 |
33.2 |
cl |
|
|
C |
133-160 |
1.49 |
2.8 |
46.79 |
0.7 |
51.7 |
52.4 |
24.1 |
23.5 |
scl |
|
|
|||||||||||
|
P3 (Chersoo) |
Ap |
0-17 |
1.21 |
2.3 |
47.39 |
1.2 |
30.1 |
31.3 |
40.4 |
28.3 |
cl |
|
|
AB |
17-57 |
1.37 |
2.5 |
45.20 |
0.9 |
28.5 |
29.4 |
39.4 |
31.2 |
cl |
|
|
Bt1 |
57-80 |
1.39 |
2.5 |
44.40 |
0.7 |
25.4 |
26.1 |
38.6 |
35.3 |
cl |
|
|
Bt2 |
80-110 |
1.43 |
2.5 |
42.80 |
0.5 |
21.5 |
22.0 |
51.7 |
26.3 |
sil |
|
|
|||||||||||
|
P4 (Barsu) |
A |
0-16 |
1.29 |
2.3 |
43.91 |
2.7 |
51.8 |
54.5 |
27.3 |
18.2 |
sl |
|
|
AC |
16-47 |
1.40 |
2.5 |
44.00 |
3.1 |
53.2 |
56.3 |
25.9 |
17.8 |
sl |
|
|
C |
47-72 |
1.45 |
2.5 |
42.00 |
3.5 |
57.1 |
60.6 |
22.3 |
17.1 |
sl |
|
|
|||||||||||
|
P5 (Chandhara) |
Ap |
0-20 |
1.25 |
2.3 |
45.65 |
2.5 |
23.0 |
25.5 |
53.2 |
21.3 |
sil |
|
|
Bw1 |
20-43 |
1.36 |
2.5 |
45.60 |
1.7 |
22.5 |
24.2 |
51.1 |
24.7 |
sil |
|
|
Bw2 |
43-66 |
1.39 |
2.5 |
44.40 |
0.9 |
26.4 |
27.3 |
44.5 |
28.2 |
cl |
|
|
Bw3 |
66-190 |
1.46 |
2.5 |
41.60 |
0.5 |
27.3 |
27.8 |
42.9 |
29.3 |
cl |
|
|
|||||||||||
|
P6 (Ladhoo) |
Ap |
0-22 |
1.30 |
2.4 |
45.83 |
1.3 |
16.5 |
17.8 |
60.5 |
21.7 |
sil |
|
|
Bw1 |
22-42 |
1.38 |
2.5 |
44.80 |
1.8 |
12.5 |
14.3 |
60.0 |
25.7 |
sil |
|
|
Bw2 |
42-58 |
1.46 |
2.5 |
41.60 |
0.5 |
11.2 |
11.7 |
60.3 |
27.7 |
sicl |
|
|
Bw3 |
58-93 |
1.48 |
2.5 |
40.80 |
0.6 |
24.4 |
25.0 |
47.1 |
27.9 |
cl |
|
|
|||||||||||
|
P7 (Kamrazipora) |
Ap |
0-21 |
1.32 |
2.5 |
47.20 |
2.4 |
24.7 |
27.1 |
52.6 |
20.3 |
sil |
|
|
Bw1 |
21-79 |
1.37 |
2.5 |
45.20 |
1.6 |
22.4 |
24.0 |
51.2 |
24.8 |
sil |
|
|
Bw2 |
79-135 |
1.42 |
2.5 |
43.20 |
0.9 |
26.4 |
27.3 |
45.5 |
27.2 |
cl |
|
|
BC |
135-170 |
1.47 |
2.5 |
41.20 |
0.4 |
27.5 |
27.9 |
43.8 |
28.3 |
cl |
|
|
C |
170-194 |
1.49 |
2.5 |
40.40 |
0.8 |
33.0 |
33.8 |
34.9 |
31.3 |
cl |
|
|
|||||||||||
|
P8 (Uthmula) |
Ap |
0-22 |
1.27 |
2.3 |
44.78 |
1.6 |
26.9 |
28.5 |
50.3 |
21.2 |
sil |
|
|
Bw1 |
22-54 |
1.41 |
2.3 |
38.70 |
0.9 |
29.1 |
30.0 |
47.6 |
22.4 |
l |
|
|
Bw2 |
54-82 |
1.45 |
2.5 |
42.00 |
0.8 |
30.8 |
31.6 |
48.1 |
20.3 |
l |
|
|
BC |
82-120 |
1.48 |
2.5 |
40.80 |
0.3 |
35.0 |
35.3 |
40.2 |
24.5 |
l |
|
|
|||||||||||
|
P9 (Pinglena) |
Ap |
0-29 |
1.35 |
2.3 |
41.30 |
0.8 |
28.3 |
29.1 |
42.3 |
28.6 |
cl |
|
|
Bt1 |
29-64 |
1.45 |
2.5 |
42.00 |
0.7 |
31.1 |
31.8 |
35.4 |
32.9 |
cl |
|
|
Bt2 |
64-120 |
1.58 |
2.5 |
36.80 |
0.5 |
30.0 |
30.5 |
34.4 |
35.1 |
cl |
from 3.87 to 4.61 cmol (p+) kg-1, 0.40 to 0.47 cmol (p+) kg-1, 0.10 to 0.29 cmol (p+) kg-1 and 0.07 to 0.42 cmol (p+) kg-1, respectively. The content of these exchangeable cations showed irregular trends with soil depth which can be attributed to the root distribution of principal crops and prevalence of weathering of clay minerals.24 The calcium carbonate content was present in meagre amounts in most of the profiles while as P3 and P4 had considerable amount of calcium carbonate (Table-4).
Cation Exchange capacity of the soils showed little variation between and within the profiles. Profiles P1, P5 and
Table 4: Chemical properties of arable soils of district Pulwama.
|
Profile |
Horizon |
Depth (cm) |
pH (1:2.5) |
EC (dSm-1) |
OC (%) |
CaCO3 (%) |
CEC (cmol(p+) kg-1) |
Ca (cmol(p+) kg-1) |
Mg (cmol(p+)kg-1) |
K (cmol(p+) kg-1) |
Na (cmol(p+) kg-1) |
Base saturation (%) |
|
P1 (Shikargah) |
Ap |
0-18 |
6.55 |
0.01 |
1.06 |
0.00 |
9.12 |
4.51 |
0.47 |
0.26 |
0.42 |
62.06 |
|
|
Bt1 |
18-47 |
6.44 |
0.03 |
0.38 |
0.00 |
9.46 |
4.23 |
0.45 |
0.13 |
0.10 |
51.90 |
|
|
Bt2 |
47-75 |
6.86 |
0.04 |
0.35 |
0.30 |
9.78 |
4.35 |
0.44 |
0.13 |
0.11 |
51.43 |
|
|
Bt3 |
75-90 |
7.20 |
0.05 |
0.09 |
0.70 |
9.98 |
4.40 |
0.42 |
0.10 |
0.12 |
50.50 |
|
|
||||||||||||
|
P2 (Pinglish) |
Ap |
0-29 |
6.55 |
0.08 |
1.51 |
0.00 |
9.35 |
4.34 |
0.44 |
0.27 |
0.13 |
54.13 |
|
|
AB |
29-55 |
7.21 |
0.04 |
0.20 |
0.00 |
8.42 |
3.91 |
0.43 |
0.20 |
0.13 |
54.82 |
|
|
Bt1 |
55-95 |
7.28 |
0.06 |
0.16 |
0.00 |
9.11 |
4.43 |
0.44 |
0.17 |
0.10 |
56.33 |
|
|
Bt2 |
95-133 |
7.31 |
0.08 |
0.06 |
0.00 |
9.35 |
4.31 |
0.45 |
0.16 |
0.11 |
53.85 |
|
|
C |
133-160 |
7.44 |
0.12 |
0.02 |
0.10 |
8.37 |
4.09 |
0.44 |
0.13 |
0.09 |
56.78 |
|
|
||||||||||||
|
P3 (Chersoo) |
Ap |
0-17 |
7.56 |
0.12 |
1.72 |
0.80 |
9.45 |
4.61 |
0.44 |
0.17 |
0.07 |
55.59 |
|
|
AB |
17-57 |
7.82 |
0.17 |
1.30 |
2.10 |
9.67 |
4.04 |
0.45 |
0.15 |
0.35 |
51.35 |
|
|
Bt1 |
57-80 |
8.28 |
0.19 |
0.71 |
2.80 |
9.82 |
4.44 |
0.44 |
0.14 |
0.29 |
54.20 |
|
|
Bt2 |
80-110 |
8.30 |
0.15 |
0.20 |
4.70 |
8.88 |
3.92 |
0.42 |
0.11 |
0.12 |
51.43 |
|
|
||||||||||||
|
P4 (Barsu) |
A |
0-16 |
7.65 |
0.07 |
0.37 |
3.20 |
10.50 |
3.97 |
0.42 |
0.19 |
0.10 |
44.47 |
|
|
AC |
16-47 |
8.27 |
0.09 |
0.06 |
4.30 |
9.40 |
4.48 |
0.40 |
0.19 |
0.07 |
54.19 |
|
|
C |
47-72 |
8.38 |
0.10 |
0.02 |
7.80 |
8.70 |
4.39 |
0.42 |
0.14 |
0.12 |
58.83 |
|
|
||||||||||||
|
P5 (Chandhara) |
Ap |
0-20 |
7.21 |
0.06 |
0.38 |
0.00 |
8.87 |
4.07 |
0.44 |
0.29 |
0.13 |
55.45 |
|
|
Bw1 |
20-43 |
7.83 |
0.07 |
0.11 |
0.12 |
8.79 |
4.18 |
0.46 |
0.22 |
0.08 |
56.18 |
|
|
Bw2 |
43-66 |
8.13 |
0.11 |
0.05 |
1.30 |
9.05 |
4.08 |
0.42 |
0.18 |
0.14 |
53.27 |
|
|
Bw3 |
66-190 |
8.42 |
0.12 |
0.02 |
2.10 |
9.39 |
4.21 |
0.43 |
0.15 |
0.13 |
52.34 |
|
|
||||||||||||
|
P6 (Ladhoo) |
Ap |
0-22 |
7.70 |
0.09 |
0.94 |
0.00 |
9.67 |
4.43 |
0.43 |
0.14 |
0.13 |
53.00 |
|
|
Bw1 |
22-42 |
7.62 |
0.08 |
0.92 |
0.00 |
9.23 |
4.13 |
0.42 |
0.12 |
0.13 |
51.94 |
|
|
Bw2 |
42-58 |
7.54 |
0.13 |
0.54 |
0.15 |
9.31 |
3.87 |
0.43 |
0.11 |
0.16 |
49.06 |
|
|
Bw3 |
58-93 |
7.72 |
0.19 |
0.28 |
0.19 |
9.87 |
4.20 |
0.42 |
0.13 |
0.34 |
51.55 |
|
|
||||||||||||
|
P7 (Kamrazipora) |
Ap |
0-21 |
7.38 |
0.07 |
0.46 |
0.00 |
8.25 |
4.27 |
0.45 |
0.22 |
0.23 |
62.71 |
|
|
Bw1 |
21-79 |
7.33 |
0.12 |
0.31 |
0.00 |
8.99 |
4.10 |
0.44 |
0.20 |
0.16 |
54.60 |
|
|
Bw2 |
79-135 |
7.63 |
0.10 |
0.27 |
1.50 |
8.75 |
4.06 |
0.43 |
0.22 |
0.13 |
55.30 |
|
|
BC |
135-170 |
8.13 |
0.05 |
0.07 |
4.70 |
9.13 |
4.27 |
0.44 |
0.19 |
0.13 |
55.17 |
|
|
C |
170-194 |
8.31 |
0.11 |
0.09 |
8.90 |
9.12 |
4.03 |
0.45 |
0.16 |
0.10 |
52.01 |
|
|
||||||||||||
|
P8 (Uthmula) |
Ap |
0-22 |
6.49 |
0.05 |
0.86 |
0.00 |
8.75 |
4.54 |
0.42 |
0.17 |
0.08 |
59.06 |
|
|
Bw1 |
22-54 |
6.68 |
0.02 |
0.18 |
0.00 |
9.12 |
4.29 |
0.44 |
0.15 |
0.17 |
55.60 |
|
|
Bw2 |
54-82 |
6.90 |
0.03 |
0.15 |
0.00 |
8.97 |
4.48 |
0.44 |
0.15 |
0.16 |
58.27 |
|
|
BC |
82-120 |
7.20 |
0.08 |
0.02 |
0.00 |
9.87 |
4.16 |
0.43 |
0.12 |
0.14 |
49.53 |
|
|
||||||||||||
|
P9 (Pinglena) |
Ap |
0-29 |
7.16 |
0.05 |
1.29 |
0.00 |
7.23 |
4.14 |
0.43 |
0.14 |
0.21 |
68.08 |
|
|
Bt1 |
29-64 |
7.33 |
0.07 |
0.06 |
0.00 |
9.12 |
4.42 |
0.44 |
0.13 |
0.16 |
56.43 |
|
|
Bt2 |
64-120 |
7.41 |
0.08 |
0.02 |
0.00 |
9.23 |
4.48 |
0.44 |
0.11 |
0.17 |
56.35 |
P9 showed an increasing trend, P2, P3, P6, P7 and P8 showed irregular patterns while as P4 showed a decreasing trend of CEC with the depth. The different distributional patterns of CEC within the depths may be attributed to the presence of organic matter19 and illuviated clay.25
Soil Classification
On the basis of morphological and physico-chemical characteristics, the soils of the study area were classified into taxonomical units as per Keys to Soil Taxonomy15 into three major orders i.e. Alfisol, Mollisol and Entisol. Profile P1 was classified as Alfisol while P2, P3, P6, P8 and P9 as Mollisols and the profiles P4, P5 and P7 were classified under Entisol order. The soils were classified up to sub-group level (Table-5).
The soil of Shikargah (P1) was classified under the order Alfisol due to the presence of ochric epipedon and kandic endopedon and was further sub grouped as Typic Kandiudalf.
Table 5: Taxonomical Classification of arable soils of district Pulwama.
|
Profile |
Diagnostic Horizon |
Order |
Sub-order |
Great group |
Sub-group |
|
|
Epipedon |
Endopedon |
|||||
| P1 (Shikargah) |
Ochric |
Kandic |
Alfisol |
Udalfs |
Kandiudalfs |
Typic Kandiudalfs |
| P2 (Pinglish) |
Mollic |
Argillic |
Mollisol |
Udoll |
Argiudoll |
Oxyaquic Argiudoll |
| P3 (Chersoo) |
Mollic |
Argillic |
Mollisol |
Udoll |
Argiudoll |
Aquic Argiudoll |
| P4 (Barusu) |
– |
– |
Entisol |
Psamments |
Udipsamments |
Lithic Udipsamments |
| P5 (Chandhara) |
Ochric |
– |
Entisol |
Orthents |
Udorthents |
Typic Udorthents |
| P6 (Ladhoo) |
Mollic |
– |
Mollisol |
Udoll |
Hapludoll |
Typic Hapludoll |
| P7 (Kamrazipora) |
Ochric |
– |
Entisol |
Fluvents |
Udifluvents |
Typic Udifluvents |
| P8 (Uthmula) |
Mollic |
– |
Mollisol |
Udoll |
Hapludoll |
Typic Hapludoll |
| P9 (Pinglena) |
Mollic |
Argillic |
Mollisol |
Udoll |
Argiudoll |
Oxyaquic Argiudoll |
Table 6: Land capability classification of arable soils of district Pulwama.
|
Profile |
Capability class |
Land suitability |
Remedial Suggestion |
| P1 (Shikargah) |
IIes |
Land suitable for cultivation with moderate restrictions | Proper fertility management, Cover crops, Mulching, Conservation of crop residues and animal manures and green manuring, Good land for Apple, Cherry and Peach. |
| P2 (Pinglish) |
IIs |
Land suitable for cultivation with less restrictions | Proper fertility management, Crop rotation, Green manuring, Suitable land for paddy and other cereals. |
| P3 (Chersoo) |
IIws |
Land suitable for cultivation with moderate restrictions | Proper drainage and fertility management, Paddy cultivation is best. |
| P4 (Barusu) |
IVes |
Cultivable land with severe restrictions. | Terracing, moisture conservation, Green manuring, Fertility management, Floricultural nursery establishment, and Plantation of Apricot are well. |
| P5 (Chandhara) |
IIs |
Land suitable for cultivation with less restrictions | Moisture conservation, Fertility management, Almond and Saffron cultivation. |
| P6 (Ladhoo) |
IIs |
Land suitable for cultivation with less restrictions | Proper irrigation and fertility management, Cultivation of cereal crops. |
| P7 (Kamrazipora) |
IIIes |
Land suitable for cultivation with moderate restrictions | Moisture conservation, Cover crops, Mulching, Fertility management, Almond and Saffron cultivation. |
| P8 (Uthmula) |
IIs |
Land suitable for cultivation with moderate restrictions | Good land for Apple, Cherry and Peach Proper with proper fertility management, Conservation of crop residues and animal manures and Green manuring,. |
| P9 (Pinglena) |
IIws |
Land suitable for cultivation with moderate restrictions | Proper drainage and fertility management, paddy cultivation is best. |
*e: slope limitation, s: soil limitation, w: wetness limitation
The soil profiles of Pinglish (P2), Chersoo (P3) and Pinglena (P9) showed mollic epipedon and argillic endopedon in each and were classified under order Mollisol. The profile P2 and P9 were found to be saturated with water for 20 or more consecutive days in a year and were classified under Oxyaquic Argiudolls at sub-group level.
Profile P3 showed aquic conditions throughout the year with redoximorphic features in sub-surface horizon and was thus sub-grouped under Aquic Argiudoll. The soil profiles of Chandhara (P5) and Kamrazipora (P7) showed ochric epipedon and no distinct endopedon and were classified under Entisol order. Profile P5 was classified under Typic Udorthents sub-group due to non-fluvial nature of soils while as profile P7 showed distinct fluvial nature and hence classified under Typic Udifluvents at sub- group level. The soil profile of Ladhoo (P6) and Uthmula (P8) showed the presence of only mollic epipedon characteristics with a base saturation of >35 percent throughout the profile and were categorized as Mollisols. These profiles were keyed out as Typic Hapludolls at sub-group level. Profile Barsu (P4) showed neither an epipedon nor any endopedon, hence qualified for Entisol order. Due to the presence of rock fragments in profile and sandy loam texture throughout the depth and presence of lithic contact, hence the profile was classified under Lithic Udipsamments sub-group.
Land capability classification
Land Capability Classes, on the basis of criteria,16 were framed as per according to site features studied in the field, morphological and physico-chemical characteristics. Three capability classes II, III and IV were found to be prevalent in the study area (Table-6).
The land capability sub-classes indicate that the soils are moderately well to fairly good cultivable with limitations of slope, physical conditions, erosion and wetness. The inclusion of adaptable crops like almond and saffron in Kamrazipora (P7), floriculture crops and apricot in Barsu (P4)and crop rotations and green manuring, conservation of crop residues and animal manures, cover crops, incorporation of leguminous crops etc. in others pave a way to overcome the limitations of topography, wetness and physical conditions in order to maximize the productivity and profitability out of the soils to enhance better economy of the area.
In conclusion, the varying degree of profile development reflects the different degree of weathering intensity. Soils are having neutral to slightly alkaline reaction. Electrical conductivity is under normal range. Profiles show clay illuviation but the low values of CEC depicts low active clays. The presence of higher organic matter in surface horizons of some profiles reflects good physico-chemical properties. The land capabilty classes viz: II, III and IV in the study area reveals that the soils are cultivable but hold some limitations for use and hence an alternate option was provided.
Acknowledgements
I am highly thankful to Amal Saxena, T. A. Nazki, Shakeel Ahmad Mir, S. K. Raina, Mushtaq ahmad wani, M. Ayoub Bhat and Aijaz ahmad sheikh who helped me at every phase to carry out this research work successfully.
References
- Sarkar, D., Gangopadhyay, S.K. and Velayutham, M. Soil toposequence relationship and classification in lower outlier of Chhotanagpur plateau. Agropedology 11: 29-39. (2001)
- Bhat, M.M. Agricultural Land-Use Pattern in Pulwama District of Kashmir Valley. International Journal of Economics, Business and Finance 1(5): 80-93. (2013)
- Bhat M .M and Shah A R. Agricultural Land Use and Cropping Pattern in Jammu and Kashmir, Research Journal of Agricultural Sciences, 2(3): 710- 712. (2011)
- Census. General features as on entry 01/2013. (http://pulwama. gov.in/districtglance.htm). (2011)
- Sehgal, J.L. Soil resource mapping of different states of India. National Bureau of Soil Science and Land use Planning, Nagpur. Soil Bulletin 23: 39-40. (1994)
- Natarajan, A. and Sarkar, D. Field Guide for Soil Survey. National Bureau of Soil Survey and Land Use Planning (NBSS & LUP). pp: 1-71. (2009)
- Piper, C.S. Soil and Plant Analysis. 5th edition. Hans Publisher, Bombay. (1966)
- Jackson, M.L. Soil Chemical Analysis. Prentice Hall of India Private Limited, New Delhi. (1973)
- Richards, L.A. Diagnosis and improvements of saline and alkali soils. Agricultural Handbook No. 60. USDA Washington D.C., 160 p. (1954)
- Wakley, A. and Black, I.A. An examination of the method for determining soil organic matter and a proposed modification of the chromic acid titration. Soil Science 36: 29-39. (1934)
CrossRef - Schollenberger, C.J. and Simon, R.H. Determination of exchange capacity and exchangeable bases in soil-Ammonium acetate method. Soil Science 59: 13-24. (1945)
CrossRef - Hesse, P.R. A textbook of soil chemical Analysis. Chem. Publ. Co., Inc., New York. NY. (1972)
- Blacke, G.R. and Hartge, K.H. Bulk density. In: Methods of Soil Analysis (Ed. A. Klute), American Society of Agronomy, Madison, WI. pp 363-375. (1986a)
- Blacke, G.R. and Hartge, K.H. Particle density, In: Methods of Soil Analysis, American society of Agronomy, Madison, WI, pp 377-382. (1986b)
- Soil Survey Staff. Keys to Soil Taxonomy. United States Department of Agriculture, Washington DC. (2010)
- Klingebial, A.A. and Montgomery, P.H. Land capability Classification, USDA Agriculture Handbook, 210 SCS, Washington DC. ZIP. (1961)
- Walia, C.S. and Rao) Genesis, characterization and taxonomic classification of some soils of Trans-Yamuna plains. Journal of the Indian Society of Soil Science 45: 156-162. (1997)
- Mahajan, A., Sharma, S.K., Gupta, R.D. and Sharma, R. Morphological, physical and chemical properties of soils from Northwest Himalayas. Bulgarian Journal of Agricultural Science 13: 607-618. (2007)
- Najar, G.R. Akhtar, F. Singh, S.R. and Wani, J.A. Characterization and classification of some apple growing soil of Kashmir. Journal of the Indian Society of Soil Science 57(1): 81-84. (2009)
- Sharma, B.D., Arora, H., Kumar, R. and Nayyar, V.K. Relationship between soil characteristics and DTPA-extractable micronutrient in inceptisols of Punjab. Communication in Soil Science and Plant Analysis 35(5): 799 -818. (2004)
CrossRef - Wani, J.A., Malik, M.A., Kirmani, N.A. and Gangoo, S.A. Characteristics and Classification of Tsari-Sharief micro watershed. SKUAST Journal of Research 11: 250-254. (2009)
- Nayak, R.K., Sahu, G.S. and Nanda, S.S.K. Characterization and Classification of the soils of Cental Research Station, Bhubaneswar. Agropedology 12: 1-8. (2001)
- Gabhane, V.V., Jadhao, V.D. and Nagdev, M.S. Land evaluation for land use planning of micro-watershed in Vidarbha region of Maharashtra. Journal of Indian Society of Soil Science 54: 307-315. (2006)
- Verma, T.P., Singh, S.P. Gopal, R., Rao, R.V.S. and Tarsem Lal. Characterization and Evaluation of soils of Trans Yamuna area in Etawah district, Uttar Pradesh for Sustainable land use. Agropedology 22 (1): 26-34. (2012)
- Sitanggang, M., Rao, Y.S., Nayan Ahmed and Mahapatra, S. K., Characterization and classification of soils in watershed area of Shikohpur, Gurgaon district, Haryana. Journal of Indian Society of Soil Science 54: 106-110. (2006)