Introduction
Agricultural machinery are often encountered with sudden jerks and forces due to the harsh field conditions during tillage operation. When the stress induced due to these forces exceeds the ultimate strength of material, it leads to failure of different components causing injuries, increase in manufacturing costs and time. However, it is undesirable considering the timeliness of agricultural operations. Advancement in the computer aided softwares helps designers to invent, revise detailed drawings, simulate and optimize the parameters of designs according to the need. Failure situations in the field can be speculated and prevented by static simulations of the machine structure through appropriated machine design and selection of materials. Breakdown of any unit, system or equipment is an avoidable and costly occurrence and must be prevented or minimized. Analysis of such failures becomes a resourceful and affordable tool in addressing such unwanted occurrences.1
The use of numerical simulation can predict the behavior of the system under study in order to reduce risk in decision making, identifying problems before they occur, reducing costs in evaluating the technical and economic feasibility of a given project. In agricultural machinery industry, especially in small and middle scales, insufficient technical knowledge, usage of new technology and incautious design features can cause problems such as breakdowns, failures, etc., during the manufacturing or field operations. Failure of machinery devices is one of the biggest problems in engineering.2
Table 1: Research plan for field tests
|
Tillage implement |
Variables |
Levels |
Values |
|
Powered disc harrow |
Common parameters |
||
|
(i) Soil type |
1 |
Sandy clay loam |
|
|
(ii) Average soil moisture (% db) |
1 |
12±0.75 |
|
|
Independent parameters |
|||
|
(i) Width (m) |
1 |
1.22 m |
|
|
(ii) Depth (cm) |
3 |
9, 12, 14 cm |
|
|
(iii) Speed, km h-1 |
3 |
3.69, 4.67, 6.55 |
|
|
(iv) u/v ratio |
3 |
4.74, 3.75, 2.67 |
|
|
(v) Cone index (kPa) |
1 |
930±40 |
|
|
Dependent parameters |
|||
|
Observations |
Units |
||
|
(i) Draft |
kN |
||
|
(iii) Field capacity |
ha h-1 |
||
|
(iv) Field efficiency |
% |
||
|
(v) Fuel consumption |
l h-1 |
Table 2: Finite element analysis of designed PDH.
| Component | Material | Maximum equivalent stress induced (N mm-2) | Yield stress of material (N mm-2) | Maximum deformation (mm) |
| Gang shaft | C45 steel | 262.17 | 430 | 2.28 |
| Shaft between U-joint and upper side gear | E250 steel | 113.03 | 410 | 0.2431 |
| Central crown gear shaft | E250 steel | 79.06 | 410 | 0.092 |
| Side spur gears | EN 8 carbon steel | 256.91 | 465 | 0.15 |
| Bevel and crown gear | EN 8 carbon steel | 136.44 | 465 | 0.065 |
| Main frame | Mild steel | 136.64 | 250 | 0.85 |
There are mainly five major methods that had been used as approaches to solve problems in the area of soil-tool interaction and failure mechanism, namely empirical and semi-empirical, dimensional analysis, finite element method, discrete element method and artificial neural network.3 The finite element method (FEM) is a very powerful method among various numerical methods, and is commonly used for analyzing soil related problems because FEM excels in the analysis of dynamic problems regarding material failure and large-scale deformation.4 FE analysis is basically a computerized method to analyze complicated engineering problems and for predicting how a product reacts to real-world forces, vibration, heat and other physical effects. Results of FE analysis shows whether a product will break, wear out, or work the way it was designed. It is particularly useful for problems with geometric or material nonlinearities, as well as situations where underlying differential equations describing physical or biological phenomena are nonlinear. Since most soil-machine interaction problems involve both material and geometric nonlinearities, FEM has been widely used to analyze soil-machine interaction problems.4,5,6,7 The FE model can also be employed for design and optimization of tillage tools8,9,10 or for conducting stress and deformation analysis of any mechanical model before field investigations.11
Table 3: PDH dimensions and specifications for a 50 hp tractor.
|
Parameters |
Values |
|
|
No of discs |
6 (three on each gang) |
|
|
Overall dimensions |
1500 × 1150 × 1030 |
|
|
Weight |
382 kg |
|
|
Gang shaft |
Cross section |
35 × 35 |
|
Length |
725 |
|
|
Material used |
C45 steel |
|
|
Disc Diameter |
508 |
|
|
Disc curvature |
60 |
|
|
Disc spacing / spool size |
225 |
|
|
Gang angle |
20° |
|
|
Central gap between two gangs |
50 |
|
|
Flat support between spool bearing and toolbar of frame |
Length |
250 |
|
Width |
100 |
|
|
Thickness |
10 |
|
|
Shaft between U-joint and upper side gear |
Diameter |
50 |
|
Length |
340 |
|
|
Material used |
E 250 steel |
|
|
Central crown gear shaft |
Diameter |
50 |
|
Length |
536 |
|
|
Material used |
E 250 steel |
|
|
Bevel gear shaft |
Diameter |
40 |
|
Material used |
E 250 steel |
|
|
Main frame |
Cross section |
70 × 70 |
|
Material used |
Mild Steel |
|
Note: all dimensions are in mm.
Traditional passively driven disc harrows are being widely used for the preparation of seed bed considering its several advantages like the excellent ability to cut and incorporate the crop residues in the soil, effective inversion and pulverization of the soil sod with minimal compaction.12 However, the draft required by the passively driven disc is generally very high and is transmitted through soil tool interface resulting in inefficient power transmission and poor penetration behavior.13 These days’ farmers are more inclined towards multi-powered tillage tools which have greater versatility in manipulating the soil with reduced draft requirements.14 Many research findings indicates a significant reduction in draft requirement with improved soil tilth in terms of reduced soil cone index and better soil pulverization through powering of passively driven discs.15,16,17,18, 19 However, the complex design involved due to the use of rotary parts for supplying power to the gang shaft makes it necessary to design, optimize and simulate the model before any product development and field testing to avoid any failure complications in the later phase.
Table 4: Bevel and crown gear parameters.
|
Parameters |
Bevel pinion |
Crown gear |
|
Material used |
EN 8 carbon steel |
EN 8 carbon steel |
|
RPM |
540 |
270 |
|
Pressure angle (ф) |
20° |
20° |
|
Module |
7 |
7 |
|
Number of teeth’s |
11 |
22 |
|
Diameter |
77 |
154 |
|
Cone radius |
84.8 |
84.8 |
|
Pitch angle |
27° |
63° |
|
Face width |
28.27 |
28.27 |
|
Addendum |
9.10 |
9.10 |
|
Dedendum |
8.40 |
8.40 |
|
Clearance |
1.40 |
1.40 |
|
Working depth |
14 |
14 |
|
Thickness of tooth |
11 |
11 |
|
Fillet radius at root |
2.80 |
2.80 |
Note: all dimensions are in mm.
Table 5: Selected parameters of side gears.
| Gear | Number of teeth | Diameter (mm) | Module |
| Upper gear | 21 | 147 | 7 |
| Middle gear | 36 | 252 | 7 |
| Lower gear | 28 | 196 | 7 |
Table 6: Field performance of the developed PDH at different operating conditions.
| vt,km h-1 | Depth, cm | Measured parameters | ||||||||
| Draft,kN | Actual field capacity,ha h-1 | Field efficiency,% | Fuel consumption,l h-1 | |||||||
| 1st pass | 2nd pass | 1st pass | 2nd pass | 1st pass | 2nd pass | 1st pass | 2nd pass | |||
| 3.69 | 9 | 1.79 | 1.58 | 0.36 | 0.35 | 79.25 | 77.18 | 4.31 | 4.30 | |
| 4.67 | 2.08 | 1.65 | 0.42 | 0.41 | 74.30 | 72.40 | 5.02 | 4.45 | ||
| 6.55 | 2.57 | 2.30 | 0.56 | 0.56 | 70.60 | 70.10 | 6.03 | 5.50 | ||
| 3.69 | 12 | 2.01 | 1.66 | 0.37 | 0.36 | 81.35 | 78.26 | 4.95 | 4.52 | |
| 4.67 | 2.25 | 1.92 | 0.45 | 0.43 | 79.02 | 76.30 | 5.33 | 4.68 | ||
| 6.55 | 2.65 | 2.55 | 0.57 | 0.55 | 71.23 | 68.80 | 6.42 | 5.63 | ||
| 3.69 | 14 | 2.05 | 1.82 | 0.36 | 0.36 | 81.20 | 79.50 | 5.21 | 4.91 | |
| 4.67 | 2.44 | 2.21 | 0.44 | 0.45 | 78.20 | 78.42 | 5.65 | 5.01 | ||
| 6.55 | 2.80 | 2.64 | 0.60 | 0.57 | 75.41 | 71.80 | 6.83 | 5.98 | ||
Note: Vt = theoretical velocity
The objective of this study is to design and develop a powered single acting disc harrow with the help of computer-aided software’s: SolidWorks 2013 and ANSYS R15.0 for three-dimensional solid modelling and FE analysis of the optimized model, respectively to avoid any failure situations during the product development and field testing phase. It also accelerated manufacturing process with reduced costs and timing. Rigorous field testing was done with the developed implement and its performance was evaluated.
Materials and Methods
Key considerations in the design
Speed Ratio
The rotational direction of discs, operating depth and the speed ratio are the key factors which govern the design of powered disc harrow (PDH).15,16 Rotation of the discs in the direction of travel is called concurrent revolution and opposite to the direction of travel is called non-concurrent or reverse rotation. Forward rotation of the active tillage tools results in the lowering the draft requirement compared to the reverse rotation as in the case of rotavator. Many studies15,16 observed a major reduction in a draft requirement, specific draft requirement and sometimes penetration resistance also when discs rotate in the direction of travel. Peripheral speed of the disc blades (u) to the forward velocity of the travel (v) i.e. speed ratio (u/v) is an important factor which decides the soil pulverization at the price of fuel consumption. Higher speed ratio results in an undesied increase in the fuel consumption. Also, lesser speed ratio results in inadequate pulverization of the soil with unsteadiness in cutting resistance. Based on the above facts concurrent mode of rotation was chosen for tilling the soil. At 3.69, 4.67 and 6.55 km h-1 forward speed of tractor, speed ratios of 4.74, 3.75, 2.67 were achieved in the field at 80% throttle of tractor for 51 cm diameter disc blades. Field performance of the developed powered single acting disc harrow was evaluated at these three speed ratios.
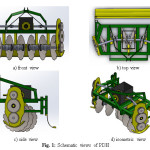 |
Figure 1: Schematic views of PDH. Click here to View figure |
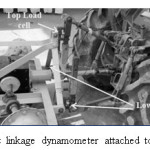 |
Figure 2: Three-point linkage dynamometer attached to John Deere tractor. Click here to View figure |
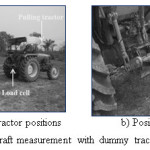 |
Figure 3: Draft measurement with dummy tractor method. |
Side forces for lateral stability
The transverse component of soil reactive force determines the lateral stability of the disc implement. The transverse soil reactive force i.e. side thrust on the forward-driven powered discs is generally very high due to positive cutting and throwing action of disc blades. It is, therefore, necessary to take into account the side thrust when designing the rear wheel of the powered disc. The side forces from the individual gangs in the single-acting disc harrow balances each other by throwing the soil in opposite directions which do not affect the lateral stability of the implement. Considering this fact in mind single acting disc harrow design was chosen without any rear thrust wheel, and power was supplied to both gang shafts by suitable side gear assemblies to balance out the side forces in the field.
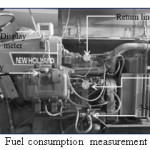 |
Figure 4: Fuel consumption measurement system. |
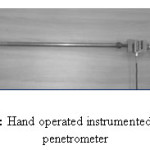 |
Figure 5: Hand operated instrumented cone penetrometer. |
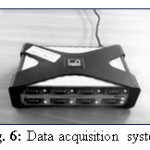 |
Figure 6: Data acquisition system. |
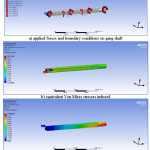 |
Figure 7: FEA results of gang shaft. |
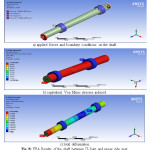 |
Figure 8: FEA Results of the shaft between U-Joint and upper side gear. |
Power Transmission System
Power was transmitted from the tractor PTO shaft to the central gearbox through suitable universal shaft and couplings. Gearbox was designed to transfer power to the both sides. A central shaft was used which runs from the center of crown gear to the universal joint on both sides. Two side gear assemblies were used each consisting of the side plate, dust cover, upper, middle and lower spur gear combination for transmitting PTO power to the gang shaft. The speed of PTO was initially reduced by central gear box in the ratio of 2:1 and then by side gear assemblies in the ratio of 4:3.
Three-Dimensional Modelling of PDH
The three-dimensional modeling of the implement was done in SolidWorks 2013. Schematic front, top, side and isometric views of the implement are shown in Figs. 1(a) to 1(d), respectively. The developed PDH comprised of two units i.e. PDH and leveller. PDH was used for tilling the soil and the attached leveller mounted behind the harrow leveled the ground for making the seedbed appropriate for sowing. Developed 3×3 single-acting PDH consisted of a central gear box along with telescopic shaft for connecting tractor PTO to the input shaft of gearbox, two universal joints to transmit power to both sides at gang angle of 20°, two gang shafts, four spool bearings and two side gear assemblies each consisting of one side plate, dust cover and three spur gears for rotating the shaft of disc gang with external power.
FE Analysis of Designed PDH
FEM is a common tool within various fields of engineering. It is used for advanced numerical calculations and is developed from the theories of continuum mechanics, which studies equilibrium, motion, and deformation of physical solids.20 FEA uses a complex system of points called nodes which make a grid called a mesh. This mesh is programmed to contain the material and structural properties which define how the structure will react to certain loading conditions.21 Three-dimensional model of the structure was created in Solid Works 2013 and FEA was carried out by dividing it into a finite number of discrete sub-regions called elements, which was connected at discrete points called nodes. Then boundary conditions were applied such as fixed displacement and prescribed load to some nodes. Types and properties of elements and material properties were the other input parameters which were provided to the software.
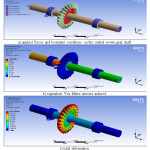 |
Figure 9: FEA results of the central crown gear shaft. |
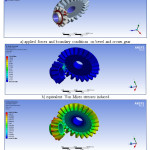 |
Figure 10: FEA results of bevel and crown gear. |
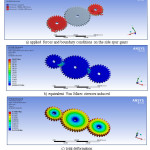 |
Figure 11: FEA results of the side spur gears. |
Designed gang shaft, side gear assembly, central shaft, the shaft between U-joint and upper side gear, bevel gear shaft and main frame were validated by doing static structural analysis in ANSYS R15.0 workbench software. The equivalent stress and deformation obtained from FE analysis for each part were found to be less than the permissible stress and deformation of the material selected. The designed PDH was found suitable for carrying out the tillage operations under normal field conditions with a 50 hp tractor.
Research Plan for Field Tests
The research plan for the field tests conducted is presented in Table 1.
Instrumentation for Field Performance
All the field experiments for the developed PDH were conducted with a 46 hp Ford 3630, 2WD tractor.
Draft Measurement
Draft was measured in the field using three-point linkage dynamometer22 and with dummy tractor method both to validate the results and are displayed in Fig. 2 and Fig. 3, respectively. Two tractors were used in dummy tractor method, John Deere 5055 E at the front and Ford 3630 at the rear. The front tractor was used to pull the rear tractor, which was always put in neutral. S-type load cell having 2-tonne capacity was attached between these two tractors through suitable chain linkage system as shown in Figs. 3(a) and 3(b). The implement was attached to the rear tractor, and tensile force on load cell was measured while doing an operation on different stripes of land at different gears for obtaining different u/v ratios. At first implement was lifted, and the front tractor was used to pull the rear tractor. Readings of tensile force were recorded through a data logger system. The average of these forces gave the rolling resistance of rear tractor. Then in the same stripe of land implement was engaged and operated. This time PTO power was supplied to the implement and the rear tractor was put in neutral. Readings of tensile force were again recorded and an average of these gives the summation of rolling resistance and draft. Actual draft was calculated by subtracting rolling resistance from the summation of the draft and rolling resistance. Calibration of S-type load cell was carried out for tensile force by a mechanical floor crane.
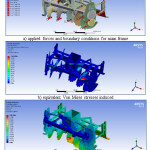 |
Figure 12: FEA Results of the main frame. Click here to View figure |
Fuel Consumption Measurement System
Fuel consumption in the field was measured (Fig. 4) with the help of fuel flow meters (FFM) mounted on the fuel supply line and return line of Ford 3630 tractor respectively. A display board was connected to both FFMs to record and display the output. Power to the display board was provided from a 12 V DC battery. Display meter readings included total fuel consumption in the trip in units of l and l h-1. The system was based on the principle of differential consumption. Contoil DFM-BC display meter deducts the readings of return line flow meter from the readings of supply line flow meter, to give the total fuel consumed during the operation. Also, time taken by the tractor during the operation was noted down using a stopwatch. Fuel consumption was calculated by dividing total fuel consumed during the operation with the time taken. For checking the accuracy of fuel flow meters, an auxiliary fuel tank was also placed in the supply line. Supply from the main fuel tank was cut during the tillage operation with the help of a three-way gate valve, and fuel is directed from the auxiliary fuel tank to the fuel injectors through fuel injection pump and supply line flow meter followed by secondary fuel filter. A connection was made for return line of fuel to the auxiliary tank. The auxiliary tank was filled to its neck before starting each trip. After completion of each trip amount of fuel required to fill the tank up to the neck level was measured with the help of measuring cylinder. Both measuring methods gave approximately same fuel consumption readings.
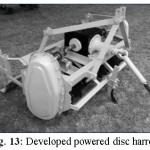 |
Figure 13: Developed powered disc harrow. Click here to View figure |
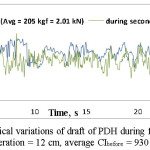 |
Figure 14: Typical variations of draft of PDH during field operation(Gear L1, depth of operation = 12 cm, average CIbefore = 930 kPa, M.C. = 12% (db)) Click here to View figure |
Cone Index Measurement
Cone index values were measured with the aid of a hand operated instrumented cone penetrometer (Fig. 5). A hand operated cone penetrometer consisting of a 30° cone with a base area of 323 mm2 and a 600 mm long circular shaft of 15.9 mm diameter was attached to a calibrated S-type load cell having 500 kg capacity and used to measure the average cone index value up to 120 mm depth of soil. The penetrometer was operated at the rate of 25-30 mm per second. Dial gauge of manually operated cone penetrometer was replaced by the load cell, and digital signals were procured through an 8-channel HBM Quantum-X DAQ system at 50 samples per second. Cone penetrometer was pushed into the soil up to 12 cm depth. Average force readings obtained in kg was converted into kg cm-2 by dividing it with the base area of cone penetrometer (3.23 cm2).
Data Acquisition System
The outputs of all the load cells used were recorded through the HBM Quantum-X DAQ system (Fig. 6) at sampling frequency of 50 Hz. AC power supply to the data logger was provided by an inverter connected to the 12V DC battery source of the tractor.
Measurement of Speed of Operation
The time taken by the tractor to travel 40 m distance was measured with a digital stopwatch, and the speed of operation was calculated using Eq. (1):
v = (3.6 × 25) / t (1)
where, v= speed of operation of tractor, km h-1; t = time, s
Measurement of Slip
The theoretical velocity and actual velocity were used to calculate slip using Eq. (2):
s = (Vt – Va) / Vt × 100 (2)
where, s = slip, %; Vt = theoretical velocity; Va = actual velocity
Field Capacity
Actual field capacity (A.F.C) is the total time required to carry out tillage operation including the time lost during the field operation for turning, idle travel, operator’s skill etc. Field efficiency was calculated by dividing actual field capacity with theoretical field capacity.
Test Procedure
All the experiments were carried out in plots of size 55×38 m. Experiments were based on completely RBD with three replications for each test. Before conducting each test, few important soil parameters such as moisture content of the soil and soil cone index were measured using an infrared moisture meter and hand operated instrumented cone penetrometer, respectively. For draft measurement, each test was carried out in the test run of 40 m at different speeds of operation and 80% throttle. All the draft and cone index data were stored at a frequency of 20 and 50 Hz, respectively in different channels of HBM Quantum-X DAQ system.
Results and Discussion
Finite Element Simulation of Various Components
Developed three-dimensional model of implement was uploaded in ANSYS R15.0 software for doing static structural analysis on various components. Standard material properties like Young’s Modulus, ultimate tensile strength, yield strength, Poissons’s Ratio, density, etc. were provided to the software for further stress analysis. Proper connections between different components were established. Meshing method and size were selected to create mesh structure of different components. Theoretical calculations were done for various components taking shock and fatigue factors into consideration, and resulting values were used to apply force, moment and boundary constraints on the designed 3D model. The results of induced Von Mises stress and total deformation were analyzed, and necessary design changes were done accordingly in the 3D model to achieve optimum part dimensions for product development. Results of FE analysis are presented here in the form of coloured contours representing stress levels and deformation variation on the model.
Finite element analysis of gang shaft
Applied forces and boundary conditions on gang shaft are shown in Fig. 7(a). The results of finite element analysis are shown in Figs. 7(b) and 7(c). The yield strength of the material should be greater than the maximum equivalent stress induced (262.17 N mm-2). Therefore, C-45 steel (yield strength = 430 N mm-2) was selected for gang shaft.
Finite element analysis of the shaft between U-joint and upper side gear
Applied forces and boundary conditions on the shaft are shown in Fig. 8(a). The results of finite element analysis are shown in Figs. 8(b) and 8(c). The yield strength of the material should be greater than the maximum equivalent stress induced (113.03 N mm-2). Therefore, E250 steel (yield strength = 410 N mm-2) was selected the shaft between U-joint and upper side gear.
Finite element analysis of Central crown gear shaft
Applied forces and boundary conditions on gang shaft are shown in Fig. 9(a). The results of finite element analysis are shown in Figs. 9(b) and 9(c). The yield strength of the material should be greater than the maximum equivalent stress induced (79.06 N mm-2). Therefore, E250 steel (yield strength = 410 N mm-2) was selected the shaft between U-joint and upper side gear.
Finite element analysis of bevel and crown gear assembly
Applied forces and boundary conditions on bevel and crown gear are shown in Fig. 10(a). The results of finite element analysis are shown in Figs. 10(b) and 10(c). The yield strength of the material should be greater than the maximum equivalent stress induced (136.44 N mm-2). Therefore, EN 8 carbon steel (yield strength = 465 N mm-2) was selected for bevel and crown gear used in the central gear box.
Finite element analysis of side spur gears used in side gear assemblies
Applied forces and boundary conditions on side spur gears are shown in Fig. 11(a). The results of finite element analysis are shown in Figs. 11(b) and 11(c). The yield strength of the material should be greater than the maximum equivalent stress induced (256.91 N mm-2). Therefore, EN 8 carbon steel (yield strength = 465 N mm-2) was selected for all the spur gears used in the side gear assemblies.
Finite element analysis of the main frame
Applied forces and boundary conditions for FE analysis of the main frame are shown in Fig. 12(a). The results of finite element analysis are shown in Figs. 12(b) and 12(c). The yield strength of the material should be greater than the maximum equivalent stress induced (136.64 N mm-2). Therefore, mild steel (yield strength = 250 N mm-2) was selected for main frame. The summary of the equivalent stress and deformation of each component of the developed implement is shown in the Table 2. From Table 2 it is evident that the stress induced were much less than the yield stress of the material selected. Hence, the design is safe, i.e. the developed PDH is suitable for carrying out the tillage operations under normal field conditions with a 50 hp tractor.
Design of PDH
The finalized dimensions adopted for the fabrication of 3×3 single acting PDH during design and finite element analysis of the implement in SolidWorks 2013 and ANSYS R15.0, respectively are presented in Table 3. The developed PDH is shown in Fig. 13.
Central gearbox (300×270×290 mm) was used having bevel and crown gear assembly for transmitting power at 90°. The detailed specifications of bevel and crown gears used are provided in Table 4. Side gear assembly having a center to center distance between the upper and lower gear of 423.5 mm was used. The material selected for side spur gears was EN 8 carbon steel. The specifications of side gears are presented in Table 5.
Field performance of the developed implement
Width of Operation
The width of cut of machine was measured by measuring the width of furrow with a measuring tape at an interval of about 3 m along the direction of travel. The average of five readings was taken to determine the width of cut of the implement. The width of operation of the developed PDH was found to be 1.22 m.
Draft requirement of implement
Typical variations of the draft of PDH measured in the field using dummy tractor method with respect to time during a first and second pass are shown in Fig. 14. Average draft values measured during different field experiments are presented in Table 6. Average moisture content and CI of the soil before the operation was 12±0.75% % and 930±40 kPa, respectively. The trend shows that draft increased with increase in forward speed at all operating conditions. Within the test range of speed, depth, and cone index, the lowest and highest draft values were found to be 1.79 kN (at 9 cm depth, 3.69 km h-1 speed) and 2.80 kN (at 14 cm depth, 6.55 km h-1 speed) during first pass and 1.58 kN (at 9 cm depth, 3.69 km h-1 speed) and 2.64 kN (at 14 cm depth, 6.55 km h-1 speed) during second pass, respectively. When the forward speed was increased from 3.69 km h-1 to 6.55 km h-1, the draft of the powered disc was increased by 43.57%, 31.84% and 36.58% at 9, 12 and 14 cm depth of operation, respectively. From Table 6, it is clear that that draft of powered disc was increased with increase in operating depth at all test conditions. When the depth of operation was increased from 9 to 14 cm, the draft of disc harrow was increased by 14.20%, 17.45% and 9.16% at 3.69, 4.67 and 6.55 km h-1 speed of operation, respectively during the first pass. Average slip of the developed implement was found to be 4.1% at an operating depth of 12 cm.
Actual field capacity
The data on the actual field capacity and field efficiency of the developed 3×3 single acting disc harrow are presented in Table 6. Actual field capacity increased with increase in forward speed of operation. Maximum field capacity of 0.60 ha h-1 was obtained at 6.55 km h-1 forward speed and 14 cm depth of operation during the first pass, while minimum field capacity of 0.35 ha h-1 was obtained at 3.69 km h-1 forward speed and 9 cm depth of operation during the second pass.
Fuel consumption
The fuel consumption of 46 hp Ford 3630 tractor in l h-1 at all test conditions is presented in Table 6. Fuel consumption was found to be highest (6.83 l h-1) at 14 cm depth and 6.55 km h-1 speed of operation during the first pass and lowest (4.30 l h-1) at 9 cm depth and 3.69 km h-1 speed of operation during the second pass of tillage operation. Fuel consumption in l h-1 increased with increase in forward speed at all operating depths for first and second passes both. When the speed of operation was increased from 3.69 km h-1 to 6.55 km h-1, the fuel consumption was increased by 39.90%, 29.70% and 31.09% during first pass and 27.90%, 24.55% and 21.79% during the second pass at 9, 12 and 14 cm depth of operation, respectively.
Conclusions
Based on the results obtained in this study, the following specific conclusions can be drawn:
- The three-dimensional model of a single-acting PDH was successfully created in SolidWorks 2013, and optimum part dimensions were achieved by doing FE analysis in ANSYS R15.0 workbench software. The simulation was very helpful to understand the effect of different forces on the model.
- The stress induced and the deformation of each component were found to be less than the allowable stress and maximum deformation of the material selected which signifies the safe design of implement.
- FEM enables to optimize and simulate the complex agricultural machinery and to investigate the stresses and deformations induced in the parts well before product development to avoid failure in the later phase of field evaluation.
- The developed single-acting PDH (1.50×1.15×1.03 m) with a total weight of 382 kg was rigorously tested in the field, and it could be operated successfully up to an operating depth of 14 cm and forward speed of 7 km h-1 in sandy clay loam soil at an average moisture content of 12±0.75 % (db). The draft required to operate the PDH at an operating depth of 12 cm was found to be varying from 2.01 to 2.65 kN during the first pass and 1.66 kN to 2.55 kN during the second pass when operated at forward speeds of 3.69 to 6.55 km h-1.
- The actual field capacity of the developed PDH, when operated at an average depth of 12 cm during the first pass, was found to be 0.37, 0.45 and 0.57 ha h-1 at 3.69, 4.67 and 6.55 km h-1 forward speeds, respectively. Maximum field efficiency of 81.35% was found at 12 cm depth and 3.69 km h-1 forward speed during the first pass, while minimum field efficiency of 68.8% was found at 12 cm depth and 6.55 km h-1 forward speed during the second pass of tillage operation.
- Fuel consumption was found to be highest (6.83 l h-1) at 14 cm depth and 6.55 km h-1 speed of operation during the first pass and lowest (4.30 l h-1) at 9 cm depth and 3.69 km h-1 speed of operation during the second pass of tillage operation.
References
- Revar, V., Parmar, D., and Shah, H. Design, modeling and stress analysis of high-speed helical gear on the basis of bending strength and contact strength by changing face width and helix angle. International Journal For Technological Research In Engineering. 2016;3(9):2347-4718.
- Javad, T., Saeid, S. M., and Reza, A. Static and Dynamic Analysis of Front Axle Housing of Tractor Using Finite Element Methods. Australian Journal of Experimental Agriculture. 2011;2(2):45-49..
- Karmakar, S., and Kushwaha, R. L. Dynamic modeling of soil-tool interaction: an overview from a fluid flow perspective. Journal of Terramechanics. 2006;43:411-425.
CrossRef - Upadhyaya, S. K., Rosa, U. A., and Wulfsohn, D. Application of the finite element method in agricultural soil mechanics. Advances in Soil Dynamics. 2002;2:117-153.
CrossRef - Mootaz, A. E., Hamilton, R., and Boyle, J. T. Simulation of soil–blade interaction for sandy soil using advanced 3D finite element analysis. Soil and Tillage Research. 2004;75:61-73.
CrossRef - Hemmat, A., Nankali, N., and Aghilinategh, N. Simulating stress-sinkage under a plate sinkage test using a viscoelastic 2D axisymmetric finite element soil model. Soil and Tillage Research. 2012;118:107-166.
CrossRef - Bentaher, H., Ibrahmi, A., Hamza, E., Hbaieb, M., Kantchev, G., Maalej, A., and Amold, W. Finite element simulation of moldboard-soil interaction. Soil and Tillage Research. 2013;134:11-16.
CrossRef - Mouazen, A. M., and Nemenyi, M. Tillage tool design by the finite element method: Part 1. Finite element modelling of soil plastic behaviour. Journal of Agricultural Engineering Research. 1999;72:37-51.
CrossRef - Bentaher, H., Ibrahmi, A., Hamza, E., Hbaieb, M., Kantchev, G., Maalej, A., and Arnold, W. Finite element simulation of moldboard-soil interaction. Soil and Tillage Research. 2013;134:11-16.
CrossRef - Armin, A., Fotouhi, R., and Szyszkowski, W. On the FE modeling of soil-blade interaction in tillage operations. Finite elements in analysis and design. 2014;92:1-11.
CrossRef - Kumar, R., and Raheman, H. Design and development of a variable hitching system for improving stability of tractor trailer combination. Engineering in Agriculture, Environment and Food. 2015;8:187-194.
- Kepner, R. A., Bainer, R., and Barger, E. L. Principle of farm machinery, 3rd Edition, The AVI Publishing Company, Inc. USA. 1978.
- Zoz, F. M., and Grisso, R. D. Traction and Tractor Performance. ASAE Distinguished Lecture #27, Agricultural Equipment Technology Conference, 9-11 February 2003, Louisville, Kentucky, USA. 2003.
- Mandal, S. K., Bhattacharyya, B., and Mukherjee, S. Design of rotary tiller’s blade using specific work method (SWM). Journal of Applied Mechanical Engineering. 2015;4(3):1-6.
- Hoki, M., Burkhardt, T. H., Wilkinson, R. H., and Tanoue, T. Study of P.T.O. driven powered disc tiller. Transactions of ASAE. 1988;31(5):1355-1360.
CrossRef - Salokhe, V. M., and Quang, N. B. Dynamics of a powered disk in clay soil. J. Terra. 1995;32(5):231-244.
CrossRef - Singh, T. P., and Singh, B. Design and development of a powered vertical disc plough. Journal of Agricultural Engineering. 2001;38(1):41-52.
- Hann, M. J., and Giessibl, J. Force measurements on driven discs. Journal of Agricultural Engineering Research. 1998;69:149-157.
CrossRef - Nalavade, P. P., Salokhe, V. M., Niyamapa, T., and Soni, P. Performance of free rolling and powered tillage discs. Soil and Tillage Research. 2010;109:87-93.
CrossRef - Nirbhay, M., Dixit, A., Misra, R. K., and Mali, H. S. Tensile test simulation of CFRP test specimen using finite elements. Procedia Materials Science. 2014;5:267-273.
CrossRef - Onwubolu, G. C. Introduction to SolidWorks: A comprehensive guide with applications in 3D printing, CRC Press, Vancouver. 2017.
- Kumar, A. A., Tewari, V. K., and Nare, B. Embedded digital draft force and wheel slip indicator for tillage research. Computers and Electronics in Agriculture. 2016;127:38-49.
CrossRef