Introduction
Agricultural drought is common in Dry land agriculture. Soils of shallow depth, low fertility, and poor water holding capacity and the resultant soil moisture stress during crop growth are some of the major constraints. Integrated Watershed management is being recommended for improving the productivity of drylands. Activities aimed at conserving the natural resources, particularly soil nutrients and water, and their judicious development and utilization form the backbone of the watershed programmes. As a part of better land management, several land treatments such as contour farming tied ridging, broad bed furrows are being suggested for erosion control and rain water conservation. The utility of such measures in terms of soil water availability to crops will depend on a number of factors. Additional retention of water in the soil profile will depend on the antecedent soil moisture condition, amount of rainfall infiltration and seepage / percolation losses besides the water holding capacity of the soil.7 The utility of such practices will also depend on the frequency of runoff events as well as the quantum of runoff, which we are trying to control through such practices.17
Plant nutrition is the study of the chemical element and compound necessary for plant growth, plant metabolism and their external supply. In its absence the plant is unable to complete a normal life cycle or that the element is part of some essential plant constituent or metabolite. The soil supplies nitrogen, phosphorus, potassium, calcium, magnesium, and sulphur are called macronutrients and iron, manganese, boron, molybdenum, copper, zinc, chlorine, and cobalt, are called micronutrients.18
Prevention of losses of these nutrients is possible by continuous contour trenches. In order to know the actual benefits and quantification of soil moisture regimes, soil nutrient losses, groundwater recharge and water balance of the treated catchment over the untreated catchment, the present study have been undertaken with the objective of estimation of nutrient losses through treated and untreated micro- catchment.
Study Area
The field experiment was conducted at All India Co-ordinated Research Project for Dryland Agriculture, Dr. Panjabrao Deshmukh Krishi Vidyapeeth, Akola during 2014-15 [17 and 19]. The site is situated at the latitude of 200 43’ North and Longitude of 770 02’ East. The altitude of this place is 307.41m above MSL. The climate of the place is semi-arid and characterized by hot dry summer and cool winter.12 Area of experimental plot was 1 hectare and it is divided into two parts (50×100 m2) each. The micro catchments A and C are treated (T1) with continuous contour trenches (CCTs) and B and D are untreated (T2). The micro-catchment A and B are having Custard apple (Annona squamosa) plantation and micro-catchment C and D are having Atemoya (Annona cherimola) plantation. There are four observation wells viz., well A, well B, well C and well D prepared in each micro-catchment A, B, C and D respectively. Eight moisture tubes viz., M1, M2, M3, M4, M5, M6, M7 and M820 are also installed in these micro-catchments; Two moisture tubes in each micro-catchment i.e. M1 and M2 in A, M3 and M4 in C, M5 and M6 in B and M7 and M8 in D. Green gram has been taken as an inter crop in the perennial plantation in both the micro-catchment. The details of treatments in the micro-catchments are given below.
Materials and Methodology
Available Nitrogen, Phosphorus, Potassium
Available Nitrogen is calculated by alkaline potassium permanganate method.13 Available Phosphorus14 is calculated by NaHCO3 – (0.5) pH 8.5 Colorimetric.16 Available Potassium is calculated by Neutral normal ammonium acetate using Flame photometer.15
Micro Nutrients
DTPA extractable micronutrients (Zn, Fe, Mn and Cu) are calculated.6 The Micro-nutrient meter used for this purpose was shown in Fig.1
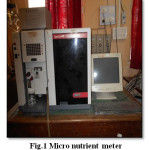 |
Figure 1: Micro nutrient meter Click here to View figure |
pH of soil
pH of soil is calculated by using glass electrode pH meter (Fig. 2).3
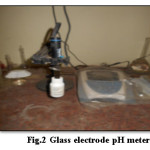 |
Figure 2: Glass electrode pH meter Click here to View figure |
EC of soil
EC of soil is calculated by using electric conductivity meter (Fig.3).3
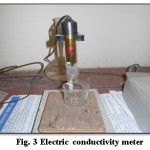 |
Figure 3: Electric conductivity meter Click here to View figure |
Nutrient analysis was done in the laboratory of AICRP for Dryland Agriculture, Dr. PDKV, Akola. Nitrogen, Phosphorus, Potassium and Micro nutrient were calculated in treated (T1) and untreated (T2) micro-catchment. For nutrient analysis soil samples was collected from the field. Four samples from treated (T1) micro-catchment with CCTs and four samples from untreated (T2) micro-catchment.
CCT-C-H-1= First sample of soil in C section of micro-catchment which is treated (T1) by continuous contour trenches and have Atemoya plantation.
CCT-C-H-2=second sample of soil in C section of micro-catchment which is treated (T1) by continuous contour trenches and have Atemoya plantation
CCT-A-S-3=Third sample of soil in A section of micro-catchment which is treated (T1) by continuous contour trenches and have Custard apple plantation.
CCT-A-S-4=Fourth sample of soil in A section of micro-catchment which is treated (T1) by continuous contour trenches and have Custard apple plantation.
NCCT-B-S-5=Fifth sample of soil in B section of micro-catchment which is not treated (T1) by continuous contour trenches and have Custard apple plantation.
NCCT-B-S-6=Sixth sample of soil in B section of micro-catchment which is not treated (T1) by continuous contour trenches and have Custard apple plantation.
NCCT-D-H-7=Seventh sample of soil in D section of micro-catchment which is not treated (T1) by continuous contour trenches and have Atemoya plantation.
Results and Discussion
The soil analysis was done to know the nutrient status of the soils in CCT treated as well as untreated catchment in custard apple and atemoya plantation. The results are presented in Table 1 and 2 for the soils in custard apple and atemoya plantation respectively. From these tables it is observed that the nutrient/ micronutrient status of CCT treated soils is more as compared to untreated soils for both the plantations.
Nutrient losses through custard apple plantation
The nutrient and micronutrient status of the soils in custard apple plantation are depicted in Fig. 5 and Fig. 6 respectively. The pH and EC comparison is depicted in Figures 7 and 8 respectively.
Table 1: Nutrient status in custard apple plantation for CCT treated and untreated micro-catchment.
| Micro-catchment | Nutrient status in custard apple plantation | ||||||||
| N(kgha-1) | P(kgha-1) | K(kgha-1) | MICRONUTRIENT | pH | EC | ||||
| Zn(mgkg-1) | Fe(mgkg-1) | Mn(mgkg-1) | Cu(mgkg-1) | ||||||
| Treated (T1) | 175.6 | 17.03 | 308 | 0.77 | 8.08 | 0.91 | 7.32 | 8.25 | 0.01 |
| Untreated(T2) | 131.7 | 14.42 | 277.3 | 0.65 | 7.45 | 0.7 | 4.57 | 7.94 | 0.13 |
Table 2: Nutrient status in atemoya plantation for CCT treated and untreated micro-catchment
| Micro-catchment | Nutrient status in Atemoya plantation | ||||||||
| N(kgha-1) | P(kgha-1) | K(kgha-1) | MICRONUTRIENT | pH | EC | ||||
| Zn(mgkg-1) | Fe(mgkg-1) | Mn(mgkg-1) | Cu(mgkg-1) | ||||||
| Treated (T1) | 181.88 | 16.47 | 297.58 | 0.79 | 7.67 | 0.91 | 6.60 | 8.20 | 0.12 |
| Untreated(T2) | 144.25 | 14.62 | 288.56 | 0.62 | 7.64 | 0.64 | 5.85 | 8.02 | 0.25 |
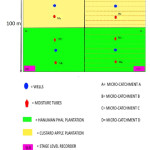 |
Figure 4 Click here to View figure |
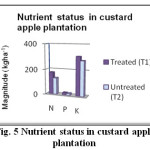 |
Figure 5: Nutrient status in custard apple plantation Click here to View figure |
From Fig.5, it was observed that the nutrient status of treated (T1) micro-catchment in respect of Nitrogen, Phosphorous and Potassium was more compared to untreated (T2) micro-catchment. In treated (T1) micro-catchment Nitrogen, Phosphorous and Potassium was more by 25 %, 15.31% and 9.96% respectively over untreated (T2) micro-catchment.
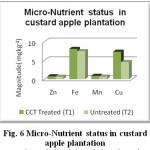 |
Figure 6: Micro-Nutrient status in custard apple plantation Click here to View figure |
From Fig. 6 it is observed that the Micro-nutrient status of CCT treated (T1) micro-catchment in respect of Micro-nutrients viz. Zinc, Ferrous, Magnecium and Copper was more as compared to untreated (T2) micro-catchment. In treated (T1) micro-catchment Zinc, Ferrous, Magnecium and Copper was more by 15.56 %, 7.70%, 23.07% and 37.54% respectively over untreated (T2) Micro-catchment. From Fig. 7 and 8 it is observed that the pH and EC observed more in treated (T1) micro-catchment as compared to untreated (T2) micro-catchment.
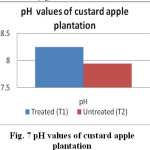 |
Figure 7: pH values of custard apple plantation Click here to View figure |
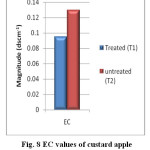 |
Figure 8: EC values of custard apple plantation Click here to View figure |
Nutrient losses through Atemoya plantation
The nutrient and micronutrient status of the soils in atemoya plantation are depicted in Fig. 9 and Fig. 10 respectively. The pH and EC comparison is depicted in Figures 11 and 12 respectively.
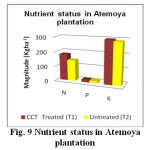 |
Figure 9: Nutrient status in Atemoya plantation Click here to View figure |
From Fig. 9 it is observed that the nutrient status of treated (T1) micro-catchment in respect of Nitrogen, Phosphorous and Potassium was more compared to untreated micro-catchment. In treated (T1) catchment Nitrogen, Phosphorous and Potassium was more by 20.68 %, 11.24% and 3.02% respectively over untreated (T2) micro-catchment.
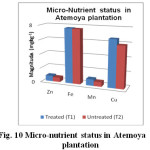 |
Figure 10: Micro-nutrient status in Atemoya plantation Click here to View figure |
From Fig. 10 it was observed that the micro-nutrient status of treated (T1) and untreated (T2) micro-catchment in respect of Zinc, Ferrous, Magnecium and Copper was more in treated (T1) micro-catchment as compared to untreated (T2) micro-catchment. In treated (T1) micro-catchment Zinc, Ferrous,
Magnecium and Copper was more by 21.23 %, 0.64%, 29.67% and 11.35% respectively over untreated (T2) micro-catchment.
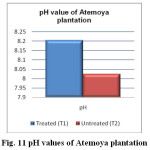 |
Figure 11: pH values of Atemoya plantation Click here to View figure |
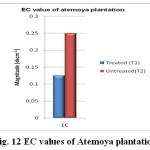 |
Figure 12: EC values of Atemoya plantation Click here to View figure |
From Fig.11 and 12 it is observed that the pH and EC observed more in treated (T1) micro-catchment as compared to untreated (T2) micro-catchment.
Summary and Conclusion
- For custard apple plantation, in treated (T1) micro-catchment Nitrogen, Phosphorous and Potassium content is observed more by 25 %, 15.31% and 9.96% respectively over untreated (T2) micro-catchment. For atemoya plantation in treated (T1) micro-catchment Nitrogen, Phosphorous and Potassium content is observed more by 20.68 %, 11.24% and 3.02% respectively over untreated (T2) micro-catchment.
- For custard apple plantation, in treated (T1) micro-catchment Zinc, Ferrous, Magnesium and Copper is observed more by 15.56 %, 7.70%, 23.07% and 37.54% respectively over untreated (T2) micro-catchment. For Atemoya plantation in treated (T1) micro-catchment Zinc, Ferrous, Magnesium and Copper is observed more by 21.23, 0.64%, 29.67% and 11.35% respectively over untreated (T2) micro-catchment. From these results it is concluded that the CCTs are found effective in preventing nutrient and micro-nutrient losses.
Acknowledgements
The funds were provided by ICAR- AICRPDA, CRIDA, Santoshnagar, Hyderabad for this research and it was carried out at the field of All India Coordinated Research Project for Dryland Agriculture, Dr. Panjabrao Deshmukh Krishi Vidyapeeth, Akola, Maharashtra, India. We are thankful to them for the kind help and financial support.
References
- Bertol I.E.L., Mello, J. Guadagnin, A. Zaparolli, M.R. Carrafa, Nutrient Losses by Water Erosion, J. Scientia Agricola. 2003;60(3):581-586.
CrossRef - Gabhane V.V. and S.M. Taley, Effect of contour cultivation on soil fertility, runoff, soil and nutrient losses and moisture use efficiency of soyabean on Inceptisol under semi-arid Agro-ecosystem, ICON-ARM. pp. 165 (2004).
- Jackson, M.L., Soil Chemical Analysis. Prentice Hall of India Pvt. Ltd., New Delhi. 1973;498.
- Katkar, R.N, S.T. Wankhede, A.B. Turkhede and S. P. Lambe, Effect of integrated nutrient management in cotton grown on shallow soil on growth seed yield and physio-chemical properties, PKV Res. J. 2005;29(1):210-214.
- Lima W.D.P, Overland Flow and Soil and Nutrient Losses from Eucalyptus Plantations, IPEF International, Piracicaba. 1990;(1):35-44.
- Lindsay W.L. and W.A. Norvell, Development of a DTPA soil test for Zinc, iron manganese and copper, Soil Sci. Soc. America J. 1978;42:421-428.
CrossRef - Padmanbhan, M.V, P.K. Mishra and S. Sharma, Soil and water conservation research in rainfed areas, in dryland agriculture Research in India-State of art of Research in India (Eds. Somani L.L, Vittal K.P.R and Venkateswarlu B.) Scientific publishers, Jodhpur. 1992.
- Patil, S.L., Sheelavantar, M.N. and Shashidhar, K.C, Growth and yield of winter sorghum (Sorghum bicolor (L.) Moench) as influenced by rainwater conservation practices, organic materials and nitrogen application in Vertisols of Semi Arid Tropical India, Indian J. Soil cons. 2011;39(1):50-58.
- Pilbeam C.J, Tripathi B. P, Sherchan D. P, Gregory P.J and Gaunt J., Nitrogen balances for households in the Mid-Hills of Nepal, Agric. Eco. Syst. Environ. 2000;79:61–72.
CrossRef - Sahrawat K. L, S. P. Wani, P. Pathak, T. J. Rego, Review: Managing natural resources of watersheds in the semi-arid tropics for improved soil and water quality: A review. Agric Water Manage. 2010;(97):375-381.
CrossRef - Soil Survey Staff, Key to soil taxonomy, 6th Edn. Soil Conservation Service, U. S. Dept. Agric., Washington D.C. 1994.
- Surendran, U., V. Ramesh, M. Jayakumar, S. Marimuthu, and G. Sridevi., Improved sugarcane productivity with tillage and trash management practices in semi arid tropical agro ecosystem in India. 2016;158:10-21.
- Subbaiah, B.V. and Asija, G.L., A rapid procedure for the estimation of available nitrogen in soil. Curr. Sci. 1956;25: 259.
- K. N. Singh, B. Prasad and S. K. Sinha, Effect of integrated nutrient management on a Typic Haplaquant on yield and nutrient availability in a rice-wheat cropping system, Australian Journal of Agricultural Research. 2001;52(8):855-858.
CrossRef - Knudsen, D., Peterson, G. A. and Pratt, P. F., Lithium, sodium, potassium. In Methods of soil analysis, part 2, ed. A. L. Page. Madison, Wisc., ASA-SSSA. 1982.
- Watanabe F.S. and S.R. Olsen, Test of ascorbic acid methods, For determining phosphorus in water and sodium bicarbonates extracts of soils. Proc. Soil. Sci. Soc. Am. 1965;677-678.
CrossRef - www.crida.in.
- www.en.wikipedia.org.
- www.bsmconf.in.
- www.sofkov.ru.