

Introduction
Maize is an exhaustive feeder of nutrients; its nutrients requirements are high. The demand of nitrogen fertilizer is greater than that of the other nutrients. If nitrogen deficiency occurs at tasseling and silking stages may significantly affect crop failure. However, amount of nitrogen to be applied for maize plant depends upon maize variety, soil type, crop fertility status, location and yield.1
During previous studies found that days to 50% silking increased with increasing plant population.2 The silking date was delayed as plant density increased from 55000 to 85000 plants/ha.3 However, it is also noticed that the anthesis and silking time interval increased with increasing plant density.4
The key component for a high yield of corn is nitrogen fertilizer application.5 The amount of nitrogen applied mainly depends to a large extent on the plant density of the plants/unit of cultivated land area. The higher grain yield can be achieved at an optimal high plant population with enough nutrient specially nitrogen application.
Sharma and Gupta6 It has been reported that under low plant densities smaller nitrogen rates produced maximum grain yield (100 kg N/ha for 40 and 50 thousands plants/ha) while under higher plant densities only maximum dose of nitrogen (200 kg N/ha for 60 and 70 thousands plants/ha) produced maximum yield.6 A positive interaction between nitrogen and plant density was found and highest yields were recorded with plant densities of 60000 and 75000 plants/ha and N rate of 100-200 kg/ha.7
For maximizing grain yield, maintaining of optimum plant populations is essential since grain yield is the result of final plant population. At a very low plant population density, plants cannot utilize resources effectively and that results low grain yield. With a greater population of plants, grain yield decreases mainly due to an increase in the number of broken grains and/or infertile stems. A larger population of plants reduces the amount of light, moisture, nutrients and other environmental resources that ultimately reduce grain yield. The content of the maize plants at the farmer’s field conditions is below the recommended level and consequently, reduces the yield. This is one of the reasons for the decline in maize yield in Nepal.
This study was carried out to determine the effect of various levels of nitrogen application and plant density on the crop phenology and grain yield.
Materials and Method
Detail of Genetic Material and Experimental Site
The impact of various levels of nitrogen application and plant densities on phenology and grain yield of maize was assessed by using the variety of “Rampur Composite” from September 2006 to February 2007 at Mangalpur VDC-3, Anandapur, Chitwan, Nepal. The geographical location of the experiment is 256 meters above sea level, 27° 37 ‘ latitude, 84° 25’ E longitude and has subtropical climate. This maize variety was received from National Maize Research Program, Rampur, Chitwan, Nepal.
At Soil Science Division, Khumaltar, soil of the experimental field was tested before planting of maize seeds. The laboratory results showed that the soil of experimental field was medium in total nitrogen (0.123%), high in phosphorous (77.56 kg/ha), low in potassium (23.25 kg/ha) and strongly acidic soil (pH 5.13). The texture of soil was sandy silt loam having high in organic matter content (1.85%).20
Monthly mean weather data was recorded from September 2006 to February 2007 during the crop growing period. The mean maximum temperature 27.630C and minimum temperature 14.800C were recorded. Maximum temperature ranged from 22.30C (January 2007) to 33.40C (September 2006). The minimum temperature ranged from 7.80C (January 2007) to 24.080C (September 2006). Similarly, relative humidity ranged from 83.5% during October 2006 to 100% during September 2006. The highest rainfall (362 mm) during September 2006, the lowest rainfall (2.1mm) during November 2006 and no rainfall during January 2007 were recorded. The total rainfall during crop growing season was 524 mm.
Experimental design and cultural practices
Two factorial randomized complete block design with three replications was used to evaluate effects of five levels of nitrogen application (0, 50, 100, 150 and 200 kg N/ha) and three levels of plant density (55555, 66666 and 83333 plants/ha) on maize, thus in total fifteen treatment combinations were used in this study.
The distance between the plants were 30, 25 and 20 cm in plant densities of 55555, 66666 and 83333 plants/ha, respectively. The net harvested plot area was 7.2 m2 (5 rows 3 m long).The recommended dose of phosphorous @ 60 kg/ha, potassium @ 40 kg/ha and poultry manure @ 5 t/ha were applied as basal in all experimental plots. The first half dose of nitrogen was used at the time of sowing, the remaining half dose of nitrogen further divided into two equal amounts; one half was side dressed at knee high stage and remaining dose was side dressed at tasseling stage.
Data Measurement and Statistical Analysis
Data were recorded on days to tasseling, silking, physiological maturity and grain yield.
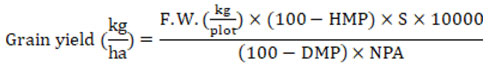
Where,
F.W. = Fresh weight of ear in kg per plot at harvest
HMP = Grain moisture percentage at harvest
DMP = Desired moisture percentage, i.e. 15%
NPA = Net harvest plot area, m2
S = Shelling coefficient, i.e. 0.8
This formula was adopted to adjust the grain yield (kg/ha) at 15% moisture content.10,11
Analysis of variance for observed data was analyzed using MSTAT-C computer software package and they were subjected to Duncan’s Multiple Range Test (DMRT) for mean comparison at 5% level of significance. All data collected were used to analyses of variance.17
Results and Discussion
Phenological Observations
Days to Tasseling
The number of days to tasseling was influenced by various nitrogen levels and plant population (Table 1).
The effect of N and plant population on days to tasseling was significant (p < 0.05). Significantly shortest period to tasseling (47.0 days) under 200 kg N/ha and the longest period to tasseling (52.1 days) under 0 kg N/ha were recorded. A similar results were noted in earlier studies as application of nitrogen and increase in its rate induced earliness both in tasseling and silking stages.12,13 The advance in days to tasseling with higher level of nitrogen was due to quick growth.
As similar to N levels, the days to tasseling under 55555 plants/ha was significantly lower (49.0 days) than that obtained under 83333 plants/ha (50.13 days).
There was non-significant (p>0.055) interaction effects of various nitrogen and plant population on days to tasseling.
Days to silking
The number of days to silking was influenced by various nitrogen levels and plant population (Table 1).
The effect of N and plant population on days to silking was significant (p < 0.05). The shortest period to silking (52.22 days) under 200 kg N/ha and the longest period to silking (61.22 days) under 0 kg N/ha were noted. In earlier studiesreported that the increasing rates of nitrogen reduced the days for silking12 and application of increasing levels of nitrogen induced earliness both in tasseling and silking stages.13 The advance in days to silking with higher level of nitrogen was due to quick growth.
Significantly shortest period to silking (55.0 days) under 55555 plants/ha and longest period to silking (56.06 days) under 83333 plants/ha were recorded.
The interaction between various nitrogen levels and plant population on days to silking was non-significant (p>0.05).
Days to physiological maturity
The number of days to physiological maturity was affected by various nitrogen levels and plant populations (Table 1).
The increasing rate of nitrogen application significantly (p<0.05) increased the number of days to physiological maturity. The shortest period to physiological maturity (130.44 days) under 0 kg N/ha and the longest period to physiological maturity (133.66 days) were observed under 200 kg N/ha application. It could be due to the application of 200 kg N/ha plants were remained green for longer period, which resulted in longer maturity period.
The lowest period to physiological maturity (131.46 days) recorded under 55555 plants/ha, which was significantly lower than that obtained under 83333 plants/ha (132.66 days).
Table 1: Influence of various levels of nitrogen and plant densities on phenology and grain yield of maize during 2006-07.
| Treatment | Tasselling (days) | Silking (days) | Physiological maturity (days) | Grain yield (kg/ha) |
| Nitrogen level (kg N/ha) | ||||
| 0 | 52.11a | 61.22a | 130.44e | 2557.28e |
| 50 | 51.22b | 56.33b | 131.33d | 4145.77d |
| 100 | 49.44c | 54.33c | 132.00c | 5235.84c |
| 150 | 48.00d | 53.22d | 132.66b | 6027.05b |
| 200 | 47.00e | 52.22e | 133.66 a | 6514.48a |
| SEm (±) | 0.171 | 0.157 | 0.112 | 71.2 |
| LSD(0.05%) | 0.497 | 0.457 | 0.324 | 206.3 |
| CV (%) | 1.04 | 0.85 | 0.25 | 4.36 |
| Plant density (Plants/ha) | ||||
| 55555 | 49.00c | 55.00b | 131.46c | 4425.92b |
| 66666 | 49.53b | 55.33b | 131.93b | 5113.46a |
| 83333 | 50.13a | 56.06a | 132.66a | 5148.88a |
| SEm (±) | 0.132 | 0.122 | 0.086 | 55.16 |
| LSD(0.05%) | 0.385 | 0.354 | 0.251 | 159.8 |
| CV (%) | 1.04 | 0.85 | 0.25 | 4.36 |
The common letter within same column indicates means are non significant at 5% level of significance
There was increasing level of grain yield with the increasing level of physiological maturity. Days to tasseling and silking are negatively correlated with grain yield; with decreasing level of flowering, grain yield was increasing. In another studies recorded that days to tasseling and days to silking were negatively and significantly associated with grain yield.18,19
The interaction effects of various levels of nitrogen and plant densities on number of days to physiological maturity (Table 2) showed that the highest number of days to physiological maturity (135 days) noted under 200 kg N/ha + 83333 plants/ha, which was significantly (p<0.05) higher than that under the rest of treatments. Significantly lowest days to physiological maturity (130 days) was observed under 0 kg N/ha + 55555 plants/ha. With increasing level of nitrogen, there was delay in physiological maturity due to higher nitrogen content in leaves that caused delay in drying of leaves. Under increasing level of plant population, the delay in physiological maturity was due to longer growth period.
Table 2: Interaction effect of various nitrogen levels and plant densities on physiological maturity and grain yield of maize during 2006-07.
| Nitrogen level | Plant density (Plants/ha) | |||||
| 55555 | 66666 | 83333 | ||||
| (kg N/ha) | Physiological maturity (days) | Grain yield (kg/ha) | Physiological maturity (days) | Grain yield (kg/ha) | Physiological maturity (days) | Grain yield (kg/ha) |
| 0 | 130h | 2281.60i | 130.33h | 2808.39h | 131g | 2581.86hi |
| 50 | 131g | 3567.49g | 131g | 4541.61f | 132ef | 4328.23f |
| 100 | 131.66f | 4572.06f | 132ef | 5348.52e | 132.33de | 5786.95cd |
| 150 | 132ef | 5655.48de | 133bc | 5943.01cd | 133bc | 6482.67b |
| 200 | 132.66cd | 6052.95c | 133.33 b | 6925.79a | 135a | 6564.71b |
| SEm (±) | 0.1941 | 123.35 | ||||
| LSD (0.05%) | 0.562 | 357.3 | ||||
| CV (%) | 0.25 | 4.36 | ||||
The common letter within same column indicates means are non significant at 5% level of significance
Grain yield
In another study recorded non-significant effects of nitrogen levels of 60, 90, 120 kg/ha and plant population of 53000, 71000 and 95000 plants/ha on early and late maize varieties in summer season, whereas, their effects were significant in winter season.8 The highest grain yield (9352 kg/ha) was produced when applied fertilizer @ 120 kg N/ha at plant density of 53333 plants/ha and the grain yield was lowest (6657 kg/ha) while using fertilizer @ 60 kg N/ha at plant density of 44444 plants/ha.9
The grain yield (6514.48 kg/ha) was significantly (p<0.05) highest under nitrogen level of 200 kg N/ha and the lowest grain yield (2557.28 kg/ha) was produced under 0 kg N/ha (Table 1).The grain yield significantly increased with the increase in rate of nitrogen from 0 to 200 kg/ha.
Maize yield increased significantly with a subsequent increase in nitrogen level from 0 to 90 kg N/ha.12 Similarly, the plant density of 66 666 plants/ha (60 cm × 25 cm) produced the significantly higher grain yield (5113.46 kg/ha) than that produced with 55555 plants/ha (60 cm × 30 cm ), but was at par with the grain yield produced at 83333 plants/ha (distance 60 cm ×20 cm).
At higher plant population, the availability of light, moisture and other environmental resources to plants decreased, which resulted in lower grain yield. When plant population per unit area increased then grain yield per plant was decreased.14 Under higher plant density, the reduction in grain yield was due to lower number of ears,15 fewer kernels/ear,16 lower kernel weight or a combination of these components.
The interaction between various levels of nitrogen and plant densities on grain yield was significant (p<0.05) (Table 2). The research findings indicated that grain yield increased with increase in N and plant population levels. However, under 100 and 150 kg N/ha, higher grain yield was obtained with 83333 plants/ha, the highest grain yield (6925.79 kg/ha) was obtained with the application of 200 kg N/ha in population of 66666 plants/ha, followed by 6564.71 kg/ha with 200 kg N/ha and population of 83333 plants/ha and 6482.67 kg/ha with 150 kg N/ha and population of 83333 plants/ha. The lowest grain yield (2281.60 kg/ha) was obtained under 0 kg N/ha with 55555 plants/ha, followed by 2581.86 kg/ha under 0 kg N/ha with 83,333 plants/ha. Comparatively lower grain yields were obtained under control than that of nitrogen application. Under 200 kg N/ha, there was slight reduction in grain yield when plant population was increased from 66666 to 83333 plants/ha. This was due to lodging of plants that occurred at milk stage.
Table 3: Mean squares (from ANOVA) for tasseling, silking and physiological maturity of maize during 2006-07 .
| Source | df † | Tasseling (days) | Silking (days) | Physiological maturity (days) | Grain yield (kg/ha) |
| Replication | 2 | 0.956* | 0.200 | 13.089** | 51184.58 |
| Nitrogen (N) | 4 | 41.111** | 114.133** | 13.689** | 22605075.42** |
| Plant population densities (P) | 2 | 4.822** | 4.467** | 5.489** | 2491645.85** |
| N×P | 8 | 0.211 | 0.133 | 0.489** | 186523.73 ** |
| Error | 28 | 0.265 | 0.224 | 0.113 | 45647.85** |
| Total | 44 |
Degree of freedom, * Significant at 0.05 level of significance, ** Significant at 0.01 level of significance
The above ANOVA (Table 3 ) showed that tasseling, silking days and physiological maturity and grain yield were highly significant with the application of nitrogen and plant population but the interaction (nitrogen × plant population) effect for tasseling and silking days were found non-significant but for physiological maturity and grain yields were found highly significant.
Relationship between grain yield and yield components of maize
Simple linear regression analysis showed that the coefficient of determination (R2) for number of cobs/plant, cob diameter (cm), cob length (cm), number of grains/grain row, number of grain rows/cob, number of grains/cob, test weight (g) and shelling recovery (%) were 0.961, 0.918, 0.965, 0.980, 0.905, 0.955, 0.960 and 0.907, respectively. All these R2 values were significant at 1% level. This indicated that there was higher contribution of these yield components to increase the yield of grain (Table 4).
The bivariate correlation analysis showed that yield components of maize namely number of cobs/plant, cob length, cob diameter, number of grains/grain row, number of grain rows/cob, test weight and shelling recovery (%) were positively and highly correlated with grain yield (r = 0.981), (r = 0.982), (r = 0.958), (r = 0.990), (r =0.952), (r = 0.980) and (r = 0.953), respectively (Table 5).This indicated that the grain yield increased if values of these yield components are increased.
Table 4: Assessment of relationship between grain yield and yield components of maize during 2006-07.
| Variable | Regression coefficient (β) | R2 value |
| Number of plants/ha | 0.932 | 0.519 |
| Number of cobs/plant | 44149 | 0.961 |
| Cob diameter (cm) | 4413.1 | 0.918 |
| Cob length (cm) | 658.59 | 0.965 |
| Number of grains/grain row | 345.82 | 0.980 |
| Number of grain rows/cob | 1849.4 | 0.905 |
| Number of grains/cob | 19.038 | 0.955 |
| Test weight (g) | 50.177 | 0.9602 |
| Shelling recovery (%) | 455.81 | 0.9077 |
Table 5: Correlation between yield and yield attributing components of maize during 2006-07.
| Parameters | Cbn/Pl | CL | CD | Grn/Rw | Rn/cb | TW | GY |
| Pln/ha | 0.638 | 0.627 | 0.557 | 0.648 | 0.532 | 0.629 | 0.720 |
| Cbn/Pl | 0.992** | 0.977** | 0.986** | 0.981** | 0.999** | 0.981** | |
| CL | 0.994** | 0.997** | 0.992** | 0.997** | 0.982** | ||
| CD | 0.988** | 0.998** | 0.987** | 0.958* | |||
| Grn/Rw | 0.983** | 0.991** | 0.990** | ||||
| Rn./cb | 0.989** | 0.952* | |||||
| TW | 0.980** | ||||||
| GY |
** Correlation is significant at the 0.01 level and * Correlation is significant at the 0.05 level.
Pln/ha = Number of plant/ha, Cbn/Pl = Number of cobs/plant, CL= Cob length (cm), CD = Cob diameter (cm) Grn/Rw = Number of grains/grain row, Rn./cb = Number of grain rows/cob, TW = test weight (g), GY = Grain yield (kg/ha).
Conclusion
Nitrogen fertilizer application and plant population levels had profound effects on crop phenology and grain yield of maize. Silking, tasseling days decreased and maturity, grain yield increased with increasing level of nitrogen (200 kg N/ha) whereas, these all traits increased with increasing level of plant population (83333 pants/ha). The highest grain yield (6925.79 kg/ha) was obtained with the application of 200 kg N/ha in population of 66666 plants/ha. Therefore, the use of this level of nitrogen and plant density is beneficial to get the higher maize production.
Acknowledgements
Authors extend their profound thanks to Directorate of Research (DOR), Tribhuvan University, Institute of Agriculture and Animal Science (IAAS), Rampur, Chitwan, Nepal for providing funds to carry out this extensive research.
Conflict of Interest
There are no known declared conflicts of interest related with this piece of research work.
References
- Singh N. P., Singh R. A. Scientific Crop Production. 1st ed. Kalyani Publisher New Delhi, India. 2002; 111-117.
- Athar, M. Influence of nitrogen fertilizer and plant density on some physiological aspects and grain yield of maize (Zea mays L.). Dissertation Abstracts International. 1979; 40:2524.
- Aguila, C. A., Viol Ic, M. A. and Gebauer, B. J. E. Effects of plant density and inter-row spacing on the yield and other characteristics of two maize hybrids (Zea mays L.). Agricultura Tecnica Chile. 1971; 31:11.
- Lemcoff, J. H. and Loomis, R. S. Nitrogen influences on yield determination in maize. Crop Science, Madison. 1986; 26(5):1017-1022.
CrossRef - Gehl, R. J., Schnidt, J. P. , Maddux, L. D. and Gordon, W. B. Corn yield response to nitrogen rate and timing in sandy irrigated soil. Agron. J. 2005; 97:1230-1238.
CrossRef - Sharma K. C., Gupta P. C. Effect of plant population densities and rates of nitrogen on the performance of hybrid maize. Indian J. Agron. 1968; 13:76-82.
- Ramirez, I. S. Effect of plant density and nitrogen levels on yield of hybrid maize. Agricultural Tec. 1965; 25: 155-162.
- Srinivatav S. P., Neupane D. D., Batsa B. K., Adhikari K. Response of early and late maize varieties to various levels of N and plant populations on summer and winter. In: K. Adhikari and B. K. Batsa (eds.) Proceedings of 22nd National Summer Crops Workshop on Maize Research in Nepal. 2002; 225p.
- Adhikari B. H., Sherchan D. P., Neupane D. D. Effects of nitrogen levels on the production of maize (Zea mays L.) planted at varying populations in Chitwan valley. In: D. P. Sherchan, K. Adhikari, B. K. Bista and D. Sharma (eds.) Proc. of the 24th National Summer Crops Research Workshop in Maize Research and Production in Nepal held in June 28-30, 2004 at NARC, Khumaltar, Nepal. 2004; 216-219.
- Carangal, V.R., Ali, S.M., Koble, A.F., Rinke, E.H. and Sentz, J.C. Comparison of S1 with testcross evaluation for recurrent selection in maize. Crop Science. 1971; 11: 658-661.
CrossRef - Shrestha, J., Koirala, K., Katuwal, R., Dhami, N., Pokhrel, B., Ghimire, B., Prasai, H., Paudel, A., Pokhrel, K., and KC, G. Performance evaluation of quality protein maize genotypes across various maize production agro ecologies of Nepal. Journal of Maize Research and Development. 2015; 1(1): 21-27.
CrossRef - Yadav, D. N. Growth and productivity of maize under different crop sequences and nitrogen rates. Thesis, Ph.D. G. B. Pant Univ. of Agric. and Tech., Pantanagar, India. 1990.
- Rai, K. D. Response of maize following sorghum to fertilizers and foliar spray of zinc sulphate at Tozi, Sudan. Indian J. Agron. 1961; 5(1): 176-187.
- Duncan, W. G.. The relationship between corn population and yield. Agron. J. 1958; 50: 82–84.
CrossRef - Bunting, E. S. Plant density and yield of grain maize in England. J. Agric. Sci. (Cambridge). 1973; 81: 455–463.
CrossRef - Baenziger, P. S. and Glover, D. V. Effect of reducing plant population densitieson yield and kernel characteristics of sugary-2 and normal maize. Crop Sci. 1980; 20: 444-447.
CrossRef - Gomez, K.A. and Gomez, A.A. Statistical Procedures for Agricultural Research. John Wiley and Sons. New York. 1984; Pp. 680.
- Ramanadane, T., Krishnasamy, V., Ramamoorthi, N. and Thirumeni, S. Effects of seed ageing on association between yield and its components in maize (Zea mays L.) hybrids. Madras Agric. J. 2000; 87(1-3): 61-66.
- Venugopal, M., Ansari, N.A. and Rajanikanth, T. Correlation and path analysis in maize (Zea mays L.). Crop Res. 2003; 25(3): 525-529.
- Shrestha, J. Growth and Productivity of Winter Maize (Zea mays L.) Under Different Levels of Nitrogen and Plant Population. Dissertation.com, Boca, Raton, Florida, USA: (2015). http://www.bookpump.com/dps/pdf-b/2334407b.pdf.