

Introduction
Reservoirs are the major inland fisheries resources in India. These open water bodies hold tremendous potential for optimizing the fish production in the country. India has 19,134 small reservoirs, 180 medium reservoirs and 56 large reservoirs with a total area of 3.54 million ha which offers single most important inland fisheries resource for the country in terms of resource size and production potential.1 Gobind Ballabh Pant Sagar (GBS), also known as Rihand reservoir and located in the Vindhya region is the largest reservoir in Uttar Pradesh. It was constructed in 1962 on the river Rihand, a tributary to Son which in turn joins the Ganga on its right flank, mainly for the purposes like irrigation, flood control, electricity generation with fishery being incidental to this.7 Rihand reservoir lies in the Renukoot – Singrauli – Sonbhadra industrial region in extreme south-east of Uttar Pradesh at the junction of Uttar Pradesh, Bihar, Jharkhand, Chhattisgarh and Madhya Pradesh states.6
Many scientific studies have been carried out in past years on several reservoirs of country covering species diversity, limnology, environment and ecology, socio-economics and fisheries management.2,3,4,5,6,7,8,9 Rihand reservoir was subjected to scientific investigation during 1970s and 1980s,10, 11 though recently only physico-chemical aspects on this reservoir have been studied.7 In spite of beingonly large reservoir (>5000 ha) of Uttar Pradesh providing livelihood to thousands of villagers living around the reservoir (author’s observation during primary field data collection), there is dearth of literature available particularly on the governance and fisheries management status. Hence, the present study was taken up to understand the current status of fisheries and its management while simultaneously delineating the changes that had happened during the intervening period of three decades with respect to fish species diversity, trophic status and catch trends within the specific fisheries management and governance regime in vogue.
Materials and Methods
The fisheries management status of Rihand reservoir was documented by analysing the data obtained from both primary and secondary sources. Key informants among fishers and State Department of Fisheries (DoF) staff working in the reservoir were the primary sources. Semi-structured personal interviews were conducted with key primary sources to obtain vital information related to various aspects of the reservoir fisheries and its management since its formation. Apart from available literature, information obtained from DoF records were also critically reviewed. These departmental records maintained by the Inspector of Fisheries, Rihand Dam, served as the major secondary data source and has the disaggregated fish catch as well as fish seed stocking (total and species-wise) details of the reservoir. In order to make a comparative analysis of fisheries status of Rihand reservoir, the fish catch data and fish species details were referred for two-time periods i.e. from 1971-1981 and 2000-2016. The data not available for the intervening period of 1983 to 1999. The data on fish catch, species availability and water quality parameters for the time-period 1971-72 to 1980-81 was primarily drawn from the studies carried out and published by CIFRI, Barrackpore. The data on fish catch and species availability for 2000-01 to 2015-16 period were collected and compiled by the author from the monthly fish catch records of fisheries department. Since the water quality parameters are not assessed on regular basis either by fisheries department or any research organisation, authors relied on the literature and data available in the public domain from independent studies7 for understanding the water quality in recent years. The collected data was then subjected to relevant statistical analysis to draw meaningful conclusion. Rihand reservoir was once known as “Catla mine” (during 1970s and 1980s) owing to the higher composition of catla catch in total fish catch of reservoir. Hence, in order to understand if catla fisheryis still dominant, a long term trend analysis of catla catch (from 1971-2016) was carried out. The various statistical analyses that were carried out are summarised briefly below.
Average annual growth rate (AAGR)
First, we calculated the annual growth rate of fish production over the 15 years, then the AAGR was calculated by taking the arithmetic mean of all the 15 years growth rates. It is the arithmetic mean of series of growth rates that does not take into account the effect of compounding.
Compound annual growth rate (CAGR)
CAGR is the mean annual growth rate of a variable (here catch) over a specified period of time longer than one year. Compound annual growth rate has been calculated from 2000-01 to 2015-16 accounting for intra year variations in fish catch. Here, CAGR has been calculated at 5 years interval from 2000-2016 to know the cumulative variation in the growth of fish production over a period of 15 years.
Where N= no. of years
Water quality parameters
The published literature2, 7, 10, 11between 1975 and 2017 were reviewed for understanding the status of water quality including pollution status12 and certain ecological aspects of Rihand reservoir. The very purpose was to assess the extent of change in them over the last 3 decades as these parameters impinge upon the fish species diversity as well as fish catch thereby affecting the livelihoods. The most recent study7 evaluates water quality in different seasons, summer (March-May), monsoon (August), post-monsoon (October) during August 2007 to October 2009. Here, we present a comparative perspective of the present water quality status of reservoir (2012) as against the past status gleaned from earlier studies on the same.10, 11 Following water quality parameters were studied: Temp (oC); Total alkalinity (mg/l); Specific conductivity (mmhos); Calcium (mg/l); pH; Nitrate (mg/l); Phosphate (mg/l); Silicate (mg/l); Chlorides (mg/l); Transparency (cm); DO (mg/l); CO2 (mg/l); Total Hardness (mg/l); Fluoride (ppm); Mercury (ppm).For water quality estimation methodology and protocol, please refer to the respective studies as the scope of this paper is limited to contextualise the status of aquatic environment in the reservoir in relation to the dynamics of fish diversity, fish catch and fishers’ livelihoods.
Shannon-Wiener Index
The most common index of diversity, the Shannon-Wiener index (1949) was used to estimate the extent of fish species richness, diversity in the reservoir. The index was for two different time periods (1971-72 and 2015-16).
![]()
where,
pi is the proportion of individuals found in species I, for a well-sampled community, we can estimate this proportion as pi = ni/N
ni is the number of individuals in species i
N is the total number of individuals in the community
In is the natural logarithm
The pis will all be between zero and one, the natural log makes all of the terms of the summation negative, which is why we take the inverse of the sum. Typical values are generally between 1.5 and 3.5 in most ecological studies, and the index is rarely greater than 4. The Shannon index increases as both the richness and the evenness of the community increase.
Trophic status
A composite measure consisting of phosphorus and pH range for trophic status of the reservoir were determined based on comprehensive review of literature. The standard classification13 was followed wherein the reservoirs are classified based on phosphorus content as Oligotrophic (<0.0079 mg/l), Oligo mesotrophic (0.008-0.011 mg/l), Mesotrophic (0.012- 0.027mg/l), Meso-eutrophic (0.028- 0.39 mg/l) and Eutrophic (>0.040 mg/l). Another approach that uses pH range for classification14of Indian reservoirs into low productive (<6), medium productive (6-8.5) and highly productive (>8.5) was also adopted to understand the status of Rihand reservoir.
Species composition and Trophic status
Species wise catch details in Rihand reservoir over the past 15 years were collected primarily from the DoF for 2000-01 to 2015-16, and from published secondary sources for earlier years. The trophic level value for each of the fish species in the composition was obtained from the trophic analysis of River Cauvery available online in the fishbase.org website, since no such reference database is available for River Son. In the analysis, based on their trophic level values, fishes were classified into four categories: Omnivores, Herbivores, Detritivores (2-2.9); Mid-level Carnivores (2-3.9); High-level Carnivores (4-4.9); and Top predators (5 and above). From the collected fish catch data, each fish species was placed in one of the four categories of trophic level based on their trophic level score, and the contribution of fish species in each trophic level to the total fish catch per annum were calculated using percentage analysis.
Trophic structure and trophic matrix score
Based on the feeding habitat, fishes were classified into various trophic groups.15, 16 Four types of trophic level of fishes were considered (planktivorous=PL, benthic feeder=BE, omnivorous=OM, carnivorous=CA). The trophic level score indicated the relative frequency of the fish using a particular trophic level among all the trophic levels available in that aquatic system.17, 18, 19, 20 For example, there were 15 species of carnivorous fish in the Rihand reservoir during 1972-73 out of a total of 40 species. The score is thus 100× (15/40) or 37.5.
Results And Discussion
A reservoir’s geographic and morphometric features play a major role in determining the productivity of the reservoir14. The development of Sonbhadra began during 1950 with construction of two dams Rihand and Obra. Hindalco Aluminium Plant (1962), Kannoria Chemicals (1964) and a cement factory (1970) followed by a number of coal, stone, mining projects and power generation units changed the scenario for ever and impacted human socio-cultural environment very significantly. The major morphometric and hydrographic details of Rihand reservoir are presented in Table 1.
Table 1: Morphometric and hydrographic features of Rihand reservoir
| Particulars |
Rihand reservoir |
| Location of dam | 9 km. from Renukoot in Sonbhadra district, U.P. |
| River | Rend or Rihand (Son) |
| Year of construction | 1956- 1962 (completed) |
| Total surface area (ha) | 46,538 (FRL) |
| Effective area (ha) | 30,148 |
| Dead storage level (ha) | 13,759 |
| Height of dam (in feet) | 294 |
| Length of dam (km) | 48 |
| Water holding capacity in full reservoir level (million acre feet) | 8.6 |
| Water holding capacity in lowest reservoir level (million acre feet) | 1.326 |
| Catchment area (km2) | 13,344 |
| Type of reservoir (size) | Large |
| Type of reservoir | Concrete gravity dam |
| Purpose of construction | irrigation, flood control, fishery and wild life conservation and power generation (300 MW) |
|
Reservoir capacity (million metric cube) |
10625 (at FRL) |
Water quality parameters, ecology and trophic structure of Rihand reservoir
The environmental variables such as temperature, pH, alkalinity, nitrogen, phosphate, total hardness of water and other micronutrients present in the water play a decisive role in determining the phytoplankton production and density, thereby directly determining fish availability and growth in the reservoir.As outlined in methodology section, this paper presents the results from earlier studies on water quality of Rihand reservoir in a comparative perspective (Table 2) to understand the extent of change in various parameters.
Table 2: Changes in water quality parameters over the years in Rihand reservoir2;7;10;11;12
| Water quality parameters | 1980 | 2012 |
| Temp (oC) | 19.9-31.1 | 28-34 |
| Total alkalinity (mg/l) | 28-60 | 50-170 |
| Specific conductivity (mmhos) | 92.24 | 70-200 |
| Calcium (mg/l) | 6.2-14.8 | 7.5-23.5 |
| pH | 7.0-8.8 | 6.8-8.6 |
| Nitrate (mg/l) | 0.15-0.70 | 0.2-0.42 |
| Phosphate (mg/l) | Tr-0.65 | – |
| Silicate (mg/l) | 14.0 | 3.5-11.0 |
| Chlorides (mg/l) | 6-20 | 6-37 |
| Transparency (cm) | 1.8-28.5 | – |
| DO (mg/l) | 3.0-10.0 | – |
| CO2 (mg/l) | 2-34 | – |
| Total Hardness (mg/l) | 8.4-21.6 | – |
| Fluoride (ppm) | – | 0.0-2.1 |
| Mercury (ppm) | – | 0.003-0.026 |
From table 2, it could be seen that there have been notable increase in certain water quality parameters (Temperature, total alkalinity, specific conductivity, calcium) while the values of some parameters (pH, nitrate, silicate, chlorides) were found to be almost unaltered over the years. Among all the physical parameters, temperature is one of the most important ecological factor, which controls the physiological behaviour and distribution of living organisms. The minimum temp has increased over 8 oC between 1980 and 2012, it was still found to be favourable for growth of overall plankton population. High water temperature was due to discharge of effluents and fly ash from the NTPC thermal power plant and other industries located in the vicinity. In some cases, heated TPP discharge appears to have elevated the water temperature by 8 to 10 °C, which is said to be favourable for aquatic animals to survive during winter season.
Water pH is important for biotic community because most of the plant and animals can survive in a narrow range of pH from slightly acidic to moderately alkaline condition.21 The pH range of Rihand reservoir was found to range between 6.8 and 8.6 which is conducive for productivity and fish health. Higher range of pH indicates higher productivity of water.22 However, the abundance of planktons depends not only on factors like temperature, light, pH and alkalinity but also on the overall environment of reservoir. The micronutrients which are essential for the growth of plankton population (nitrate, phosphorous, silica, free CO2, dissolved oxygen, specific conductivity etc.) were found to be less in Rihand reservoir water.7 Above all, seasonal variations also determine the abundance of plankton population in a reservoir. For instance, studies23 in Baigul reservoir of Uttarakhand indicate that phytoplankton population was higher during June (pre-monsoon) and November (post-monsoon) periods and low during monsoon season (July- September). The Rihand reservoir receives its rainfall mainly from South West monsoon (June – September). The overall physical and chemical feature of water placed the reservoir in mesotrophic status with moderate level of primary production.
Pollution status of reservoir water and nearby areas
The reservoir receives heavy pollution from the industries situated around the reservoir periphery (NTPC, HINDALCO, Kannoria Chemicals, Coal and limestone Mining industries, Cement industries). The chloride content of the reservoir water was also found to be higher (table 2). The fluoride content of the samples from fluoride affected area was 2.1 times higher than the desirable limit of 1.0 ppm. Similarly, mercury was found to be 26 times higher than the permissible limit of 0.001 ppm. Collected fish samples (Rohu) were found to contain methyl mercury almost double the standard (0.25 ppm calculated as the element) set by FSSAI. The results of the water, soil and fish samples do indicate pollution due to mercury, arsenic and fluoride. The concerned study, examining the health of residents living around the reservoir area, indicated ill-effects of mercury poisoning as a result of burning of huge amount of coal for power generation12.
Shannon-Wiener (S-W) Index
The results obtained from this index (fig.1) shows a noticeable decline in species diversity between 1971 (H=2.94) to 2016 (H=2.59), with significant loss in species richness during the same period i.e. from 40 species, 28 genera and 11 families in 1971 to 22 species,16 genera and 8 families in 2016.
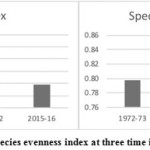 |
Figure 1: S-W index and species evenness index at three time intervals. Click here to View table |
Trophic metrics
Trophic study of a reservoir gives a picture about the dwelling of different fishes and their occupancy at the different niches of water body. It also gives information regarding the feeding habits of fishes and their position in the reservoir food web and how the energy flows from one trophic level to another. Based on the feeding habitat, fishes were classified into various trophic groups15, 16. From fig.2, it can be seen that there was steep decline in the omnivorous fish species from 1972-73 to 2015-16. Among all, omnivore species like Aspidoparia morar, Rasbora daniconius, Salmostoma bacaila, Securicula gora, Eutropiichthys sps, Parambassis ranga found during the fish catch of 1972-73 no longer occur in present fish catch (2015-16). At present, species like common carp and tilapia dominate the omnivorous group.
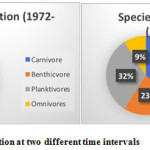 |
Figure 2: Species composition at two different time intervals. Click here to View table |
Trophic pyramid
The trophic metrics analysis (fig.3) explains that the water body was dominated by herbivores, detritivores and omnivores fish species (72.3%) followed by mid-level carnivores (26.7%) indicating significant gaps at the top level.
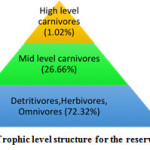 |
Figure 3: Trophic level structure for the reservoir species. Click here to View table |
Stocking intervention and fish catch
Rihand reservoir consists of major and minor fish species. Species diversity has been noticed in reservoir with almost 22 fish species. Since from the construction of the reservoir, department holds the responsibility of fish seed stocking in the reservoir. During the personal discussion and also from the DoF records it has been found that seed stocking of fingerlings was less than the recommended minimum seed stocking level for large reservoirs which is 300-500 fingerlings/ha. In the year 2016-17, DoF has stocked 16,52,000 IMC fingerlings (advanced fry) in the reservoir (65-70 fingerlings/ha) which was only one fifth of the minimum level. The annual catch from the reservoir including all stocked and non-stocked fishes in the year 2015-16 was 261.64 tonnes with an average catch of 8.67 kg/ha/year from the total effective reservoir area of 30,148 ha. However, the target yield from the large reservoir was around 33 kg/ha. The average size of major carps in the reservoir was 7.5 kg during 2015-16.
Fish catch and fish productivity (1971 to 2016)
The trend in total fish production from the reservoir waters was studied. The figure shows fish catch data from the time when fish harvesting started in reservoir (1971-72) and the present status (2015-16). There was unavailability of data from 1982 to 1999 which has been shown here through a broken line. There was a steep rise in fish catch during initial phase mainly as a result of ‘trophic burst’ that is often found in newly created tropical reservoirs where submergence of vegetation and their subsequent decomposition of organic matter releases burst of energy leading to higher primary productivity and fish production. From 1975 onwards, it witnessed an equally steep decline followed by very marginal increase in fish catch due to lack of stocking efforts and limited fishing effort. Here, the total fish catch of the reservoir has only marginally increased between 1971 and 2016 from 152 to 262 tons with an average productivity of 5.06 kg/ha/year (1971-72) to 8.68 kg/ha/year (2015-16) that indicates a marginal annual growth rate of 1.6%. Intensive stocking program and effective governance hold the key to optimally utilise this potential for enhancing fish production and generating more viable livelihoods.
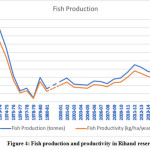 |
Figure 4: Fish production and productivity in Rihandreservoir.
|
Average and compound annual growth rates of fish catch during (2001-2015)
The fish catch witnessed an average annual growth rate of 6.77% between 2000-01 and 2015-16. A great level of fluctuations in the year to year growth of fish catch was observed in Rihand reservoir. So, the CAGR was calculated to account for inter-year fluctuations and obtain a long term trend. The corresponding CAGR was found to be 1.8% which is very modest. The CAGR for each of the five years (2001-2005, 2006-2010 and 2011-2015) were -3.28 %, 10.67% and 3.68% respectively indicating an impressive growth during 2006-10 which seems to have tapered off in recent years. As can be seen in the fig.4, the growth was more stable and linear during this period with relatively less fluctuations while both the preceding and succeeding periods witnessed greater fluctuations thereby undermining the CAGR. The magnitude of fish landings depends to a large extent on regular stocking effort which has been found to be very less (60-70 fingerlings/ ha) on the one hand and the fishing effort on the other. As the correlation results show reasonably good association between stocking density and fish catch, increased and optimal stocking of fishes in the reservoir would certainly lead to increased landing given the existing conducive species diversity and productivity of the reservoir. The deviations in fish catch can also be partly explained by less than optimal fishing effort and poor management.
Table 3: Composition of different species in total catch and the stocking density of IMC over the years.
|
Year |
% of IMC |
% of other carps |
% of CF+AB+WF |
Seed stocking of IMC (in lakh) |
| 2000-01 |
20.88 |
23.33 |
55.78 |
12.52 |
| 2001-02 |
24.87 |
24.03 |
51.10 |
12.65 |
| 2002-03 |
31.30 |
22.45 |
46.25 |
13.00 |
| 2003-04 |
26.80 |
19.22 |
53.98 |
13.00 |
| 2004-05 |
26.39 |
21.78 |
52.00 |
13.00 |
| 2005-06 |
25.66 |
19.46 |
54.88 |
13.52 |
| 2006-07 |
23.26 |
18.49 |
58.33 |
13.52 |
| 2007-08 |
29.45 |
22.67 |
47.88 |
13.52 |
| 2008-09 |
20.24 |
17.40 |
62.36 |
13.52 |
| 2012-13 |
28.07 |
29.05 |
42.88 |
13.52 |
| 2013-14 |
25.58 |
32.47 |
41.73 |
13.52 |
| 2014-15 |
33.39 |
29.08 |
37.53 |
16.52 |
| 2015-16 |
43.15 |
19.34 |
37.51 |
16.52 |
Correlation between the stocking density and fish production of IMCs
The correlation result indicated a strong association (0.904**, p=<0.01)) between stocking density and fish catch of Indian major carps underscoring the obvious advantage of stocking practice. However, as stated above, the average stocking of fish seed in Rihand reservoir as compared to the standard guidelines is very less (65-70 fingerlings/ha).
Is Rihand reservoir still considered the “Catla Mine”?
The status of catla fishery in the Rihand reservoir was studied. For this, catla catch data was reclassified on triennial basis to minimise the effect of annual fluctuations. Three ecotypes of catla species were observed in the reservoir by experts. They are morphologically differentiated and consist of two ‘broader’ ecotypes that feed mainly on microcystis (blue green algae) and the third ‘slender’ ecotype which mainly feeds on ceratium (dinoflagellates). Data (table 4) shows that the reservoir was fully dominated by the catla fishery earlier (till 1980) when it almost constituted 99% of the total fish catch. However, the scenario at present has drastically changed with steep decline in catla fishery from 2002 onwards. Though reasons for this scenario could only be speculated pending a detailed study, the more plausible explanations are as follows: low proportion of catla as compared to rohu in stocked seed of IMC, changes in ecological niches in the reservoir adversely affecting establishment of catla (possible changes in composition of phytoplankton and zooplankton), and also the inadequate fishing effort (as evident from large size of catla (>12 kg) still being caught regularly. Currently, species like rohu (15%), calbasu (15%), siland (13%) and tengan (13 %) contribute as much or more than catla fishery to total fish catch in the reservoir
Table 4: Status of Catla catch from the Rihand reservoir over the years (1981-2016)
| Year |
Catla catch in total fish production (%) |
| 1971-73 |
97.87 |
| 1974-1976 |
92.13 |
| 1977-1979 |
87.35 |
| 1980-81 |
73.10 |
| 2000-2002 |
7.28 |
| 2003-2005 |
8.37 |
| 2006-2008 |
9.57 |
| 2012-2015 |
10.56 |
Table 5: Commonly caught fish species from the Rihand reservoir.
| c | Scientific name | Common name |
| Catla catla | Catla | |
| Stocked species | Labeo rohita | Rohita |
| Cirhhinus mrigala | Mrigal | |
| Hypophthalmichthys molitrix | Silver carp | |
| Ctenopharyngodon idella | Grass carp | |
| Labeo calbasu | Kalbasu or karauch | |
| Labeo bata | Bata | |
| Mastacembellus armatus | Bam | |
| Cirrhinus reba | Raiya | |
| Channa marulius | Saur | |
| Channa striatus | Girai | |
| Silonia silonida | Siland | |
| Unstocked species | Wallago attu | Padhin |
| Bagarius bagarius | Gonch | |
| Notopterus notopterus | Patra | |
| Wallagu attu | Padhin | |
| Labeo bata | Raiya (mrigal) | |
| Clupisoma garua | Baikar | |
| Oreochromis mossambicus | Tilapia | |
| Notopterus chitala | Moi | |
| Mystus gora | Tengan | |
| Chanda baculis | Charni | |
| Puntius sps. | Weed fishes |
Institutional arrangement and fisheries governance in Rihand reservoir
Uttar Pradesh State Department of Fisheries holds the fishing management and leasing rights of Rihand reservoir. Interested fishers living in the vicinity of reservoir are given annual licenses or fishing permits to fish in the reservoir. A contractual leasing system of fishing has been followed in the reservoir from the time of its inception. Till 1990, the first priority was given to fisher community (fisheries cooperative) but since then it’s being leased out to anyone whosoever is bidding the highest auction price irrespective of whether one belongs to fishing community or not. According to the present leasing agreement (valid for three years), the lessee has to pay the bid value of Rs. 111.1lakhs / year with 10% increase every subsequent year for 3 years after which its tendered again. The lessee has to follow certain rules and regulations as per the agreement in terms of mesh size regulation, monsoon season ban, permissible size of IMC to be harvested from the reservoir, stocking of seed, engaging only licensed fishers for fishing, etc. The catch is collected by the contractor (which is recorded by DoF staff) who markets at nearby market and also send to Kolkata and Ranchi markets. Out of the total catch, 40 % is sold locally in the nearby markets and other 60% catch sent to other states. There is no fish hatchery or seed farm located in the vicinity to supply seed for stocking in reservoir. Hence, the seed is transported from Allahabad or Kolkata which could be another reason for less than optimal stocking.
Fishing effort
Catch per unit area generally decreases significantly with increased reservoir area. Gill nets and drag nets are mainly used for fishing by the local fishers in the reservoir. Fishing is done mainly in groups of two or three. As in many tropical reservoirs, fishing is usually done in fishing unit which comprises of either wooden boat or a simple tyre tube with 4-6 nos. of nylon twine gill nets being used / installed at or near the surface. Flat-bottomed, locally made boats ranging in length from 3 to 7 m are used for fishing with gill net and drag net. The drag nets measuring in size from 100-400 m in length and 8-10 m in width with a mesh size of 25-50 mm are utilized by the local fishers.
Conclusions
Rihand reservoir has several comparative advantages which can be fully exploited, while efforts for enhancement of food fish catch shall be continued. The study shows that the fish catch and yield have increased only moderately during last 40 years with marginal increase in annual growth rate. The species composition has also declined during this period. The trophic metrics analysis indicated that the water body is dominated by herbivores, detritivores and omnivores fish species which offers immense scope for the stocking strategy of other high value fishes along with IMC. The overall physico-chemical properties of water were found to be still conducive for fish growth though presence of mercury beyond permissible limit is a serious concern. Based on ecological parameters, Rihand reservoir can be classified as meso-eutrophic to eutrophic status with moderate quantity of nutrients and supportive environment for growth of rich aquatic biota. Though productive, both stocking and catch effort were found to be low and inadequate.
The Rihand reservoir is receiving contaminated water from several industries in the nearby region leading to increasing levels of pollutants with adverse consequences for aquatic and human health as the reservoir water is used for drinking and agriculture purposes as well. Gaps have been identified in overall fisheries management and governance especially in terms of (in) adequacies in seed stocking, strengthening of fisheries cooperative society and capacity building of fishers, increasing the fishing effort, (in)adequate unit catch price for fishers, etc. Fishing effort shall be increased to exploit the available and potential fisheries in addition to addressing the identified gaps in order to ensure realisation of fisheries potential of the Rihand reservoir and enhancement of dependent fishers’ livelihoods.
Acknowledgement
The authors wish to acknowledge the staff of DoF, Rihand reservoir, Renukoot Uttar Pradesh, for their cooperation during field survey period. The authors are grateful to ICAR. The authors are however responsible for any unforeseen errors and omissions.
References
- Ayyappan S., Moza U., Gopalakrishan A., Meenakumari B., Jena J. K., Pandey A. K. Handbook of Fisheries and Aquaculture. Second Edition. New Delhi, Indian Council of Agricultural Research. 2011.
- Sugunan V.V. Ecology and fisheries management of reservoirs in India. Hydrobiologia. 2000;430(1-3):121-147.
CrossRef - Sultan S., Chauhan M., Sharma V. I. Physico-chemical status and primary productivity of Pahunj reservoir, Uttar Pradesh. Journal of Inland Fisheries Society of India. 2003;35(2):73-80.
- Bhadja P., Vaghela A. K. Assessment of physico-chemical parameters and water quality index of reservoir water. International journal of plant, animal and environmental science. 2013;3(3):89-95.
- Murugesan V. K., Rani P., Manoharan S. Productivity of reservoirs in Tamil Nadu with reference to plankton population. Journal of Inland Fisheries Society of India. 2003;35(2):50-56.
- Shukla S. K., Pandey D. P. Environmental restoration around the Rihand Dam. International Journal of Scientific and Research Publications. 2012;2(11):1-7.
- Sharma P., Kachhal P., Beena A., Vyas S., Manorama K., Mahure N. V., Murari R. Monitoring the contamination in the Gobind Ballabh Pant Sagar, Rihand, U.P. India. International journal of environmental sciences. 2012;3(1): 487-497.
- Katiha P. K., Sharma A. P., Chandra G. Institutional arrangements in fisheries of Ganges River system. Aquatic Ecosystem Health & Management. 2013;16(4):465-472.
CrossRef - Keshave J. V., Ananthan P. S., Asha Landge A. Fish and fisheries management status of Itiadoh reservoir, Maharashtra State. Ecology, Environment and Conservation. 2014;20(4):1653-1659.
- Singh S. R., Srivastava N. P., Desai V. R. Seasonal and diurnal variations in physico-chemical conditions of water and plankton in lotic sector of Rihand reservoir (U.P). Journal of Inland Fisheries Society of India. 1980;12(1):100-111.
- Natarajan A.V. and Pathak, V. Patterns of energy flow in fresh water tropical and sub-tropical impoundments. Central Inland Fisheries Research Institute, Barrackpore: Bulletin no. 6 .1983
- Sahu R., Saxena P., Johnson S., Ramanathan S., Juneja S. Mercury Pollution in Sonbhadra District of Uttar Pradesh and its Health Impacts. Centre for science and environment 41, Tughlakabad institutional area, New Delhi. 2012.
- Lee G. F., Jones R. A., Rast W. Alternative approach to trophic state classification for water quality management. Department of Civil and Environmental Engineering Programme, Colorado State University, Fort Collins, Colorado. Occasional Paper No. 66. 1981
- Jhingran A. G. Reservoir fisheries in India. Journal of the Indian Fisheries Association. 1988;18:261-273.
- Karr J. R., Fausch K. D., Angermeier P. L., Yant P. L., Schlosser I. J. Assessing biological integrity in running waters: A method and its rationale. Illinois natural history survey, Urbana, Illinois, USA, Special Publication 5. 1986.
- OPEA, Biological Criteria for the Protection of Aquatic Life. Ecological Assessment Section, Division Water Quality, Planning and Assessment, State of Ohio, Environmental Assessment Agency, Vol. III. 1987.
- Dubey V. K., Sarkar U. K., Pandey A., Sani R., Lakra W. S. The influence of habitat on the spatial variation in fish assemblage composition in an unimpacted tropical river of Ganga basin, India. Aquatic Ecology. 2012;46(2):165-174.
CrossRef - Dubey V. K., Sarkar U. K., Pandey A., Lakra W. S. Fish communities and trophic metrics as measures of ecological degradation: a case study in the tributaries of the river Ganga basin, India. International Journal of Biological Science. 2013;61(3):1351-1363.
- Wichert G. A., Rapport D. J. Fish community structure as a measure of degradation and rehabilitation of riparian systems in an agricultural drainage basin. Environment Management. 1998;22(3):425-443.
CrossRef - Gauch H. G. Multivariate analysis in community ecology. Cambridge University, Cambridge, United Kingdom, 1982
CrossRef - Das A. K. Abiotic features in reservoir fisheries. In proceedings of a national agricultural technology project workshop fisheries management in lentic water systems: stocking of reservoirs with fish seed, Barrackpore, India, CIFRI. 2001;15–72.
- Khan, I.A. and Khan, A.A. Physicochemical conditions in SeikhaJheel at Aligarh. Environment and Ecology. 1985;3(2):269-274.
- Mishra A., Chakraborty S. K., Jaiswar A. K., Sharma A. P., Deshmukhe G., Mohan M. Plankton diversity in Dhaura and Baigul reservoirs of Uttarakhand. Indian Journal of Fisheries. 201057(3):19- 27.