

Introduction
Cauliflower (Brassica oleracea) is an important vegetable of India. Its cultivation is widely done in the sub-tropical parts of north India. In India, the area under cauliflower was 459 thousand hectares with a production of 8800 thousand tonnes and productivity of 19.17 tonnes/ha. India produces around 32.5% of the world’s total production of cauliflower. Individually cauliflower accounts for 5.06% of vegetable production of the country.3 More than 20 million tonnes of cauliflower is produced annually worldwide and China and India are among the leading countries. Varying climatic conditions effects production of cauliflower but in the long term a growing demand trend is likely to remain. China produces half of the world’s yield which is huge revenue for the country. The cauliflower sector is accounted for over 75% of world production by Chinese and Indian cauliflower.9, 10
The rising population pressure and the enhancement in economic condition of nation have pushed up the vegetables consumption, both across regions and income groups.7, 8 With increased awareness about health and economic status in the nation, the demand for vegetable has also increased. The increase in income of the people has led to a gradual shift in consumption pattern in favour of high value crops namely fruits and vegetables. Hence, per capita consumption of fruits and vegetables is expected to increase in future.12
In Bihar an area of about 65.71 thousand hectares is under cauliflower cultivation. The state produces about 935.56 thousand tonnes of cauliflower annually with an average productivity of about 15.28 tonnes per hectare. Bihar is third largest producer of cauliflower in the country and shares 10.86% of the total production. Leading cauliflower producing states are Bihar, Uttar Pradesh, Odisha, West Bengal, Assam, Haryana and Maharashtra. Though there has been a constant increase in the production of vegetable in the country, nonetheless desired improvement in the nutritional status of the population has not taken place because of the fact that per capita availability of vegetables is hovering around 175 gm per day which is far below the recommended dose of 300 gm per day.1,15
Vegetables can be grown successfully on small pieces of land also. Large proportions (more than 93%) of farmers in Bihar are either marginal farmers or small farmers. Vegetable production may be a lucrative profession for these marginal and small farmers and would give them higher quantity of biomass as well as higher income.2 In Bihar, Samastipur, Vaishali, Nalanda, Muzaffarpur, Madhubani, East Champaran and Saran district are leading vegetable growing districts.
In Samastipur district, total area under vegetable crops was 13437 ha with the production of 128019.60 tonnes during 2015-16. In the district, the area under cauliflower crop was 2945 ha with the production of 53599 tonnes which account for 21.91% and 41.86 % of total area and total production under vegetable crop, respectively. Among large numbers of vegetables grown in Bihar, cauliflower is one of the important vegetable crops which affect the economy of farming community. The gross returns/ha is usually influenced by the use of human labour, quantities of seeds, fertilizers, manure, irrigation and insecticides. These factors directly or jointly influence gross returns/ha of cauliflower. Appropriate quantities of inputs and consideration of proper price combination would augment the production and consequently help in creating scope to improve the overall economic condition of the farmers through homestead vegetable farming.5, 6, 11
To examine the resource use efficiency in vegetables production (cabbage, cauliflower and peas) in Manipur, a study conducted by Priscilla and Singh revealed the fact that the vegetables were not cultivated according to the recommended package of practices and crops were grown without caring for resource productivity and resource use efficiency. The deviations from the optimal level of resource use were found in all the said three vegetables, resulting in low productivity and efficiency of various inputs. Proper farmer’s field trials and awareness campaigns on improved practices and correct method of use of inputs need to be imparted which will ultimately benefit the producers.13
In 2017-18 productivity of cauliflower in Samastipur district and in the state of Bihar was found 18.2 tonnes/ha and 15.28 tonnes/ha which was comparatively low with the national average productivity 19.17 tonnes/ha of cauliflower. A clear yield gap was observed between district or state yield and national yield of cauliflower. The yield gap generally arises due to suboptimal or inefficient use of resources. Hence, assessment of technical and allocative efficiency is necessary as the analysis gives better understanding of the productivity gap and helps farmers appropriately to adjust productive resources in order to achieve optimum productivity.
Few studies have been conducted on vegetables at national level. Notwithstanding the fact that Bihar is a leading state in terms of vegetable production, studies related to economic aspects of vegetable are very few. Whatever the studies are available, most of them deal with agronomic aspects of cauliflower production. It was realized that there is dearth of studies relating to economics and resource use efficiency of inputs in cauliflower cultivation. With this back drop, the present study was conceptualized and undertaken with a view to bridge this gap. In this study the growth in area production and productivity of cauliflower over the years in Bihar with special reference to Samastipur district and resources use efficiency of cauliflower production in the study area has been worked out and examined.
Materials and Method
Samastipur district of Bihar is a prominent vegetable growing district. It was selected purposively for the present investigation. There are altogether twenty blocks in Samastipur district. A list of cauliflower producing blocks along with quantity of cauliflower produced in respective blocks was prepared and arranged in ascending order. Out of the 20 blocks, Kalyanpur and Pusa blocks were selected randomly. From each selected block, a list of cauliflower producing villages was after arranging them in ascending order, Chukmilky, Kushiyari and Tara from Kalyanpur block and Birauli (Khurd) and Dhurvgama from Pusa block were selected randomly there by making a total of five sample villages. Again, a list of cauliflower growers of every selected village was prepared and from each village 20 cauliflower growers selected randomly. Thus, total 100 cauliflower growers were selected for detailed investigation. Out of 100 respondents, 30 respondents, 45 respondents, 20 respondents and 5 respondents belonged to marginal farm size (0-1ha), small farm size (1-2 ha), medium (2-4ha) and large (above 4ha) groups, respectively.
For estimation of growth performance of cauliflower in Bihar and Samastipur district secondary data were used. The secondary data were obtained from various published sources like Indian Horticulture and Economic Survey of Bihar and Horticulture at a Glance from 2001-02 to 2015-16 and the entire period was sub-divided into three sub-periods i.e. Period-I (2001-02 to 2005-06), period II-(2006-07 to 2010-11) and period-III(2011-12 to 2015-16). Compound Annual Growth Rate (CAGR) was worked out using exponential model.
Y=ABt
Log Y= log A+ t log B
Let Log Y=y, logA =a and LogB=b
y= a + bt
r = (antilog ‘b’ -1) x 100
Where Y = area/ production/ productivity
a= Intercept
b = Regression coefficient
t = Time periods (t= 1, 2, 3,……… 10)
r = Compound Annual Growth Rate (CAGR).
Data Envelopment Analysis (DEA) Approach
Data Envelopment Analysis (DEA) was used to measure the resource use efficiency. This method is known as non-parametric linear programming method. DEA is used in order to work out the technical, allocative and cost efficiency of a farm using a set of observed output and concerned input data. The definition of efficiency may be expressed as how efficiently inputs are applied to produce a given level of output or producing same level with lower level of inputs or more output with the same level of inputs considering the optimum quantity and prices of inputs. DEA has been applied to work out the relative efficiency score of each farm with regard to farms with minimum input output ratio for all inputs. For the most efficient farm, the score will be one; the score of each farm will lie between zero and one.
In order to design mathematical model, we consider K farmers Decision Making Units (DMU) applying N inputs to produce M outputs. Inputs may be denoted by Xjk (j= 1,2,…….n)and output are expressed by yik (i =1, 2, 3, …… m) for each farmer k ( k= 1,2,……..k). The technical efficiency (TE) of the farmers may be estimated by using the formula given below4, 16:
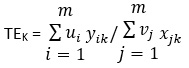
Where, yik refers to the quantity of ith output produced by kth farmer, xjk is the quantity of jth input applied by the kth farmer, ui and vi are the output and input weights respectively. The dependent and explanatory variables used for assessing the resource use efficiency of cauliflower were as follows:
y=Output (tonnes)
x1=Human labour (hrs.)
x2=Machine labour (hrs.)
x3= Irrigation labour (hrs.)
x4= Manures (quintal)
x5= Fertilizer (kg)
x6=Plant protection measures (litre)
The farmer (DMU) maximizes the technical efficiency, TEk subject to
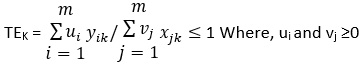
As per above equation the technical efficiency measure of a farmer does not exceed one, and the input and output weights are positive. The weights are selected in such a way that the farmer maximizes its own TE which is cultivated separately. To select optimal weights the linear programming model is specified as:
Max TEk
Subject to
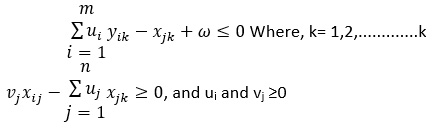
Input related linear programming model has been used to obtain the given level of output by minimizing input. For minimization of inputs, the mathematical programming model is stated as :
Min TEk
Subject to
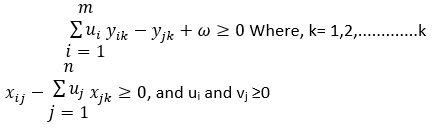
The above model reveals TE under constant returns to scale (CRS) with an assumption, if w = 0 and it is converted into variable returns to scale (VRS), if w is taken unconstrained. In the first case it refers to technical efficiency (TE) and in second case, it measures pure technical efficiency (PTE).
Technical Efficiency (TE)
It may be defined generally as the ratio of sum of the weighted outputs to sum of weighted inputs. The value of technical efficiency lies between zero and one; where a value one shows that the DMU is the best performer found on production frontier and has no reduction potential. Any value of TE lower than one connotes that DMU uses inputs inefficiently.
Cost or Economic Efficiency (CE)
Researcher can compute both technical and allocative efficiencies to test the behavioural objectives such as cost minimization or revenue maximization.
Cost minimization DEA is expressed as
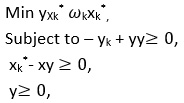
Where ωk is a vector of inputs prices for the kth farmer and xk* (which is calculated by LP) is the cost minimizing vector of input quantities for the kth farmer, given the input prices wk and the output level yk.
Total cost efficiency (CE) or economic efficiency of the k![]() th farmer may be calculated as
th farmer may be calculated as
That is the ratio of minimum cost to the observed cost.
The allocative efficiency (AE) is worked out as the ratio of cost efficiency to technical efficiency
Allocative efficiency (AE)
The allocative efficiency (AE) is computed as the ratio of cost efficiency to technical efficiency
AE = CE/TE
DEA used for estimating the relative efficiency of decision making units (DMUs) that have different inputs and outputs. In this study, input- oriented efficiency measures have been used with a purpose to make it more relevant under the declining resource (inputs) situation.
Technical efficiency (TE) refers to the degree to which a farmer produces maximum output from a given bundle of inputs, or uses the minimum amount of inputs to produce a given level of output when the technology exhibits constant returns to scale but is likely to differ otherwise. These two definitions of TE are known as output-oriented or input – oriented efficiency measures, respectively. AE or price efficiency reflects the ability of a farm to use the inputs in optimal proportions, given their respective price EE or CE is distinct from the other two; even though it is the product of TE and AE and reflects the ability of a production unit to produce a well- specified output at minimum cost. An economically- efficient might be both technically and allocatively efficient.
Resuls and Discussion
Growth Performance of Cauliflower
The compound growth rates of area, production and productivity of cauliflower in Bihar and Samastipur district during the period total year from 2001-02 to 2015-16, and 2001-02 to 2005-06, 2006-07 to 2010-11 and 2011-12 to 2015-16, has been worked out to compare growth performance in the periods and has been presented in Table 1.
Table 1: Compound annual growth rate of area, production and productivity of cauliflower in Bihar and Samastipur district. (In % per annum)
| Period | Bihar | Samastipur | ||||
| Area | Production | Productivity | Area | Production | Productivity | |
| Overall period (2001-02 to 2015-16) |
0.35* | 0.60* | 0.26* | 0.20* | 0.96* | 0.76* |
| Period-I (2001-02 to 2005-06) |
-0.04 | 1.21* | 1.04* | -1.42 | 1.60* | 3.06* |
| Period- II (2006-07-2010-11 |
0.47* | 1.14* | 0.67* | 1.49* | 1.57* | 0.07* |
| Period-III (2015-16) |
0.36* | -1.79 | -2.14 | 0.15* | 0.63* | 0.48* |
Source: Authors calculation, * indicates significant at 1% level of probability
This table shows that the area of cauliflower in Bihar registered positive but significant compound growth rate of 0.35% during the period from 2001-02 to 2015-16 which was significant at 1% level of probability and the growth rate of production during the same period was also observed to be 0.60%, and productivity was 0.26 %, both of which were significant at 1% level of probability. This clearly indicated that there has been a slight increase in area, production and productivity of cauliflower during the period from 2001-02 to 2015-16 in the state of Bihar. In between different sub periods of 2001-02 to 2005-06, 2006-07 to 2010-11 and 2011-12 to 2015-16, the growth rate of area, production and productivity of cauliflower in Bihar was-0.04, 1.21 and 1.04, 0.47, 1.14 and 0.67, and 0.36, -1.79 and -2.14%, respectively. It may further be observed that the growth rate of area, production and productivity in three periods was negative but significant at 1% level of probability. Whereas, growth rate of area, production and productivity during three sub periods were observed to be positive and 1% level of significant.
The compound growth rate of area of cauliflower in the selected district Samastipur was estimated to be 0.26% during the period 2001-02 to 2015-16, which was significant at 1% level of probability. The table further indicated that the growth rate of production of cauliflower during the period 2001-02 to 2015-16 in the selected district was 0.96%, and productivity was 0.76%, both of which were significant at 1 % level of probability. This clearly indicated that there has been a slight increase in area, production and productivity of cauliflower during the period from 2001-02 to 2015-16 in district Samastipur. In between different sub periods of 2001-02 to 2005-06, 2006-07 to 2010-11 and 2011-12 to 2015-16, the growth rate of area, production and productivity of cauliflower in district Samastipur was observed to be -1.42, 1.60 and 3.06, 1.49, 1.57 and 0.07, and 0.15, 0.63 and 0.48%, respectively. It may further be observed that all the growth rates were positive and significant at 1% level of probability, during the sub three periods, except 2001-02 to 2005-06 for compound growth rate of area which was negative but significant at 1% level of probability.
Resource use efficiency of cauliflower production
Scores on resource use efficiency act as guide to the farming community to use their resources prudently and efficiently in the production process in order to maximize their income. Three types of efficiency measures namely, technical efficiency (TE), allocative efficiency (AE) also known as price efficiency and economic efficiency also known as cost efficiency (CE), where estimated for cauliflower production in the study area, using data envelopment analysis (DEA) method.
Table 2: Mean efficiencies of cauliflower grower in the study area.
| Farmers categories | Technical efficiency (TE) | Allocative efficiency (AE) | Cost efficiency (CE) |
| Marginal (0 -1 ha) | 0.69 | 0.60 | 0.41 |
| Small (1-2 ha.) | 0.57 | 0.70 | 0.40 |
| Medium (2-4 ha.) | 0.67 | 0.52 | 0.35 |
| Large (4 & above) | 0.58 | 0.84 | 0.49 |
| Overall | 0.67 | 0.61 | 0.41 |
Source: Authors calculation
Farm size wise mean efficiencies of cauliflower production in the study area have been shown in Table 2.
The mean level of TE of all the sample respondents taken together was estimated at 0.67, which implied that the cauliflower growers could be wiser to decrease the current input by 33.00% to produce the same amount of output using a given technology. Holding size wise analysis of TE indicated that marginal farmers operating at 69.00% level of efficiency could decrease input level by 31.00% for production of the same level of output. The scores of TE in case of small, medium and large farms was estimated as 0.57, 0.67 and 0.58 indicating their by that these categories of farmers could be prudent by reducing their input level by 43.00%, 33.00% and 42.00% respectively, for obtaining the same amount of production.
The table further revealed that the mean AE of cauliflower growing respondents was 0.61 implying that the same cauliflower growers could reduce a cost of production of cauliflower by 39.00%. For which they would have to be more aware of relative input prices prevailing in the market, while deciding upon quantum of various inputs. The mean AE of marginal, small, medium and large farmers indicated that these farm size groups of farmers could reduce cost of production of cauliflower by 40.00%, 30.00%, 48.00% and 16.00%, respectively.
A perusal of the table further revealed that mean score of economic efficiency or cost efficiency (CE) in cauliflower production was 0.41. The score pointed out that the cauliflower growers could reduce the current cost of the produce by 59.00% achieved a potential minimum cost of production relative to the efficient farmers given current level of output. The findings are in line with the findings of the study conducted in Bilaspur district of Chhattisgarh to assess the technical and allocative efficiency of brinjal farms by Tegar et. al.,14
Holding size wise examination of the score of CE indicated that marginal farmers, small farmers, medium farmers and large farmers would be wiser in reducing the current cost of the produce by 59.00%, 60.00%, 65.00% and 51.00% respectively, to achieve the potential minimum cost of production relative to the efficient farmers given current output level.
The entire sample farms where grouped into various classes, based on the level of their TE, AE, and CE. The distribution of cauliflower growing farms in their efficiency level has been shown in Table 3.
Table 3: Distribution of Cauliflower Growing Farms according to their Efficiency Level.
| Sl.No. | Efficiency level | Frequency distribution of cauliflower farms | ||
| Technical efficiency (TE) | Allocative efficiency (AE) | Cost efficiency (CE) | ||
| 1. | < 10 | – | – | 6 (06.00) |
| 2. | 10-29 | 15 (15.00) | 2 (02.00) | 23 (23.00) |
| 3. | 30-49 | 12 (12.00) | 29 (29.00) | 44 (44.00) |
| 4. | 50-69 | 23 (23.00) | 34 (34.00) | 16 (16.00) |
| 5. | 70-89 | 20 (20.00) | 30 (30.00) | 8 (08.00) |
| 6. | >90 | 30 (30.00) | 5 (05.00) | 3 (03.00) |
| Total | 100 (100.00) | 100 (100.00) | 100 (100.00) | 100 (100.00) |
Source: Authors calculation
It may be observed from the table that 30 (30.00%) of the sample farmers operated at more than 90.00 % level of TE. These farmers appear to be more aware of the input package and practices of cauliflower cultivation. The TE of 23 farmers (i.e., 23.00%) varied between 50.00% to 69.00% and 20.00% of the cauliflower growers. TE was observed to be varying from 70.00% to 89.00%. Fifteen percent of the farmers belonged to 10.00 to 29.00% TE group and 12.00% of them came under 30.00 to 49.00% TE group. The farmers falling under low efficiency groups are considered to be technically less efficient. In short, it can be said that the TE of around three-fourths of the sample farmers operated at a TE level of more than 50.00% of TE. It can be concluded that majority of the sample farmers had good knowledge as improved package or practices of cauliflower production.
The table further revealed that, larger proportion of sample farmers (34.00%) operated at an efficiency level of more than 50.00% and less than 70.00%. The AE of 30.00% of the farmers range between 70.00% and 89.00% and that of 29.00% of the sample farmers varies between 30.00 to 49.00%. It can be in furred from the table that around 70.00% of the cauliflower growers operated at an AE level of more than 50.00% and remaining around 30.00% of them had their AE level varying between 10.00 to 49.00%.
It may be observed from the table that 31.00% of the sample farmers operated at less than 50.00 % of AE level. Only 5.00 % of them cultivated at above 90.00 % level of AE implying there by that these farmers were more aware of the improved cost efficient production techniques and practiced them in the production process.
The perusal of the table further indicated that only 3.00 % of the total sample farmers grew cauliflower at an efficiency level of more than 90.00 %. About three-fourths of the sample farmers operated at less than 50.00 % of CE level and only around of one-fourth of them had the CE level of more than 50.00%.
In this way the efficiency scores suggest that there is a considerable scope for decreasing inputs and thereby reducing the cost of production in cauliflower cultivation.
Conclusion
From the ongoing discussion it may be inferred that significant positive growth in area, production and productivity of cauliflower in Bihar was observed during the period 2001-02 to 2015-16. The area under cauliflower increased at the rate of 0.47 % per annum and 0.36 % per annum in period II and III, but in period I, it decreased at the rate of 0.04 % per annum during period I. Growth in productivity of cauliflower registered an increasing trend during period I and II, but it decreased at the rate of 2.14 % during period III. Production of cauliflower witnessed almost similar trend, during all the periods under consideration. The growth in area, production and productivity of cauliflower exhibited almost similar trend in case of Samastipur district.
The analysis of resource use efficiency of cauliflower production revealed that the mean level of TE of all the sample respondents taken together was estimated at 0.67, which implied that the cauliflower growers could be wiser to decrease the current input by 33.00% to produce the same amount of output using a given technology.
The study further revealed that the mean AE of cauliflower growing respondents was 0.61 implying that the same cauliflower growers could reduce the cost of production of cauliflower by 39.00%, for which they would have to be more aware of relative input prices prevailing in the market, while deciding upon quantum of various inputs.
It was observed that mean score of economic efficiency or cost efficiency (CE) in cauliflower production was 0.41. The score pointed out that the cauliflower growers could reduce the current cost of the produce by 59.00% to achieve potential minimum cost of production relative to the efficient farmers given current level of output.
In this way the efficiency scores suggest that there is a considerable scope for decreasing inputs and thereby reducing the cost of production in cauliflower cultivation. The study revealed that the farmers in the study area were not properly aware about the package of practices of cultivation of cauliflower and under or over utilizing the resources of productivity caused gap in output of the crop. Proper farmer’s field trials and awareness campaigns on improved practices and correct method of use of inputs need to be imparted which will ultimately benefit the producers.
Acknowledgement
Authors are thankful to Dr. Rajendra Prasad Central Agricultural University, Pusa (Samastipur), Bihar to provide rich literal platform for conducting the research works. Authors are also thankful to the anonymous reviewers for their constructive comments for improvement of the manuscript.
Conflict of Interest
The authors do not have any conflict of interest.
References
- Agarwal, S., Goyal, S.K., Dhingra, A., and Singh, Deepak. Marketing of Cabbage and Cauliflower in Shimla District of Himachal Pradesh. Haryana Journal of Horticultural Sciences, 2009: 38 (1/2):140-142.
- Ahmad, Nasim, Sinha, D.K., Singh, K.M, Mishra R. R and Kumari, Priyanka. Vegetable production: A probable pathway for healthy nation and doubling farmers’ income. Current Advances in Agricultural Sciences, 2018: 10(2): 112-116.
- Anonymous, Horticulture at a Glance. National Horticulture Board, Ministry of Agriculture and Farmers Welfare, Government of India: 2018
- Coelli, T.A. Guide to DEAP version 2.1: A Data Envelopment Analysis (computer) Programme, Working Paper 96/08, CEPA, UNE, Australia: 1998
- Dumsile Dlamini F. Resource Use Efficiency in Organic Vegetable Production: A Case Study of Manzini Region, Swaziland, Journal of Agricultural Studies, 2014, 2( 2): 52-61
- Islam, MS, Kmarulzaman, NH, Bhandari, Humanth, Saidur Rahman M., and Monirul Alam, G.M. Productivity and Resource Use Efficiency of Cauliflower Farming in Some Selected Areas of Jamalpur District in Bangladesh, 2020. https://www.researchgate.net/publication/339134246 (retrieved on 24.02.2020)
- Kumar, Pradaman and Mathur, V. C. Structural changes in the demand for food in India. Indian Journal of Agricultural Economics, 1996: 51(4): 664-773.
- Kumar, Pradaman. Food Demand and Supply Projections for India. Agricultural Economics Policy Paper 98-01. Indian Agricultural Research Institute, New Delhi: 1998.
- Kumar, Sant, Joshi, P.K., and Pal, Suresh. Growing vegetables: Role of research. In. Proceeding 13, Impact of Vegetable Research in India, Eds: Sant Kumar, P.K. Joshi and Suresh Pal, National Centre for Agricultural Economics and Policy Research, New Delhi: 2004b.
- Kumar, Sant, Pal, S. and Joshi, P. K.. Vegetable sector in India: An overview. In: Proceeding 13, Impact of Vegetable Research in India, Eds: Sant Kumar, P.K. Joshi and Suresh Pal. National Centre for Agricultural Economics and Policy Research, New Delhi: 2004a
- Lokapur S., Kulkarni, G.N, Gamanagatti, P.B. and Gurikar, R. Resource use efficiency of major vegetables in Belgaum district in Karnataka, International Research Journal of Agricultural Economics and Statistics, 2014, 5 (1): 108-110
- Mulderij, R. Overview Global Broccoli and Cauliflower Market. Global Fresh Produce and Banana News, http:// www. freshplaza.com/article/ 159166/ OVERVIEWGLOBAL-BROCCOLI-AND-CAULIFLOWER-MARKET: 2016
- Priscilla, L. and Singh, S. P. Resource use efficiency in vegetable production in Manipur state. International Journal of Basic and Applied Agricultural Research 2016, Vol.14 No.1 pp.1-5
- Tegar, Ajay, Banafar, K.N.S., Gauraha, A.K. and Chandrakar, G. An analysis of technical and allocative efficiency of brinjal farm in Bilaspur district of Chhattisgarh. Agric. Update, 2016, 11(2): 96- 103 (DOI : 10.15740/ HAS /AU/ 11.2/96-103).
- WHO. Promoting Fruits and Vegetable Consumption around the World: 2003
- Worthingtom, A.C. Measuring Technical Efficiency in Australian Credit Unions. The Manchester School: 1999: 67(2)