
Introduction
In the global market, spices are commodities with a high value and low trade volume. It may be defined as a plant that enhances food, drink, and other goods’ flavor, aroma, aesthetic, and therapeutic value. With a rich trade history with the ancient Chinese and Roman civilizations, India is called the “Home of Spices.” Spices are derived from various parts of plants used as seasonings and essential for preparation of food as they add flavour, taste and color. India is the biggest producer of spices worldwide. India is a major participant in the export of spices since it is the world’s top producer and exporter of spices. India’s spice exports reached US$ 3.73 billion in 2022–2023 after reaching US$ 3.46 billion in 2021–2022. Chilli was the single largest spice exported from India in 2021–2022. The agricultural export performance in India is significantly impacted by the fortunes of the spice trade in India. When it comes to the value of agricultural exports from India, spices come in fourth. Therefore, expanding the domestic production of spices is vital for bigger spice exports after fulfilling the high domestic demand.
Several authors have studied spice crops to encourage the cultivation of spices. Haque et al.1 conducted specific studies on onions and discovered they are the most profitable Rabi crop. Additionally, Afrad and Akter2 investigated the relationship between socioeconomic characteristics and grower knowledge. Islam et al.’s3 study of the productivity of several spice crops revealed that good management might greatly increase the yield of various spices. They assert that by employing suitable management techniques for garlic, chile, ginger, and turmeric, productivity increases of 12%, 20%, 31%, and 21%, respectively, can be attained without raising expenses. Furthermore, several researches have been carried out on the expansion, pattern, and volatility of crop production in Bangladesh and outside. In Khyber Pakhtunkhwa, Pakistan, Abid et al.4 investigated the area’s growth and trend as well as the production and yield of the main crops. The acreage, output, and yield growth and trends of Bangladesh’s principal crops were examined by Akhter et al.5 To measure the technical proficiency of ginger producers, Islam et al.6 conducted a study in the districts of Nilphamari and Khagrachari of Bangladesh. The average technical efficiency was 85, which suggests that output might be raised by 15% given the level of inputs and technology now in use. Fatima et al.7 looked at the patterns in potato and onion wholesale pricing in Pakistan’s main markets and discovered that these prices rose with time.
The previous research attempts to measure the extent of instability in area, production and yield of spice crops in several other countries. The present study examines the growth and instability in area, production and yield of major spices grown in Indian context.
Materials and Methods
The present study aims to analyze the production performance, productivity, and area under cultivation of onion, garlic, ginger, and chili in India based on secondary data from 1980–81 to 2021–22. The data was obtained from the Directorate of Economics and Statistics, Department of Agriculture, Cooperation and Farmers Welfare, Ministry of Agriculture, Government of India, and Indian Horticulture Database, National Horticulture Board.
The statistical program STATA was used for the analysis.The data have been analyzed by statistical techniques using the statistical program STATA .
The study is based on the following hypothesis.
The production of a spice crop depends on the production level of the previous year.
The trends in production, productivity and area under cultivation determine the growth performance of spice crops.
Instability in output generation, productivity and the area of the spice crops has adverse impacts on the growth performance.
Trend Growth Rate Analysis
In several studies, the semi-log trend function is frequently employed to identify trends and calculate growth rates for productivity, output, and area. The output of a given year in the semi-log function depends on the year before. In this paper, the well-known compound interest formula was utilized in the equation below.
![]()
Where yt is the quantity of spice, y0 is the quantity of spice in base year, r is compound growth rate, and t is time in years.
![]()
Substituting lny0 by ln(1+r) and by β1 and adding a random error term, the above equation transforms into a linear regression equation Lnyt = β0 + β1 t + Ut. The equation represents a semi-log model where β1 is the coefficient of the trend and it measures the relative change in yt due to a change in t. From the equation, the compound growth rate can be computed by the formula
![]()
One of the key considerations when making decisions about agricultural output is instability because it makes price levels volatile and affects customers making low-income households more susceptible to market fluctuations. Instability is influenced by several factors, including nature, economic conditions, enhanced variety, weather sensitivity, and input availability. To study the extent of inequality, one may utilize the coefficient of variation of various spice crops concerning area, production, and yield.
![]()
Nevertheless, the CV does not adequately reflect the instability of time series data, such as those used in this work verify the instability, a different metric called the coefficient of variation around the trend, or the Cuddy Delly measure, is used.
![]()
Results
Trend and Growth Rates of Onion Production, Area and Yield
Indian onions are known for being spicy and are grown all year round. With almost 1.4 million hectares under cultivation and an average yearly production of 24 million metric tonnes (MMT) from 2015–16 to 2021–22, India is the second-largest producer of onions in the world. As of 2021–22, four states accounted for 75% of India’s production: Maharashtra (13.3 MMT), Madhya Pradesh (4.7 MMT), Karnataka (2.7 MMT), and Gujarat (2.5 MMT). These states provide most of the supply. Among the agricultural commodities produced in India, onion is one of the most unstable crops. A significant price increase affects consumer spending, whereas declining onion prices below cultivation costs lower farmers’ revenue. In the previous three years, India’s net export value was Rs. 3,326.99 crore in 2021–2022; Rs. 4,525.91 crore in 2022–2023; and Rs. 3,513.22 crore in 2023–2024. Figure 1 demonstrates that the average area under onion remained almost the same during the period under consideration, but the production of onion rose slowly over time. The yield grew as well over the years.
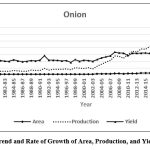 |
Figure 1: Trend and Rate of Growth of Area, Production, and Yield of Onion |
Table 1 shows that the F statistics were significant, indicating that the model is statistically significant for area, production, and yield. The Durbin-Watson test values of 0.56, 0.52, and 0.71, respectively, indicate negative autocorrelation. Garlic area, productivity, and yield all had positive trend coefficients. According to the positive compound growth rate, the onion area, output, and productivity increased by 5.18%, 6.87%, and 1.61% per year.
Table 1: Trend and Rate of Growth of Onion
|
|
Area |
Production |
Yield |
|
F Stat |
875.09 |
587.72 |
112.96 |
|
t Stat |
29.58 |
24.24 |
10.63 |
|
Trend |
0.050475 |
0.0664837 |
0.015936 |
|
Compound Growth Rate |
5.177004 |
6.8743543 |
1.606396 |
|
Durbin Watson |
0.556346 |
0.5178391 |
0.71032 |
Author’s Calculations
Trend and Growth Rates of Chili Production, Area, and Yield
One of the most valued crops for spices is chili in India. Around 40% of the world’s chili production comes from India, which is also the biggest producer, consumer, and exporter of chili. Figure 2 illustrates the gradual rise in chili production and yield over time. The chili production was 509.1 thousand MT in 1980–1981 and increased to 1577.62 thousand MT in 2021–22 in India. The average production grew as well to 1852.1 MT per hectare from 610 MT per hectare. Throughout this period under consideration, the area under this crop was declining.
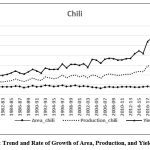 |
Figure 2: Trend and Rate of Growth of Area, Production, and Yield of Chili |
The results of the semi-log model for the chili are shown in Table 2. The model proves significant for the area, production, and yield as shown by the F test values. Durbin-Watson values for productivity (1.57) and production (1.87) show no autocorrelation, while the area value (1.14) shows a negative autocorrelation. Production and yield have positive and significant trend coefficient values whereas area shows a negative trend. The compound growth rates indicate that the production, and yield grew by 1.87%, and 1.57%, per year, respectively but the area under this crop declined by 0.27 %.
Table 2: Trend and Rate of Growth of Area, Production, and Yield of Chili
|
|
Area |
Production |
Yield |
|
F Stat |
7.84 |
549.7 |
567.15 |
|
t Stat |
-2.8 |
23.45 |
23.81 |
|
Trend |
-0.00277 |
0.0320771 |
0.034817 |
|
Compound Growth Rate |
-0.27689 |
3.2597115 |
3.543062 |
|
Durbin Watson |
1.148964 |
1.871454 |
1.570862 |
Author’s Calculations
Trend and Growth Rates of Ginger Production, Area, and Yield
India is the world’s second-largest producer of ginger, behind China. Figure 3 shows that the area, production, and yield under ginger cultivation were inadequate at 40.45 thousand hectares, 82.44 thousand MT, and 2038 MT per hectare respectively in 1980-81. In 2021-22, the yield rose to 11264.04 MT per hectare with an increase in total production of 2172.49 thousand MT and a slight increase in area to 192.87 thousand hectares. The production of ginger is growing faster than the land area, as seen in Figure 1. During this period, the productivity was comparatively more impressive. The usage of HYV seeds and better technology could be the reason for the sustained productivity rise in ginger.
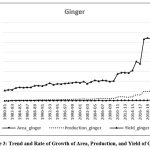 |
Figure 3: Trend and Rate of Growth of Area, Production, and Yield of Ginger |
Table 3 shows the positive trend coefficient values with significant t values and F values in all cases. The positive compound growth rate shows that area, production, and yield grew by 3.92%, 7.51%, and 3.45% per year, respectively. The Durbin-Watson values indicate negative autocorrelation.
Table 3: Trend and Rate of Growth of Area, Production, and Yield of Ginger
|
|
Area |
Production |
Yield |
|
F Stat |
1776.5 |
600.61 |
170.04 |
|
t Stat |
42.15 |
24.51 |
13.04 |
|
Trend |
0.038528 |
0.0724057 |
0.033877 |
|
Compound Growth Rate |
3.927941 |
7.509142 |
3.445726 |
|
Durbin Watson |
1.084656 |
0.3762686 |
0.270639 |
Author’s Calculations
Trend and Growth Rates of Garlic Production, Area, and Yield
In India, garlic is used as a spice. India is currently one of the top exporters of garlic worldwide. In addition to Bangladesh, other countries that import Indian garlic include Pakistan, Thailand, the US, Nepal, and Malaysia. It has grown significantly in Madhya Pradesh, Gujarat, Orissa, Rajasthan, Karnataka, Tamil Nadu, Maharashtra, and Bihar. It is observed in Figure 4 that the trend in production, area, and yield under garlic cultivation is positive. Garlic is India’s second most important bulb crop, after onions.
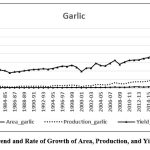 |
Figure 4: Trend and Rate of Growth of Area, Production, and Yield of Garlic |
Table 4 shows that the model was significant for garlic production, productivity, and area, according to the F test values. The Durbin-Watson test result indicated that since the values of these parameters are less than the lower critical value, the models have negative autocorrelation issues. The trend coefficients are positive in all three cases. The maximum positive trend is observed is observed in production.
Table 4: Trend and Rate of Growth of Area, Production, and Yield of Garlic
|
|
Area |
Production |
Yield |
|
F Stat |
408.28 |
350.62 |
121.06 |
|
t Stat |
20.21 |
18.72 |
11 |
|
Trend |
0.046393 |
0.0631323 |
0.016757 |
|
Compound Growth Rate |
4.748557 |
6.5167752 |
0.016898 |
|
Durbin Watson |
0.949167 |
0.7522356 |
0.747159 |
Author’s Calculations
Instability in Area, Production, and Productivity
Table 5 shows the instability of production, productivity, and the area for the four spices cultivated in India. The table displays the two indicators of instability, with Cuddy Delly values and coefficients of variation. When compared in terms of the coefficient of variation, the results indicate that the output of onions (84.43%), garlic (96.83%), and ginger (110.44%) was extremely unstable between 1980–81 and 2021–22. In contrast, the production of chile (41.12%) was more stable. A similar outcome was found in Cuddy Delly values. Both the indices show that Onion and garlic farming have the most instability in terms of area under cultivation. The area under chili shows relative stability (8.37%). The area allocated for ginger cultivation was the most stable when comparing Cuddy Delly values. Ginger productivity was highly unstable (59.10%) followed by chili (46.14%) when comparing the coefficients of variation. The productivities of onion (23.39%) and garlic (27.28%) were relatively stable. In terms of Cuddy Delly values, the productivity of chili was the most stable followed by onion (11.96%), garlic (13.6%), and ginger (25.79%).
Table 5: CV and Cuddy Delly Values of Area, Production, and Yield of Spices
|
|
Coefficient of Variation |
Cuddy Delly Value |
||||
|
Crop |
Area |
Production |
Yield |
Area |
Production |
Yield |
|
Onion |
66.10279 |
84.42890866 |
23.38608 |
13.81848689 |
21.30889315 |
11.95895818 |
|
Garlic |
63.9687 |
96.82527507 |
27.27803 |
19.10512841 |
30.98408802 |
13.59529818 |
|
Chili |
8.371347 |
41.1220478 |
46.14167 |
7.655092055 |
10.70753692 |
11.84502699 |
|
Ginger |
48.36063 |
110.443672 |
59.0986 |
7.173040969 |
27.58882043 |
25.78758622 |
Author’s Calculations
Discussions
The results indicate that the average area under onion remained almost the same, but the production and the yield rose slowly over time. The trends in chili production and yield show a gradual rise but a decline in area under cultivation. The production and land area and productivity of both ginger and garlic exhibit positive trends.
The coefficient of variation and Cuddy Delly values indicate that between 1980–81 and 2021–22, the output of onions, garlic, and ginger was highly unstable. On the other hand, chili production was more consistent. According to both indices, the most unstable crops in terms of area under cultivation were garlic and onions.
The cultivation area for garlic and onion in India is unstable due to the garlic crop’s high susceptibility to disease, prompting farmers to transition to other commercial crops. Additionally, the volatile pricing of onions in India contributes to instability in cultivation areas. The factors attributed to the decline in the area under chilli cultivation are high cost of improved varieties of seed, and high cost of insecticides and fertilizers. According to Ramakrishnan et al.8 a lack of investment, outdated technology, a lack of research and development (R&D), and a lack of marketing competence all have a negative effect on the production of spice crops.
Conclusions
The current study found that while the area under cultivation for chili farming shows a negative trend, the production and productivity of all the crops under examination show increasing trends. More economical and sustainable farming methods are required due to the low growth in the area used for the cultivation of various crops, particularly chili, where the area exhibits a negative growth tendency. Low productivity growth for these crops is caused by a lack of investment in HYV seeds, low-level technologies, and a lack of research and development to boost productivity. Technical advancement is necessary to increase productivity and to compete in the global market.
The findings indicate that the compound growth rate in area for onion, garlic and ginger were found to be increasing but for chili the area under the crop was observed to be declining. Onion, ginger, and garlic recorded a positive compound growth (5.18, 3.93 , and 4.75 per cent, respectively) in area, while area of chili was negative (-0.27 per cent) during the period. The decline in area for chili cultivation was due to the high cost of insecticide and fertilizer, high cost of improved varieties of seed, and low prices of chili in the market. Moreover, all four spice crops recorded a positive growth in production during the period with ginger having the highest growth rate at 7.51 per cent. Likewise, the compound growth rate of yield showed positive trends for all the spice crops. The instability index for the production of onion, garlic, and ginger are found to be high. This may be due to bad weather condition or non-adoption of high yielding varieties by the farmers.
The current study indicates that efforts should be made to popularize the improved varieties among the farmers through imparting knowledge about HYV seeds among the farmers, distribution of HYV seeds, and expansion of area under cultivation is essential for sustainability of production . Productivity is to be enhanced through distribution of planting materials, disease control measures, and selection of appropriate spice crop according to agro climatic conditions and irrigation facilities.
Acknowledgement
The author is also profoundly grateful to Directorate of Economics and Statistics, Department of Agriculture, Government of India;Cooperation and Farmers Welfare, Ministry of Agriculture, Government of India; and National Horticulture Board for accessing Indian Horticulture Database.
Funding Sources
The author(s) received no financial support for the research, authorship, and/or publication of this article.
Conflict of Interest
The authors do not have any conflict of interest.
Data Availability Statement
The data supporting this study’s findings are available in the public domain and the data are obtained from the web sites of Government of India.
Ethics Statement
This research did not involve human participants, animal subjects, or any material that requires ethical approval.
Author Contributions
The sole author was responsible for the conceptualization, methodology, data collection, analysis, writing, and final approval of the manuscript.
Permission to reproduce material from other sources
The manuscript does not contain materials such as figures, tables, or text excerpts that have been previously published elsewhere.
References
- Haque, M. A., Miah, M. A. M., Hossain, S., Rahman, M. S., Moniruzzaman, M. Profitability of Onion Cultivation in Some Selected Areas of Bangladesh. Bangladesh J. Agric. Res. 2011; 36(3): 427–435.
CrossRef - Afrad, M. S. I., Akter, M. R. Growers’ Knowledge On Spices Cultivation in Shibganj Upazila Under Bogura District. International Journal of Agricultural Research Innovation and Technology. 2020 ;10(1): 102–107.
CrossRef - Islam, M. S., Rahman, K. M., Hasan, M. Profitability and Resource Use Efficiency of Producing Major Spices in Bangladesh. Bangladesh Journal of Agricultural Economics. 2011; 34(01-2): 1–13.
- Abid, S., Shah, N. A., Hassan, A., Farooq, A., Masood, M. A. Growth and Trend in Area, Production and Yield of Major Crops of Khyber Pakhtunkhwa, Pakistan. Asian Journal of Agriculture and Rural Development. 2014; 4: 149–155.
- Akhter, S., Sarker, J. R., Das, K. R. Growth and Trend in Area, Production, and Yield of Major Crops of Bangladesh. International Journal of Economics Finance and Management Sciences. 2016; 4(1): 20–25.
CrossRef - Islam, Q. M. S. H., Matin, M. A., Ossain, S. H. Economic Performance of Ginger (Zingiber Officinale Rose.) Cultivation in Some Selected Locations of Bangladesh. Bangladesh Journal of Agricultural Research. 2012; 37(1):109–120.
CrossRef - Fatima, A., Abid, S., & Naheed, S. Trends in Wholesale Prices of Onion and Potato in Major Markets of Pakistan:A Time Series Analysis. Pakistan Journal of Agricultural Research. 2015; 28(2): 152-158.
- Ramakrishnan, I.,Karthikeyan, S. Prospects and Problems of Spices Production in India-An Analysis.Bodhi International Journal of Research in Humanities , Arts and Science. 2021;5(3):130-132.