
Introduction
Common bean (Phaseolus vulgaris L.) is the most widely produced grain legume globally, with an annual production of 18.9 million tons. It serves as a primary source of protein and micronutrients for over two-thirds of the world’s population.1,2 As a staple food crop in many regions, particularly in Africa, Latin America, and Asia, common beans are critical for improving food security and addressing malnutrition.2,3 Rich in protein, iron, zinc, and bioactive compounds, common beans play an important role in combating nutrient deficiencies and preventing chronic diseases.4,5 Beyond their nutritional significance, common beans contribute to sustainable agriculture by fixing atmospheric nitrogen, improving soil fertility, and reducing reliance on synthetic fertilizers.6-8 However, climate change and shifting environmental conditions threaten the nutritional quality and productivity of common bean, with studies showing reduced iron content under drought stress.9 In Kashmir, erratic precipitation and anthracnose outbreaks reduce yields by up to 40%,10 exacerbating challenges like long cooking times and pest susceptibility in resource-constrained systems.11,12
Climate projections suggest that by 2050, up to 50% of current bean cultivation zones may become unsuitable due to rising temperatures, erratic rainfall, and extreme weather events.9,13 Moreover, region-specific biotic stresses, including anthracnose (Colletotrichum lindemuthianum) and common bacterial blight (Xanthomonas axonopodis), disproportionately affect smallholder farmers with limited access to crop protection.14 In low-income regions, common bean yields often stagnate below 600 kg/ha, exacerbating food insecurity.15 Overcoming these challenges requires climate-resilient cultivars that balance yield potential with stress adaptation.
Modern breeding tools like genome-wide association studies (GWAS) and CRISPR/Cas9 have accelerated trait discovery in common bean. For instance, García-Fernández et al. identified QTNs for pod morphology and drought tolerance,16 while GWAS in Medicago truncatula revealed conserved genetic mechanisms for seed size.17 However, phenotypic screening of landraces remains critical to validate these findings in target environments, especially in underrepresented regions like the Himalayas. Landraces, with their broader genetic base and local adaptation, are invaluable for breeding programs aiming to enhance yield stability, nutritional quality, and resilience.18,19
In India, common bean holds cultural and agronomic significance in Himalayan regions. Kashmir’s germplasm, derived from both Mesoamerican and Andean gene pools,10 exhibits exceptional diversity in seed morphology (e.g., size, color), micronutrient content, and disease resistance.10,20 However, systematic evaluations using multivariate approaches are lacking, limiting the utilization of this diversity in breeding.
To address this gap, our study aims to:
Quantify genetic variability and heritability for 11 agro-morphological traits in 75 Kashmiri common bean lines;
Decipher trait associations and genetic structure using PCA and hierarchical clustering;
Identify superior genotypes via LSI analysis, prioritizing lines exceeding yield and stress-tolerance thresholds;
Provide actionable insights for breeding programs targeting temperate agro-ecologies.
By integrating multivariate statistics with phenotypic screening, this study unlocks the potential of Kashmir’s germplasm. The findings will directly inform breeding strategies, with stress-resistant clusters to develop climate-smart varieties. Such efforts are essential to safeguard food security in climate-vulnerable temperate regions.
Materials and Methods
Study Area and Plant Material
The study was conducted at the Dryland Agricultural Research Station (DARS), SKUAST-K, located in Budgam, Jammu and Kashmir. The site is situated at 74.83°E longitude, 34.08°N latitude, and 1587 meters above sea level. Seventy-five common bean germplasm accessions, sourced from diverse regions of Kashmir, were selected for evaluation. The germplasm was sourced from diverse agro-ecological zones of Kashmir, ensuring representation of variation in seed morphology, growth habit, and stress adaptation. Detailed passport information, including site of collection and codes of individual germplasm lines, has been previously published in the DUS characterization study of these lines.21 The same germplasm lines were used in the present study to evaluate genetic variability and trait associations under augmented block design.
Experimental Design
The experiment was laid out in an augmented block design with four blocks, each containing 19 test entries and five standard checks. This design allowed for an effective comparison of a large number of unreplicated test entries against replicated checks to control environmental variation. Each entry was planted in a single row of 1.5 meters length, with a spacing of 40 cm between rows and 15 cm between plants. This setup minimized inter-plant competition and allowed uniform growth. Standard agronomic practices were followed throughout the cropping period.
Data Collection
Eleven agro-morphological traits were recorded, encompassing phenological, morphological, and yield-related parameters:
Phenological Trait
Days to 50% flowering (DF) (recorded on a plot basis).
Morphological Traits
Plant height (PH), pod length (PL), seeds per pod (SPP), seed length (SL), seed breadth (SB), and seed thickness (ST).
Yield-Related Traits
Pods per plant (PPP), seed yield per plant (SYPP), seed test weight (STW), and seed yield per hectare (SYPH).
For all traits except flowering, measurements were taken from five randomly selected competitive plants per plot at maturity to ensure accuracy and minimize bias. Flowering data were collected on a plot basis when approximately 50% of the plants exhibited open flowers.
Statistical Analysis
All statistical analyses were performed using R software (version 4.1.2) and SPSS (version 25.0). The following procedures were employed:
Descriptive Statistics
Means, standard deviations, and coefficients of variation (CV) were computed to summarize trait distributions.
Analysis of Variance (ANOVA)
Conducted to detect significant differences among germplasm lines for each trait (p ≤ 0.05, p ≤ 0.01).
Genetic Parameters
Genotypic (GCV) and phenotypic (PCV) coefficients of variation, broad-sense heritability (H²), and genetic advance as a percentage of the mean (GAM) were calculated following standard formulas.
Principal Component Analysis (PCA)
Conducted to identify traits contributing most to overall variation. Components with eigenvalues greater than 1 (Kaiser’s criterion) were retained for interpretation.
Hierarchical Clustering:
Performed using Ward’s method with Euclidean distance to group genotypes based on trait similarity. The optimal number of clusters was determined using the NbClust package in R.
Least Significant Increase (LSI) Analysis
Applied to identify genotypes exceeding the performance of the best checks.
The LSI threshold was calculated at a 5% significance level (p ≤ 0.05), and genotypes surpassing this threshold were considered superior for the respective trait.
Correlation Analysis
Pearson correlation coefficients were computed to examine trait associations and potential for co-selection.
Data visualization was conducted using the ggplot2, pals, and factoextra packages in R, and final outputs were compiled using the writexl package for reporting. All analyses adhered to established statistical protocols to ensure reproducibility and reliability of results.
Results
Phenotypic Variation and Trait Distribution
Substantial genetic variability was observed among the 75 common bean germplasm lines evaluated for 11 agro-morphological traits (Table 1). Plant height (PH) exhibited the highest phenotypic variability (CV = 64.41%), followed by pods per plant (PPP; CV = 41.99%), suggesting these traits hold strong potential for selection. Yield-related traits such as seed yield per plant (SYPP) and seed thickness (ST) showed moderate variability (CV = 35.99% and 35.90%, respectively), while traits like seeds per pod (SPP) and seed test weight (STW) demonstrated lower variability (CV = 14.72% and 22.53%). Days to 50% flowering (DF) showed moderate variability (CV = 39.22%), indicating potential for breeding programs to optimize flowering time for different agro-ecological zones
Table 1: Descriptive Statistics for 11 selected traits of common bean germplasm accessions
| Trait | Mean | Std. Deviation | Min | Max | CV (%) |
| Plant Height (PH) (cm) | 43.49 | 28.01 | 11.75 | 182.05 | 64.41 |
| Pod Length (PL) (cm) | 9.89 | 2.85 | 3.96 | 21.66 | 28.82 |
| Pods per Plant (PPP) | 19.36 | 8.13 | 2.36 | 46.55 | 41.99 |
| Seeds per Pod (SPP) | 6.18 | 0.91 | 4.08 | 8.88 | 14.72 |
| Seed Length (SL) (mm) | 12.04 | 3.12 | 4.3 | 21.42 | 25.91 |
| Seed Breadth (SB) (mm) | 6.04 | 1.66 | 3.41 | 9.5 | 27.48 |
| Seed Thickness (ST) (mm) | 4.15 | 1.49 | 1.1 | 7.35 | 35.9 |
| Seed Test Weight (STW) (g) | 39.14 | 8.82 | 14.81 | 56.05 | 22.53 |
| Seed Yield per Plant (SYPP) (g) | 45.7 | 16.45 | 11.16 | 100.33 | 35.99 |
| Seed Yield per Hectare (SYPH) (q/ha) | 9.13 | 3.29 | 2.24 | 20.06 | 36.04 |
| Days to 50% Flowering (DF) | 60.96 | 23.91 | 28.0 | 122.0 | 39.22 |
ANOVA and Trait Significance
ANOVA revealed highly significant differences (p ≤ 0.01) among accessions for most traits (Table 2), confirming the presence of substantial genetic variability. The significant Test vs. Check contrasts for nearly all traits, except pod length (PL) and seed breadth (SB), indicate the potential of certain lines to outperform existing checks. The non-significant block effects affirm the reliability of the field design and minimize confounding spatial variability.
Table 2: Analysis of Variance for Different Traits in Common Bean Accessions; NS P > 0.05; * P <= 0.05; ** P <= 0.01
| Mean Sq | ||||||||||||
| Source | Df | (PH) | (PL) | (PP) | (SPP) | (SL) | (SB) | (ST) | (STW) | (SYPP) | (SYPH) | (DF) |
| Treatment (Germplasm) | 79 | 663. 57 ** |
6.6 ** |
42.03 ** | 0.67 ** |
4.29 ** | 1.65 ** | 7.30 ** |
45.99 ** | 172.11 ** | 6.96 ** |
365.99 ** |
| Treatment: Check | 4 | 395. 0* |
10.33 ** | 8.65 * | 0.36 ** |
2.5 NS | 0.25 NS | 5.2* | 22.5 ** | 90 * | 2.25 NS | 250 ** |
| Treatment: Test | 74 | 670 * |
6.5 * | 44 ** | 0.75 ** |
3.8 ** | 1.6 ** | 12.0* | 44.5 ** | 170 ** | 7.1 * | 360 ** |
| Test vs Check | 1 | 1327. 14 ** |
8.48 ** | 67.24 ** | 12.62 ** |
42.92 ** | 7.32 ** | 18.24 ** |
101.12 ** | 290.58 ** | 7.89 ** |
600 ** |
| Block | 4 | 6.98 NS | 0.5 NS | 3.14 NS | 0.29 NS | 1.37 NS | 1.85 NS | 1.12 NS | 5 NS | 13.27 NS | 12.5 NS | 1.78 NS |
| Residuals | 16 | 158. 38 |
1.86 | 16.27 | 0.11 | 1.36 | 0.64 | 1.82 | 20.61 | 73.4 | 2.85 | 223.54 |
Genetic Parameters and Selection Potential
High genotypic variance (GV) and heritability (h²) estimates were observed for key traits (Table 3). PH (GV = 505.19; h² = 76.16%) and ST (GV=5.48; h² = 75.06%) demonstrated the highest genetic advance as a percentage of mean (GAM = 92.93% and 100.67%), indicating strong additive genetic effects and high selection efficiency. Traits like PPP (h² = 61.30%, GAM = 42.29%) and SYPP (h² = 57.36%, GAM = 33.92%) exhibited moderate heritability, suggesting the need for multi-environment trials to confirm their stability. The narrow GCV–PCV differences for traits like SPP, SL, and ST (Fig. 1) indicate that these traits are largely under genetic control, whereas wider gaps for SYPP and STW reflect stronger environmental influences.
Table 3: Genetic Variability Analysis of Common Bean Germplasm Traits
| Trait | Mean | GV | EV | PV | GCV (%) | PCV (%) | Heritability (h²) | Heritability Category | GA | GAM (%) |
| PH | 43.49 | 505.19 | 158.38 | 663.57 | 51.6 | 59.1 | 76.16 | High | 40.41 | 92.93 |
| PL | 9.89 | 4.74 | 1.86 | 6.60 | 21.9 | 26.0 | 71.82 | High | 3.80 | 38.43 |
| PP | 19.36 | 25.76 | 16.27 | 42.03 | 26.2 | 33.5 | 61.30 | Medium | 8.19 | 42.29 |
| SPP | 6.18 | 0.56 | 0.11 | 0.67 | 12.1 | 13.4 | 83.58 | High | 1.41 | 22.80 |
| SL | 12.04 | 2.93 | 1.36 | 4.29 | 14.1 | 17.2 | 68.27 | Medium | 2.91 | 24.19 |
| SB | 6.04 | 1.01 | 0.64 | 1.65 | 16.6 | 21.2 | 61.21 | Medium | 1.62 | 26.82 |
| ST | 4.15 | 5.48 | 1.82 | 7.30 | 17.9 | 20.6 | 75.06 | High | 4.18 | 100.67 |
| STW | 39.14 | 25.38 | 20.61 | 45.99 | 13.0 | 16.4 | 55.18 | Medium | 7.71 | 19.70 |
| SYPP | 45.70 | 98.71 | 73.40 | 172.11 | 21.7 | 28.3 | 57.36 | Medium | 15.50 | 33.92 |
| SYPH | 9.13 | 4.11 | 2.85 | 6.96 | 17.6 | 24.2 | 59.04 | Medium | 3.21 | 35.14 |
| DF | 60.96 | 142.45 | 223.54 | 365.99 | 19.6 | 24.8 | 38.93 | Low | 15.34 | 25.17 |
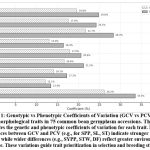 |
Figure 1: Genotypic vs Phenotypic Coefficients of Variation (GCV vs PCV) for 11 agro-morphological traits in 75 common bean germplasm accessions. The graph illustrates the genetic and phenotypic coefficients of variation for each trait. |
Principal Component and Cluster Analysis
Principal component analysis (PCA) revealed that the first three principal components accounted for 90.08% of the total variation, with PC1 (44.37%) primarily influenced by PH, PPP, and SYPP; PC2 (30.81%) by ST, STW, and SL; and PC3 (14.91%) by SB and DF (Table 4, Fig. 2). This indicates that breeding for yield potential should prioritize lines with high PH, PPP, and SYPP, while seed quality traits (size and shape) align with PC2. For example, Alr-36, Kdr-45, and Alr-28 clustered with high values for yield traits and seed thickness, whereas genotypes like Ppr-12 and Kdr-4 aligned with seed size traits.
Hierarchical clustering grouped the 75 lines into 16 distinct clusters (Fig. 3). The greatest inter-cluster distance (77.36) was observed between Clusters 1 and 10 (Fig. 4), as shown in the heatmap of inter-cluster distances. Cluster 1 contained early-flowering, tall plants with high pod number, ideal for short-season environments. Cluster 10, in contrast, comprised late-flowering, large-seeded lines suitable for niche markets. Clusters 9, 13, and 14 showed the highest intra-cluster variability, offering opportunities for within-cluster selection. These insights guide hybridization strategies, such as crossing divergent clusters (e.g., Cluster 1 × Cluster 10) to maximize heterosis for yield and stress tolerance.
Table 4: Principal Components (PCs) with eigenvalues >1 were retained for analysis. The first three PCs explained 90.08% of total variance, indicating their strong contribution to trait differentiation among genotypes.
| Principal Component | Eigenvalue | % Variance Explained | Cumulative Variance (%) |
| PC1 | 739.80 | 44.37 | 44.37 |
| PC2 | 513.60 | 30.81 | 75.18 |
| PC3 | 248.51 | 14.91 | 90.08 |
| PC4 | 73.60 | 4.41 | 94.50 |
| PC5 | 59.74 | 3.58 | 98.08 |
| PC6 | 11.35 | 0.68 | 98.76 |
| PC7 | 8.48 | 0.51 | 99.27 |
| PC8 | 7.93 | 0.48 | 99.75 |
| PC9 | 1.97 | 0.12 | 99.86 |
| PC10 | 1.64 | 0.10 | 99.96 |
| PC11 | 0.63 | 0.04 | 100.00 |
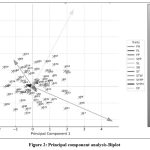 |
Figure 2: Principal component analysis-Biplot |
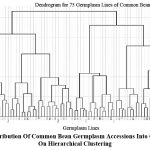 |
Figure 3: Distribution Of Common Bean Germplasm Accessions Into Custers Based On Hierarchical Clustering |
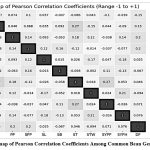 |
Figure 4: Heatmap Showing Intercluster Distances Among 16 Clusters |
Least Significant Increase (LSI) Analysis
The LSI analysis identified lines that exceeded best check thresholds (calculated at p ≤ 0.05 significance) for various traits (Table 5). Notably, Alr-36, Kdr-45, and Alr-28 outperformed checks in key yield-related traits such as PPP and SYPP. Alr-36 exceeded the LSI thresholds in six traits, PPP, SPP, ST, SYPP, SYPH, and SB, establishing it as a high-performing and broadly superior genotype. Similarly, Kdr-45 demonstrated exceptional performance across five traits, including ST, STW, and SYPP, indicating multi-trait superiority. The number of germplasm accessions exceeding LSI thresholds was highest for seed thickness (ST; 36 lines) and seed yield per plant (SYPP; 38 lines), underscoring considerable scope for selection. These findings empirically validate the genetic merit of these lines and reinforce their prioritization in breeding programs aimed at yield enhancement and stress adaptation.
Table 5: Germplasm lines exceeding best check thresholds based on Least Significant Increase (LSI) for key agro-morphological traits.
| Traits | Best Check | Threshold (Best Check + LSI) | Germplasm Lines Better than Best Check | No. of Better G-Lines |
| PH | Check 2 | 56.94 | Ppr-12, Kdr-4, Alr-92, Alr-20, Alr-58 | 5 |
| PL | Check 1 | 45.48 | Kdr-45, Alr-6, Alr-63, Alr-12, Ppr-3, Alr-64, Kdr-4, Alr-28, Alr-19, Alr-105, Ppr-14, Alr-76, Alr-9, Alr-18, Alr-89, Alr-55, Alr-10, Alr-67, Alr-14, Alr-33 | 20 |
| PP | Check 3 | 38.19 | Alr-36, Ppr-9, Alr-63, Kdr-77, Alr-84, Alr-79, Alr-87, Alr-86, Ppr-7, Ppr-15, Alr-64, Kdr-4, Alr-19, Alr-2, Alr-105, Kdr-25, Ppr-14, Alr-62, Alr-51, Alr-18, Alr-56, Alr-3, Alr-89, Alr-25, Alr-77, Alr-55, Alr-10, Alr-90, Gurez local, Alr-58, Alr-67, Alr-22, Alr-192 | 33 |
| SPP | Check 2 | 48.39 | Alr-36, Alr-7, Kdr-45, Alr-326, Alr-6, Kdr-77, Ppr-11, Alr-12, Alr-111, Ppr-15, Alr-64, Kdr-4, Alr-19, Kdr-25, Ppr-14, Alr-3, Ppr-13, Gurez local, Alr-85, Alr-14 | 20 |
| SL | Check 5 | 49.01 | Kdr-77, Ppr-15, Alr-105, Alr-51, Alr-9, Alr-18, Ppr-6, Alr-77, Kdr-12, Ppr-13, Alr-58, Alr-67, Alr-22, Alr-40 | 14 |
| SB | Check 2 | 46.67 | Alr-36, Kdr-45, Ppr-12, Alr-6, Alr-4, Ppr-11, Ppr-3, Ppr-15, Alr-2, Alr-76, Alr-51, Alr-66, Alr-9, Alr-20, Alr-16, Alr-17, Alr-57, Alr-58, Alr-37, Alr-85, Alr-22, Alr-192 | 22 |
| ST | Check 2 | 38.78 | Alr-36, Kdr-45, Alr-326, Ppr-12, Alr-84, Alr-15, Alr-4, Alr-87, Alr-12, Ppr-7, Ppr-3, Kdr-46, Alr-91, Alr-64, Kdr-4, Alr-2, Alr-105, Ppr-10, Alr-62, Alr-51, Alr-88, Alr-20, Alr-56, Alr-3, Alr-89, Ang local, Ppr-6, Alr-10, Kdr-12, Alr-17, Alr-57, Alr-58, Alr-37, Alr-14, Alr-192, Alr-156 | 36 |
| STW | Check 1 | 41.37 | Kdr-45, Ppr-12, Alr-63, Kdr-36, Ppr-1, Ppr-11, Alr-92, Alr-19, Alr-88, Alr-56, Alr-89, Ang local, Alr-77, Alr-55, Alr-57, Alr-67, Alr-37 | 17 |
| SYPP | Check 4 | 29.16 | Alr-36, Alr-24, Alr-7, Kdr-45, Alr-326, Ppr-12, Alr-6, Ppr-4, Alr-84, Alr-15, Ppr-11, Alr-79, Ppr-15, Kdr-4, Alr-28, Alr-105, Kdr-25, Ppr-14, Alr-62, Alr-51, Alr-66, Alr-9, Alr-73, Alr-3, Ang local, Alr-25, Alr-55, Alr-10, Ppr-13, Alr-57, Alr-58, Alr-67, Alr-37, Alr-81, Alr-22, Alr-40, Alr-33, Alr-156 | 38 |
| SYPH | Check 1 | 48.72 | Alr-36, Alr-7, Ppr-12, Kdr-36, Ppr-1, Alr-86, Kdr-46, Ppr-15, Alr-105, Alr-18, Alr-88, Alr-56, Alr-89, Ppr-13, Alr-58, Alr-22, Alr-40, Alr-156 | 18 |
| DF | Check 1 | 48.88 | Alr-24, Alr-7, Ppr-9, Ppr-12, Ppr-4, Alr-63, Alr-4, Alr-86, Alr-19, Alr-62, Alr-18, Alr-16, Gurez local, Alr-58 | 14 |
Trait Correlations
Correlation analysis (Fig. 5) revealed key trait associations with implications for breeding. The moderate positive correlation between SYPP and ST (r = 0.27) suggests that selecting for thicker seeds may indirectly enhance yield potential. However, breeders must balance this with market preferences, as thicker seeds may alter cooking times and texture. The positive correlation between PPP and DF (r = 0.20) indicates that extended flowering duration can support higher pod development, useful in environments with longer growing seasons. Conversely, the negative correlation between PH and DF (r = –0.15) suggests a trade-off: selecting for taller plants may inadvertently result in earlier flowering, a desirable trait for temperate, short-season regions.
|
Figure 5: Heatmap of Pearson Correlation Coefficients Among Common Bean Germplasm Traits |
These findings highlight substantial genetic variability among common bean germplasm lines, with traits such as plant height, seed thickness, and pods per plant emerging as promising targets for selection due to their high heritability and genetic advance. PCA and clustering revealed clear trait associations and genetic divergence, while LSI analysis confirmed several genotypes outperforming standard checks. Together, the results provide actionable insights for selection and diversity-based improvement strategies.
Discussion
This study reveals substantial agro-morphological diversity among 75 common bean lines from Kashmir, offering critical insights for trait-targeted breeding and genetic enhancement. The wide phenotypic variation, significant heritability estimates, and robust multivariate analyses underscore the potential of this germplasm for developing high-yielding, climate-resilient cultivars.
Phenotypic Variation, Heritability, and Genetic Advance
The observed variability across traits, especially plant height (PH; CV = 64.41%) and pods per plant (PPP; CV = 41.99%), reflects the diverse genetic background of the Kashmir germplasm. Similar trends have been reported previously, highlighting PH as a phenotypically plastic trait responsive to both genetic background and environmental stimuli.20,22 High heritability estimates for PH (76.16%), ST (75.06%), and SPP (83.58%) indicate strong additive genetic control, suggesting these traits are stable across environments and can be prioritized for selection in early generations. These findings are in agreement with previous reports indicating moderate to high heritability for morphological and agronomic traits in common bean.16,23,24 Conversely, environmental stresses have been shown to reduce heritability estimates, as noted in studies previous studies,25 emphasizing the genotype-by-environment interaction particularly for yield-associated traits.
Seed thickness (ST), in particular, exhibited the highest genetic advance as a percentage of mean (GAM = 100.67%), highlighting its utility as a selection target. Biologically, thicker seeds are often linked to improved seed coat integrity, higher protein reserves, and better resistance to mechanical damage during harvesting and storage.26,27 Similarly, PH influences light capture and canopy structure but must be balanced against the risk of lodging, especially under high-input conditions.28,29
PPP and seed yield per plant (SYPP) showed moderate heritability (61.30% and 57.36%) but high GAM (42.29% and 33.92%), results similar to the previous studies,30,31 suggesting that despite some environmental influence, these traits offer considerable potential for gain under selection. Conversely, days to flowering (DF) had lower heritability (38.93%), reflecting strong genotype-by-environment interactions, a finding consistent with earlier studies.25,32,33 This highlights the need for multi-environment trials to ensure stable flowering behavior across diverse agro-climatic zones.
Multivariate Analysis and Genetic Structure
The PCA identified PH, PPP, and SYPP as primary contributors to genetic variation, aligning with findings from Asfaw et al.,34 Kouam et al. ,35 and Girgel. 36 This confirms their importance as core yield determinants. Notably, genotypes such as Alr-36 and Kdr-45, which loaded heavily on PC1, exhibit a favorable combination of these traits, making them strong candidates for direct selection. PC2 (30.81% variance) captured seed size traits (ST, STW, SL), while PC3 (14.91%) included flowering time and seed breadth, underscoring the multi-dimensional nature of bean improvement.
Hierarchical clustering provided additional insights into genetic structure by grouping accessions into 16 clusters. Cluster 1 contained early-flowering, tall, and high-podding genotypes, ideal for short-season environments, while Cluster 10 comprised late-flowering, large-seeded lines suited for niche markets. The largest inter-cluster distance (77.36) between Clusters 1 and 10 indicates these are the most genetically divergent and should be prioritized for hybridization to exploit heterosis,35 as also demonstrated in chickpea and lentil.37-39 In particular, accessions at the extremes of clusters 1 and 10, such as Alr-37, Alr-28, and Kdr-12, were found to be genetically distinct and high-performing, making them ideal candidates for hybridization efforts aimed at improving yield and resilience.40,41 Within-cluster variability, notably in Clusters 9, 13, and 14, presents opportunities for refining specific traits like seed size and disease resistance. This variation within clusters can be targeted to refine specific agronomic traits, such as disease resistance or seed size, leading to the development of more stable, high-performing genotypes.42,43
Least Significant Increase (LSI) Analysis and Superior Genotypes
The LSI analysis applied a 5% significance threshold (p ≤ 0.05) to define “superior genotypes” as those exceeding the best-performing check for each trait. This method, validated in earlier studies,44,45,38 ensures the statistically robust identification of elite lines. Alr-36 exceeded the thresholds for six traits, including PPP, SPP, ST, and SYPP, confirming its broad agronomic superiority. Kdr-45 excelled across five traits, including ST, STW, and SYPP, whereas Alr-28 showed strong yield traits. By integrating LSI-based results with multivariate analysis, genetic merit of superior genotypes like that of Alr-36, Kdr-45, and Alr-28 can be empirically validated to offer immediate value for breeding programs targeting multi-trait improvement in temperate regions like Kashmir.38,44,45
Trait Associations and Breeding Implications
The correlation analysis provides practical guidance for breeders. The moderate positive correlation between SYPP and ST (r = 0.27) suggests that thicker seeds may contribute to higher yield, aligning with findings from Saba et al.46 However, this relationship may vary across environments, thicker seeds may enhance yield in high-rainfall areas due to reduced seed shattering but may prolong cooking time, affecting market acceptability.47 The positive correlation between PPP and DF (r = 0.20) indicates that longer flowering duration supports higher pod set, a relationship particularly relevant in environments with extended growing seasons.48-51 In contrast, the negative correlation between PH and DF (r = –0.15) suggests a trade-off: selecting for taller plants may inadvertently lead to earlier flowering, which could be advantageous for short-season systems but may limit biomass accumulation in longer seasons.52 These dynamics underscore the importance of co-selection strategies that balance trait interactions based on specific target environments.53,54 For example, breeders aiming for early-maturing, high-yielding varieties in temperate regions should prioritize lines with moderate PH, shorter DF, and high PPP, while those targeting high-value seed markets may focus on thicker seeds and uniform seed size. The integration of multi-trait selection indices and genomic prediction models could further optimize such breeding strategies, as discussed by Vieira et al.55
Contextualizing Findings and Future Directions
This study demonstrates that Kashmir’s common bean germplasm offers a rich resource for developing climate-resilient, high-yielding cultivars. However, the single-environment assessment limits the generalizability of the findings. Future research should validate these results across multiple agro-ecological zones and seasons to assess genotype-by-environment interactions.56,57 Additionally, incorporating molecular tools such as genome-wide association studies (GWAS) and marker-assisted selection (MAS) could accelerate the identification of stable, high-performing lines.58,59 Biologically, key traits like seed thickness may enhance protein content and seed viability,46 while plant height influences competitive ability and photosynthetic efficiency,60 traits that must be balanced for optimal performance. The practical application of trait correlations, cluster insights, and LSI-validated lines provides breeders with a roadmap for designing crossing programs tailored to specific environmental and market demands.34,59 By situating these findings within the broader context of legume improvement, this study lays the groundwork for future breeding efforts aimed at ensuring food and nutritional security in the face of climate change.
Conclusions
This study offers a comprehensive evaluation of 75 common bean germplasm lines from Kashmir, revealing substantial agro-morphological diversity that holds immense potential for breeding programs. The findings highlight the high variability across key traits like PH and PPP, with moderate to high heritability estimates for these traits, emphasizing their genetic control and suitability for direct selection in breeding programs. Furthermore, the high genetic advance as a percentage of mean (GAM) for ST validates its potential as a target for selection. Multivariate analyses, including PCA and hierarchical clustering, revealed clear trait associations and significant genetic divergence within the germplasm. Notably, Alr-36, Kdr-45, and Alr-28 were identified as superior genotypes, consistently outperforming best checks across multiple key yield-related traits. This underscores their value for future breeding efforts aimed at improving yield and stress resilience in temperate regions like Kashmir. Moreover, the LSI analysis further confirmed the merit of these genotypes, offering empirical validation of their genetic superiority. The study also demonstrated the complex interactions among key traits, such as the positive correlation between SYPP and ST, which suggests that thicker seeds may contribute to higher yield potential, and the inverse relationship between PH and DF, indicating the potential for early-maturing genotypes in breeding programs. These findings provide a strong foundation for the development of targeted breeding strategies, particularly for improving the yield and adaptability of common bean in diverse agro-ecological regions. By integrating heritability estimates, genetic advance, and trait correlation data, the study offers actionable insights for improving the genetic quality of common bean germplasm for future agricultural productivity.
Acknowledgment
The authors sincerely thank the Dryland Agriculture Research Station, SKUAST-K, Budgam, and the Department of Botany, University of Kashmir, for their invaluable support and resources. Special thanks are extended to the technical staff for their dedicated assistance in carrying out the field experiments.
Funding Sources
The authors received no financial support for the research, authorship, and/or publication of this article.
Conflicts of Interest
The authors do not have any conflict of interest.
Data Availability Statement
The data supporting this study’s findings are available from the corresponding authors upon reasonable request.
Informed consent statement
This study did not involve human participants, and therefore, informed consent was not required.
Ethics Statement
This research did not involve human participants, animal subjects, or any material that requires ethical approval.
Permission to reproduce material from other sources
Not Applicable
Author Contributions
Saima Fayaz: Data collection, analysis, and Writing the Original Draft.
Ajaz Ahmad Lone: Conceptualization, Methodology, Supervision.
Zahoor Ahmad Dar: Visualization, Review, and Editing.
Muneeb Ahmad Rather: Writing, Review, and Editing.
Munezeh Rashid: Writing, Review, and Editing.
Bilal Ahmad Mir: Visualization, Review, and Editing.
Latif Ahmad Peer: Conceptualization, Methodology, Supervision, Review and Editing.
References
- Myers JR, Kmiecik K. Common Bean: Economic Importance and Relevance to Biological Science Research. In: Pérez de la Vega M, Santalla M, Marsolais F, eds. The Common Bean Genome. Springer International Publishing; 2017:1-20.
CrossRef - Lisciani S, Marconi S, Le Donne C, et al. Legumes and common beans in sustainable diets: nutritional quality, environmental benefits, spread and use in food preparations. Fronteirs in Nutrition. 2024;11:1385232. doi:10.3389/fnut.2024.1385232
CrossRef - Uebersax MA, Cichy KA, Gomez FE, et al. Dry beans (Phaseolus vulgaris L.) as a vital component of sustainable agriculture and food security—A review. Legume Science. 2023;5(1):e155.
CrossRef - Mullins AP, Arjmandi BH. Health Benefits of Plant-Based Nutrition: Focus on Beans in Cardiometabolic Diseases. Nutrients. 2021;13(2)doi:10.3390/nu13020519
CrossRef - Gorbe E, Morard M, Rausell-Moreno A, Calatayud Á, Penella C. Exploring nutritional quality and bioactive compounds in Mediterranean bean landraces. Journal of Food Composition and Analysis. 2025;142:107433. doi:https://doi.org/10.1016/j.jfca.2025.107433
CrossRef - Singh A, Schöb C, Iannetta PPM. Nitrogen fixation by common beans in crop mixtures is influenced by growth rate of associated species. BMC Plant Biology. 2023;23(1):253. doi:10.1186/s12870-023-04204-z
CrossRef - Kebede E. Contribution, Utilization, and Improvement of Legumes-Driven Biological Nitrogen Fixation in Agricultural Systems. Review. Frontiers in Sustainable Food Systems. 2021;5 (2021). doi:10.3389/fsufs.2021.767998
CrossRef - Castro-Guerrero NA, Isidra-Arellano MC, Mendoza-Cozatl DG, Valdés-López O. Common Bean: A Legume Model on the Rise for Unraveling Responses and Adaptations to Iron, Zinc, and Phosphate Deficiencies. Mini Review. Frontiers in Plant Science. 2016;7(2016). doi:10.3389/fpls.2016.00600
CrossRef - Hummel M, Hallahan BF, Brychkova G, et al. Reduction in nutritional quality and growing area suitability of common bean under climate change induced drought stress in Africa. Scientific Reports. 2018;8(1):16187. doi:10.1038/s41598-018-33952-4
CrossRef - Choudhary N, Hamid A, Singh B, et al. Insight into the origin of common bean (Phaseolus vulgaris L.) grown in the state of Jammu and Kashmir of north-western Himalayas. Genetic Resources and Crop Evolution. 2018;65(3):963-977. doi:10.1007/s10722-017-0588-z
CrossRef - Munthali J, Nkhata SG, Masamba K, Mguntha T, Fungo R, Chirwa R. Soaking beans for 12 h reduces split percent and cooking time regardless of type of water used for cooking. Heliyon. 2022;8(9):e10561. doi:https://doi.org/10.1016/j.heliyon.2022.e10561
CrossRef - Muroki MW, Waswa LM, Fungo R, Kabwama A, Mahungu SM. Cooking properties and nutrient retention of biofortified common bean (Phaseolus vulgaris) varieties: The case of Burundi. Original Research. Frontiers in Sustainable Food Systems. 2023;7(2023). doi:10.3389/fsufs.2023.1062978
CrossRef - Mombo V-G, Duvallet M, Schaeffer M, Baarsch F. Have crops already reached peak suitability: assessing global climatic suitability decreases for crop cultivation. Environmental Research Letters. 2025;20:034009. doi:10.1088/1748-9326/adacfe
CrossRef - Queiroz SB, Stangarlin JR, Duarte Júnior JB, Röder C, Carvalho JC, Rosa WB. In vitro action of aminoacid-metals chelates on Colletotrichum lindemuthianum and Xanthomonas axonopodis pv. phaseoli. Scientia Agraria Paranaensis. 18(1):82–87.
- Porch TG, Beaver JS, Debouck DG, Jackson SA, Kelly JD, Dempewolf H. Use of Wild Relatives and Closely Related Species to Adapt Common Bean to Climate Change. Agronomy. 2013;3(2):433-461.
CrossRef - García-Fernández C, Campa A, Garzón AS, Miklas P, Ferreira JJ. GWAS of pod morphological and color characters in common bean. BMC Plant Bioliogy. 2021;21(1):184. doi:10.1186/s12870-021-02967-x
CrossRef - Chen Z, Lancon-Verdier V, Le Signor C, She Y-M, Kang Y, Verdier J. Genome-wide association study identified candidate genes for seed size and seed composition improvement in M. truncatula. Scientific Reports. 2021;11(1):4224. doi:10.1038/s41598-021-83581-7
CrossRef - Yeken MZ, Emiralioğlu O, Çiftçi V, Bayraktar H, Palacioğlu G, Özer G. Analysis of genetic diversity among common bean germplasm by start codon targeted (SCoT) markers. Molecular Biology Reports. 2022;49(5):3839-3847. doi:10.1007/s11033-022-07229-z
CrossRef - Gioia T, Logozzo G, Marzario S, Spagnoletti Zeuli P, Gepts P. Evolution of SSR diversity from wild types to U.S. advanced cultivars in the Andean and Mesoamerican domestications of common bean (Phaseolus vulgaris). PLOS ONE. 2019;14(1):e0211342. doi:10.1371/journal.pone.0211342
CrossRef - Jan S, Rather IA, Sofi PA, et al. Characterization of common bean (Phaseolus vulgaris L.) germplasm for morphological and seed nutrient traits from Western Himalayas. Legume Science. 2021;3(2):e86.
CrossRef - Fayaz S, Rather MA, Lone AA, et al. Morphological Characterization and Phenotypic Variability of Common Bean (Phaseolus vulgaris L.) Germplasm Lines from Kashmir. Current Agriculture Research. 2025;13(1)doi:http://dx.doi.org/10.12944/CARJ.13.1.22
CrossRef - Geleta RJ, Roro AG, Terfa MT. Phenotypic and yield responses of common bean (Phaseolus vulgaris l.) varieties to different soil moisture levels. BMC Plant Biology. 2024;24(1):242. doi:10.1186/s12870-024-04856-5
CrossRef - Welde K, Negash G. Studies on Genetic Variability of Common Bean (Phaseolus vulgaris L.) Varieties for Yield and Yield Related Traits in Western Ethiopia. International Journal of Applied Agricultural Sciences. 2022;8(1):41-49. doi:10.11648/j.ijaas.20220801.15
CrossRef - Mesera E, Shifaraw G, Alamerew S, Amsalu B. Genetic variability analysis and association of traits in common bean (Phaseolus vulgaris L.) landraces collected from Ethiopia at Jimma. Advances in Agriculture. 2022;2022(1):4400711.
CrossRef - Farid M, Earl HJ, Pauls KP, Navabi A. Response to selection for improved nitrogen fixation in common bean (Phaseolus vulgaris L.). Euphytica. 2017;213(4):99. doi:10.1007/s10681-017-1885-5
CrossRef - Nicolás-García M, Perucini-Avendaño M, Perea-Flores MdJ, Camacho-Díaz BH, Dávila-Ortiz G. Effect of post-harvest storage on the chemical and microstructural characteristics of the common bean (Phaseolus vulgaris L.). Food Chemistry. 2024;460:140680. doi:https://doi.org/10.1016/ j.foodchem.2024.140680
CrossRef - Ramtekey V, Cherukuri S, Kumar S, et al. Seed Longevity in Legumes: Deeper Insights Into Mechanisms and Molecular Perspectives. Systematic Review. Frontiers in Plant Science. 2022;13(2022). doi:10.3389/fpls.2022.918206
CrossRef - Murchie EH, Burgess AJ. Casting light on the architecture of crop yield. Crop and Environment. 2022;1(1):74-85. doi:https://doi.org/10.1016/j.crope.2022.03.009
CrossRef - Musana R, Rucamumihigo F, Nirere D, Mbaraka S. Growth and yield performance of common bean (Phaseolus vulgaris L.) as influenced by plant density at Nyagatare, East Rwanda. African Journal of Food, Agriculture, Nutrition and Development. 2020;20(4):16249-16261.
CrossRef - Arriagada O, Arévalo B, Cabeza RA, Carrasco B, Schwember AR. Meta-QTL Analysis for Yield Components in Common Bean (Phaseolus vulgaris L.). Plants (Basel). 2022;12(1). doi:10.3390/plants12010117
CrossRef - Patel D, Modha K, Kyada A, et al. Genetic variability analysis for yield and yield attributes among determinate “Wal” type Indian bean [Lablab purpureus (L.) Sweet] genotypes. Electronic Journal of Plant Breeding. 2022;13(4):1207-1213.
CrossRef - Nascimento M, Nascimento ACC, Silva FFE, et al. Quantile regression for genome-wide association study of flowering time-related traits in common bean. PLoS One. 2018;13(1):e0190303. doi:10.1371/journal.pone.0190303
CrossRef - Mudasir S, Sofi P, Khan M, Sofi N, Dar Z. Genetic diversity, variability and character association in local common Bean (Phaseolus vulgaris L.) germplasm of Kashmir. Electronic Journal of Plant Breeding. 2012;3(3):883-891.
- Asfaw A, Ambachew D, Shah T, Blair MW. Trait Associations in Diversity Panels of the Two Common Bean (Phaseolus vulgaris L.) Gene Pools Grown under Well-watered and Water-Stress Conditions. Fronteirs in Plant Science. 2017;8:733. doi:10.3389/fpls.2017.00733
CrossRef - Kouam EB, Kamga-Fotso AM-A, Anoumaa M. Exploring agro-morphological profiles of Phaseolus vulgaris germplasm shows manifest diversity and opportunities for genetic improvement. Journal of Agriculture and Food Research. 2023;14:100772. doi:https://doi.org/10.1016/j.jafr.2023.100772
CrossRef - Girgel U. Principle component analysis (PCA) of bean genotypes (Phaseolus vulgaris L.) concerning agronomic, morphological and biochemical characteristics. Applied Ecology and Environmental Research. 2021;19(3):1999-2011.
CrossRef - Upadhyay D, Pandey KK. Studies on Genetic Divergence in Faba Bean (Vicia faba L.). Indian Journal Of Agricultural Research. 2024. doi:10.18805/IJARe.A-6268
CrossRef - Peer LA, Dar ZA, Lone AA, Bhat MY. Genetic diversity analysis in maize landraces under temperate ecology. Agricultural Science Digest-A Research Journal. 2022;42(5):541-547. 10.18805/ag.D-5490
CrossRef - Thamaraiselvi S, Raja AA, Geethanjali S, Raja P, Karthikeyan S. Diversity analysis for phenotypic and qualitative traits of broad bean (Vicia faba L.): An underutilized vegetable crop of India by multivariate analysis. Legume Research. 2024;47(8):1274-1281.
CrossRef - AlBallat IA, Al-Araby AAA-M. Characterization, Genetic Diversity, and Clustering of Common Bean (Phaseolus vulgaris L.) Accessions Based on Seed Yield and Related Traits. Egyptian Journal of Horticulture. 2019;46(2):195-213. doi:10.21608/ejoh.2019.14116.1110
CrossRef - Parker TA, Gallegos JA, Beaver J, et al. Genetic Resources and Breeding Priorities in Phaseolus Beans. Plant Breeding Reviews. 2022:289-420.
CrossRef - de Paula E, Almeida RN, Santos TO, et al. Genetic Diversity of Common Bean (Phaseolus vulgaris L.) Landraces Based on Morphological Traits and Molecular Markers. Plants (Basel). 2024;13(18). doi:10.3390/plants13182584
CrossRef - Musango R, Kudzai K, Mhungu S, Tibugar H. Phenotypic characterization of common bean (Phaseolus vulgaris L.) accessions conserved at the genetic resources and biotechnology institute. Journal of Biodiversity and Environmental Sciences. 2016;8(6):26-36.
- Assefa T, Rao IM, Cannon SB, et al. Improving adaptation to drought stress in white pea bean (Phaseolus vulgaris L.): Genotypic effects on grain yield, yield components and pod harvest index. Plant Breeding. 2017;136(4):548-561.
CrossRef - Malek MA, Rafii MY, Shahida Sharmin Afroz M, Nath UK, Mondal MMA. Morphological Characterization and Assessment of Genetic Variability, Character Association, and Divergence in Soybean Mutants. The Scientific World Journal. 2014;2014(1):968796. doi:https://doi.org/10.1155/2014/968796
CrossRef - Saba I, Sofi P, Zeerak N, Bhat M, Mir R. Characterisation of a core set of common bean (Phaseolus vulgaris L.) germplasm for seed quality traits. SABRAO Journal of Breeding and Genetics. 2016;48(3):359-376.
- Sofi PA, Mir RR, Zargar SM, et al. What makes the beans (Phaseolus vulgaris L.) soft: insights into the delayed cooking and hard to cook trait. Proceedings of the Indian National Science Academy. 2022;88(2):142-159. doi:10.1007/s43538-022-00075-4
CrossRef - Peksen E. Dynamics of flower appearance, flowering, pod and seed setting performance and their relations to seed yield in common bean (Phaseolus vulgaris L.). Pakistan Journal of Botany. 2007;39(2):485.
- Pérez-Barbeito M, González AM, Rodiño AP, De Ron AM, Santalla M. Effects of planting season and plant cultivar on growth, development, and pod production in snap bean (Phaseolus vulgaris L.). Australian Journal of Agricultural Research. 2008;59(12):1121-1129.
CrossRef - Karavidas I, Ntatsi G, Vougeleka V, et al. Agronomic Practices to Increase the Yield and Quality of Common Bean (Phaseolus vulgaris L.): A Systematic Review. Agronomy. 2022;12(2):271.
CrossRef - Papathanasiou F, Ninou E, Mylonas I, et al. The Evaluation of Common Bean (Phaseolus vulgaris L.) Genotypes under Water Stress Based on Physiological and Agronomic Parameters. Plants (Basel). 2022;11(18)doi:10.3390/plants11182432
CrossRef - Sofi PA, Ahmad R, Shafi S, et al. Evaluation of common bean (Phaseolus vulgaris L.) germplasm for agro-morphological and yield traits and resistance to bean common mosaic virus (BCMV) in Western Himalayan Kashmir. Indian Journal of Plant Genetic Resources. 2022;35(02):241-249.
CrossRef - Jha PK, Beebe S, Alvarez-Toro P, Mukankusi C, Ramirez-Villegas J. Characterizing patterns of seasonal drought stress for use in common bean breeding in East Africa under present and future climates. Agricultural and Forest Meteorology. 2023;342:109735. doi:https://doi.org/10.1016/ j.agrformet.2023.109735
CrossRef - González AM, Yuste-Lisbona FJ, Saburido S, et al. Major Contribution of Flowering Time and Vegetative Growth to Plant Production in Common Bean As Deduced from a Comparative Genetic Mapping. Original Research. Frontiers in Plant Science. 2016;7. doi:10.3389/fpls.2016.01940
CrossRef - Vieira RA, Nogueira APO, Fritsche-Neto R. Optimizing the selection of quantitative traits in plant breeding using simulation. Review. Fronteirs in Plant Science. 2025;16. doi:10.3389/fpls.2025. 1495662
CrossRef - Caproni L, Raggi L, Tissi C, Howlett S, Torricelli R, Negri V. Multi-Environment Evaluation and Genetic Characterisation of Common Bean Breeding Lines for Organic Farming Systems. Sustainability. 2018;10(3):777.
CrossRef - Burbano-Erazo E, León-Pacheco RI, Cordero-Cordero CC, López-Hernández F, Cortés AJ, Tofiño-Rivera AP. Multi-Environment Yield Components in Advanced Common Bean (Phaseolus vulgaris L.) × Tepary Bean (P. acutifolius A. Gray) Interspecific Lines for Heat and Drought Tolerance. Agronomy. 2021;11(10):1978.
CrossRef - Mir RR, Choudhary N, Bawa V, et al. Allelic diversity, structural analysis, and Genome-Wide Association Study (GWAS) for yield and related traits using unexplored common bean (Phaseolus vulgaris L.) germplasm from Western Himalayas. Fronteirs in Genetics 2021;11:609603. doi:https://doi.org/10.3389/fgene.2020.609603
CrossRef - Assefa T, Assibi Mahama A, Brown AV, et al. A review of breeding objectives, genomic resources, and marker-assisted methods in common bean (Phaseolus vulgaris L.). Molecular Breeding. 2019;39(2):20. doi:10.1007/s11032-018-0920-0
CrossRef - Keller B, Soto J, Steier A, et al. Linking photosynthesis and yield reveals a strategy to improve light use efficiency in a climbing bean breeding population. Journal of Experimental Botany. 2023;75(3):901-916. doi:10.1093/jxb/erad416
CrossRef
Abbreviations:
ANOVA (Analysis of Variance),
CV (Coefficient of Variation),
DF (Days to 50% Flowering),
EV (Environmental Variance),
GAM (Genetic Advance as % of Mean),
GCV (Genotypic Coefficient of Variation),
GV (Genotypic Variance),
GWAS (Genome-Wide Association Study), h² (Broad-Sense Heritability),
LSI (Least Significant Increase),
PCA (Principal Component Analysis),
PCA (Phenotypic Coefficient of Variation),
PH (Plant Height),
PL (Pod Length),
PPP (Pods per Plant),
PV (Phenotypic Variance),
SB (Seed Breadth),
SL (Seed Length),
SPP (Seeds per Pod),
ST (Seed Thickness),
STW (Seed Test Weight),
SYPH (Seed Yield per Hectare),
SYPP (Seed Yield Per Plant).