
Introduction
Agriculture plays a crucial role in sustaining livelihoods and ensuring food security, particularly in developing economies where a large share of the population depends on farming. In countries such as India, Bangladesh, and Brazil, agriculture contributes not only to national income but also to rural employment and overall socio-economic development. In India, agriculture and allied sectors contribute 20.2% to the total Gross Value Added (GVA) of the economy.1 Agricultural and development economics both flowed as sub fields in the middle of the twentieth century.2,3 Agriculture forms the backbone of Nadia District’s economy, providing sustenance to a substantial portion of its population engaged in farming activities.4 Located in the state of West Bengal, India, Nadia District is endowed with favorable agro-ecological conditions, including fertile alluvial soils and abundant water resources, which provide an enabling environment for diverse agricultural activities.5 From the cultivation of staple crops like paddy and jute to the flourishing horticultural endeavors, Nadia’s agricultural canvas is a tapestry of agricultural diversity.6 The district’s fertile alluvial soils and the role of natural irrigation from the Ganges River in supporting agricultural activities. The study also emphasized the significance of water management systems in enhancing agricultural productivity. Paddy remains the most dominant cereal crop in the region, while jute, wheat, mustard, along with a range of vegetables and fruits, make substantial contributions to overall agricultural production.7 The studies underscore that crop diversification plays a crucial role in enhancing food security and improving farmers’ income stability.8
Historically, the cultivation of jute, also known as the “Golden Fiber,” has been a significant economic driver for Nadia District, contributing to the state’s reputation as a major jute-producing region.9 Alongside jute, the cultivation of paddy, the staple cereal crop, forms the backbone of the district’s agricultural landscape.10 However, with changing times and evolving market demands, the agricultural sector has also witnessed shifts towards horticulture, animal husbandry, and agro-processing industries.11
Agricultural efficiency is broad and comprehensive term as it includes various agricultural elements like crop productivity, input-output ratio, labor productivity, grain production per head. All are specific measurements to show the agricultural efficiency of a region. “Productivity is commonly defined as a volume measure of output to a volume measure of input use” (OECD).12
Agricultural productivity is a quantitative term and it measures the capacity of agricultural land. In general, agricultural productivity means the crop output per unit agricultural land. The productivity is the ratio of farm output and farm input.
The development of agricultural sector means the development of rural area and further leading toward rural conversion.13 Sustainable agricultural development is a complete and balanced process that depends on several factors such as crop productivity, crop diversification, and agricultural efficiency. The level of agricultural development in Nadia varies from block to block because of differences in natural and human factors affecting farmland. It is influenced by many related elements, including fertile soil, human labor, use of unused cultivable land, farm mechanization, proper planning, and crop productivity.14 The impact of various government schemes, such as Krishi Vigyan Kendras (Agricultural Science Centers) and subsidies on inputs on farmer livelihoods and productivity.15
Previous studies have examined individual aspects of agriculture in Nadia, including crop diversity, irrigation systems, and the role of government schemes in promoting productivity. These works offer important insights into agricultural resources and cropping patterns. However, they largely analyze agriculture at broad spatial scales or emphasize thematic components without assessing the district in a spatially comparative manner. Despite notable intra-district variation in irrigation access, soil fertility, mechanization, and land-use intensity, there is limited research that evaluates agricultural performance at the block level. This gap is significant because agricultural development is uneven across the blocks of Nadia, and effective planning and resource allocation require an understanding of these disparities. A spatially explicit block-level assessment can reveal localized strengths and constraints that remain obscured in district- or state-level analyses. Therefore, the present study aims to evaluate agricultural development across the blocks of Nadia District through indicators of productivity, diversification, and efficiency. The objective is to measure the extent of variation, identify regions of relative advancement or backwardness, and provide insights useful for targeted agricultural planning and policy formulation.
Study Area
Nadia district, located in the southeastern part of West Bengal, (Figure 1), covering an area of approximately 3,927 sq. km. It is strategically bordered by Bangladesh to the east, Murshidabad district to the north, North 24 Parganas to the south, and Hooghly district to the west, giving it a pivotal geographical position. The Ganges River, considered the lifeline of the region, flows along its western and northern boundaries. With its fertile alluvial soil, abundant water resources, and proximity to major river systems, Nadia district is highly suitable for agriculture and holds significant potential for sustained agricultural development.
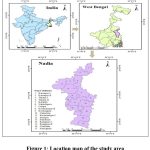 |
Figure 1: Location map of the study area |
Materials and Methods
To carry out a detailed study on agricultural development in Nadia District, West Bengal, a mixed research method is used, which includes both qualitative and quantitative approaches. The method includes collecting data from secondary sources and then analyzing the information using suitable analytical techniques. The present study is based on secondary data obtained from the District Statistical Handbook of Nadia, published by the Bureau of Applied Economics and Statistics, Government of West Bengal.16 Official reports from the Department of Agriculture, Government of West Bengal and relevant agricultural departments provide data on crop production, yield and implementation of agricultural schemes in Nadia district.17,18 Academic publications, research papers and studies related to agricultural development, crop diversification, and sustainability in the region are reviewed to gain insights from previous research. Data from the agricultural census and other statistical sources offer valuable information on land use, farm size and demographic characteristics. GIS techniques are utilized to map and analyze spatial data, including land use patterns, cropping intensity, and agricultural infrastructure. GIS helps in visualizing and understanding the spatial distribution of agricultural activities in Nadia district.
Agricultural Development
Nadia District is selected as the primary unit of analysis, and agricultural development is evaluated using several key indicators, including land use patterns, crop production, irrigation facilities, farm mechanization, and the use of agricultural inputs. The dataset covers important variables such as net sown area, gross cropped area, cropping intensity, yield of major crops (paddy, wheat, jute, pulses, and oilseeds), sources of irrigation (tube wells and tanks), and the application of fertilizers, pesticides, and high-yielding varieties (HYVs). All indicators are standardized using the Z-score method to facilitate comparison of agricultural development across different blocks. The Z-score converts raw values into a common measurement scale, ensuring accuracy and comparability. The Z-score is calculated as;
Where; Zij is the standard value of the ith indicator in the jth unit, Xij is the actual value
Xi is the mean value, σi is the standard deviation of the indicator
The Composite Z-score (Cs) is calculated by summing the Z-scores of multiple agricultural indicators for each block of Nadia district, offering an overall measure of agricultural performance. Blocks with high positive Cs values exhibit advanced agricultural development, while those with negative Cs values indicate lower agricultural performance. To facilitate spatial representation, choropleth maps have been generated using GIS software, categorizing blocks into high, medium, and low agricultural development zones based on statistical classification. The classification is determined using mean and standard deviation values derived from 2014 data. The algebraic expression is,

Where; CS represents the Composite Z-Score, represents the Z-Score of all indicators in ‘i’ units, ‘N’ is the total number of indicators
Crop Productivity: In the study, agricultural productivity is measured by using M. Shafi’s method.19 Aus, Aman, Boro, Wheat, Jute, Gram and Mustard are selected for the present study. The above-said seven crop of Nadia district covers 86.3 percent area. M. Shafi’s method narrate the summation of the total yield of all the crops in a block divided by the total area under the same crops in a block. The position so obtained is examined in relation to the total yield of all the crops considered at the district level divided by the total area under those crops at the district level.
The Shafi’s algorithm is
![]()
Where; Pi=Agricultural Productivity Index. y= Yield of the 1 to nthth crops at the block level. t= Area under crops 1 to nth at the block level. Y= Yield of the 1 to nth crops at the district level. T= total area of the crops 1 to nth at the district level.
To measure the crop diversification of Nadia district two type of indices are used, they are as follows;
Herfindahl Index (HI): Herfindahl index is calculated by taking sum of squares of acreage proportion of each crop in total cropped area. The formula is following;
![]()
Where; N = The total number of crops; Pi = It represents acreage proportion of the i-th crop in total cropped area; Its value is defined by 0 and 1. High value of HI indicates low diversity and low value indicates high diversity. The index value is 1 when there is a complete specialization.
Simpson Index (SI): Simpson’s index measures the horizontal diversification. Horizontal diversification means how many crops are increased in the same field. The Simpsons index measures diversification away from the food grains. The formula is following;
SI = 1- (Proportionate area of food grains in the gross cropped area)
![]()
Where; N = The total number of crops; Pi = It represents acreage proportion of the i-th crop;
Its value also lies between 0 and 1. SI is a measure of diversification and is measured as SI=1−HI.
Agricultural Efficiency
Agricultural efficiency refers to the extent to which agricultural resources, such as labor, land, capital and technology are exploited to maximize outputs like crop yields or livestock production. It signifies the ability to achieve higher productivity and output levels while minimizing input wastage. M.G Kendal (1939) in his paper “The geographical distribution of crop productivity in England” used a simple method to measure agricultural efficiency.20 M. Shafi (1960) also used the same technique to measure agricultural efficiency of Uttar Pradesh.21 The Kendall’s method is known as ‘Ranking Co-efficient’.
![]()
Where; ‘R’ is the rank of crop based on its yield rate. ‘N’ is the total no of crops.
Results
Diversity of Crops in Nadia District
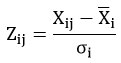
Nadia District has a rich agricultural landscape, growing staple food crops, cash crops, and fruits and vegetables. The main crops are paddy (rice) and jute, which are very important for the economy and culture of the region. The land is fertile due to the Bhagirathi River, the climate is good for farming, and there is a strong irrigation system that helps with crop growth.22,23 Jute is another major crop in Nadia. It is called the “Golden Fiber” and is used for making sacks, eco-friendly bags, and textiles.24,25 The climate and soil in Nadia are great for jute farming, and the district is one of the top producers in West Bengal. The government reports show that about 50 thousand metric tons (Figure 2) of jute are produced here. Many people in rural areas work in the jute industry, making it very important for jobs and the local economy. Wheat production is around 20 thousand metric tons, while mustard is about 15 thousand metric tons (Figure 2). The district also produces pulses, vegetables, and fruits like mangoes, guavas, and litchis. Vegetables and fruits have production levels of 25 and 30 thousand metric tons, respectively, and they help support local markets and food industries. The government supports farmers by providing subsidies, better farming techniques, and sustainable farming programs.26,27 The bar graph (Figure 2) shows that rice and jute are the most produced crops, followed by wheat, mustard, pulses, vegetables, and fruits. This data highlights how important agriculture is to the economy of Nadia District.
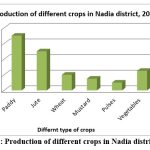 |
Figure 2: Production of different crops in Nadia district, 2018 |
Irrigation and Water Management
The Ganges River and its distributaries play a vital role for natural irrigation to Nadia district. The district’s strategic location has a significant advantage for agricultural activities. Besides natural irrigation, Nadia also benefits from a well-developed irrigation infrastructure that includes river lift irrigation, deep tubewell, ponds and embankments.
 |
Figure 3: Block wise distribution of irrigated land in Nadia district, 2014 |
Irrigation in Nadia district relies on multiple sources, each playing a vital role in supporting agriculture. River Lift Irrigation is prominent in blocks like Hanskhali (35 units), Krishnaganj (31 units), as well as Tehatta I, Tehatta II, and Kaliganj, where river proximity enables this method effectively (Figure 3). The district’s major share of irrigated land, however, comes from deep tubewells, with Krishnanagar-I having the highest irrigated area under this method (1880 ha), followed by Hanskhali, Santipur, Chakdaha, Ranaghat-I, and Ranaghat-II. In addition, the district is rich in traditional ponds—locally called tanks or bheris—which store monsoon rainwater and supply irrigation during dry periods, playing a critical role in water conservation and rural livelihoods.
From the figure 3, it is found that the extent of irrigated land varied significantly across the blocks of Nadia district. Blocks such as Krishnanagar-II (2300 ha), Nabadwip (2200 ha), and Ranaghat-I (2000 ha) recorded the highest irrigated areas, indicating strong irrigation infrastructure and better agricultural support systems. Mid-level irrigation was observed in blocks like Tehatta-I, Tehatta-II, Chakdaha, and Santipur, with irrigated areas ranging between 1300 to 1700 hectares. These areas may have moderately developed irrigation systems supporting agricultural activities. On the other hand, blocks like Kaliganj (500 ha), Karimpur-I (700 ha), and Haringhata (800 ha) (Figure 3) showed the lowest levels of irrigation. This suggests limited access to irrigation facilities in those regions, possibly relying more on rainfall or traditional water sources. Overall, the data reflects regional disparities in irrigation development across Nadia district, which could influence crop productivity and agricultural planning.
Horticulture and Agro-Processing
Horticulture has become a key element of agriculture in Nadia district, offering farmers various opportunities for growth and diversification. The cultivation of mango, guava, and litchi has gained momentum in recent years, driven by the region’s favourable agro-climatic conditions. These fruit crops have become increasingly important, as more farmers are adopting orchard cultivation because of the region’s suitable environmental conditions.28 The growth of horticulture has expanded agricultural diversity and created additional income opportunities for farmers, which has helped improve their economic condition.29
Agro-processing offers substantial potential to further enhance the economic benefits derived from horticultural produce in Nadia. Processing fruits like mangoes, guavas, and litchis into products such as fruit pulp, purees, concentrates, and fruit-based snacks can increase their market value.30 This value addition creates new opportunities for income generation, employment, and market competitiveness. Packaging and branding are crucial elements in promoting these processed products, helping to expand their market reach and ensuring the continued growth of the district’s horticultural economy.31 The development of agro-processing industries can play a significant role in stimulating rural economic growth and providing sustainable livelihoods for the local population.
The agricultural performance of different blocks in Nadia District, West Bengal, is evaluated using eight key indicators; Net Sown Area (NSA), Fertilizer Consumption (FC), Irrigated Area (IA), Cropping Intensity (CI), Tubewell Usage (TU), Groundwater Utilization (GU), Pesticide and Pest Management (PP), and Farmer’s Income (FI). These indicators are selected because they collectively represent the major components that influence agricultural development. Net sown area and irrigated area reflect land availability and water accessibility for cultivation. Cropping intensity shows the efficiency of land use, while fertilizer consumption, pesticide use, and groundwater utilization represent the level of agricultural inputs and modern practices. Tubewell usage indicates irrigation technology advancement, and farmer’s income reflects the economic outcome of agricultural activities. Together, these parameters provide a comprehensive and reliable assessment of agricultural performance across blocks. (Appendix 1). A positive Z-Score signifies above-average performance, while a negative Z-Score indicates below-average performance compared to the district average. Among the best-performing blocks, it is said that Nabadwip stands out with the highest Composite Z-Score (1.299), excelling in Net Sown Area (1.578), Irrigation Intensity (1.642), and Total Production (1.340), indicating strong agricultural activity and resource availability. Krishnaganj (1.235) follows closely, with high Irrigation Intensity (1.321), Cropping Intensity (1.577), and Growth Trend (1.503) Appendix 1, suggesting efficient land use and significant improvements in agricultural output. Ranaghat-I (0.948) also demonstrates consistent performance with high Farm Infrastructure (0.950) and Cropping Intensity (1.233), signifying better farming facilities and sustainable agricultural practices.
On the other hand, several blocks struggle significantly in agricultural performance. Karimpur-I (-1.897) (Appendix 1) records the lowest Composite Z-Score, with notably poor scores in Net Sown Area (-1.882), Total Production (-2.186), and Growth Trend (-2.428), highlighting severe agricultural limitations. Chapra (-1.302) also ranks low, facing challenges in Net Sown Area (-0.981), Total Production (-1.615), and Farm Infrastructure (-1.203), suggesting poor land utilization and inadequate farming facilities. Tehatta-I (-0.597), while not as low as Karimpur-I and Chapra, shows weaknesses in Cropping Intensity (-1.259) and Farm Infrastructure (-1.398), indicating issues in sustaining agricultural cycles. Kaliganj (-0.525) and Haringhata (-0.367) also exhibit below-average scores in critical parameters like Cropping Intensity and Growth Trend, suggesting a need for improved irrigation and infrastructure support. The disparities in Z-Scores across the blocks emphasize the need for targeted policy interventions, such as enhanced irrigation facilities, improved farm infrastructure, and better resource management, to boost agricultural productivity in underperforming areas. Figure 4 shows the level of agricultural development of different blocks of Nadia district of West Bengal.
Agricultural Productivity
Agricultural productivity in Nadia District was assessed using M. Shafi’s formula, which evaluates the output of agricultural production in relation to the inputs used, such as land, labor, and capital. This formula takes into account the total yield of crops per unit of input, providing an efficient measure of how effectively the agricultural resources are being utilized. By calculating productivity, it helps in understanding the efficiency of farming practices, the impact of technological advancements, and the overall performance of the agricultural sector in the district. High agricultural productivity indicates successful resource utilization and potentially higher farmer incomes, while lower productivity could suggest the need for improvements in farming techniques, infrastructure, or input use.
Table 1: Block wise analysis of the crop productivity and crop Diversification, 2014
| Sl. No. | Blocks | Crop Productivity Index (M. Shafi) | Herfindahl Index (HI) | Simpson Index (SI) |
| 1 | Karimpur-I | 0.018 | 0.242 | 0.758 |
| 2 | Karimpur-II | 0.063 | 0.247 | 0.753 |
| 3 | Tehatta-I | 0.039 | 0.149 | 0.851 |
| 4 | Tehatta-II | 0.054 | 0.161 | 0.839 |
| 5 | Kaliganj | 0.040 | 0.139 | 0.861 |
| 6 | Nakashipara | 0.037 | 0.192 | 0.808 |
| 7 | Chapra | 0.023 | 0.203 | 0.797 |
| 8 | Krishnaganj | 0.166 | 0.164 | 0.836 |
| 9 | Krishnanagar-I | 0.033 | 0.207 | 0.793 |
| 10 | Krishnanagar-II | 0.068 | 0.128 | 0.872 |
| 11 | Nabadwip | 0.108 | 0.159 | 0.841 |
| 12 | Santipur | 0.052 | 0.213 | 0.787 |
| 13 | Hanskhali | 0.055 | 0.167 | 0.833 |
| 14 | Ranaghat-I | 0.093 | 0.184 | 0.816 |
| 15 | Ranaghat-II | 0.049 | 0.162 | 0.838 |
| 16 | Chakdaha | 0.062 | 0.348 | 0.652 |
| 17 | Haringhata | 0.041 | 0.376 | 0.624 |
With the help of M. Shafi’s index value, the blocks of Nadia was categorized into three distinct zones based on their agricultural development:
High Developed Area: According to Table 1, Krishnaganj (0.166) block stands out as the most agriculturally developed area in the region. This area benefits from fertile soil, adequate irrigation facilities, and advanced farming techniques, leading to high crop yields and diverse agricultural practices. Other blocks that fall under this category of high development include Nabadwip, Ranaghat-I, Krishnanagar-II, Karimpur-II, and Chakdaha, all of which demonstrate significant agricultural prosperity.
Moderate Developed Area: The blocks of Hanskhali (0.055), Santipur, Tehatta-II, Tehatta-I, Kaliganj, Ranaghat-II, and Haringhata are moderately developed. These areas have made progress in agriculture, industry, infrastructure, and public services but still face some challenges. While these blocks have good farmland, they often lack advanced irrigation facilities and modern farming techniques, which limit their full agricultural potential.
Low Developed Area: Karimpur-I (0.018), Chapra, and Krishnanagar-I, as indicated in Table 1, are considered low-developed blocks in Nadia district. These areas face several economic and infrastructural challenges. While the blocks still have a largely agrarian economy, agricultural productivity is low due to limited access to modern farming techniques, insufficient irrigation, and small landholdings, hindering overall agricultural growth (Figure 5).
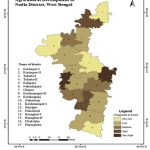 |
Figure 4: Levels of agricultural development, 2014 |
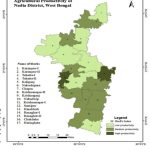 |
Figure 5: Agricultural productivity, 2014 |
Crop Diversification
Crop diversification in Nadia District is important for improving agricultural sustainability and maintaining food security. Growing different types of crops instead of depending on a single crop helps farmers reduce risks related to market price changes, pests, diseases, and climate variations. Diversification also supports better soil health, as different crops use and restore nutrients in different ways. In Nadia, crop diversification is encouraged to increase farmers’ income, raise productivity, and create a more balanced farming system. The district’s varied climate and soil conditions make it suitable for cultivating cereals, pulses, fruits, and vegetables, which strengthens a more resilient and profitable agricultural structure. The crop diversification indices of Nadia district, West Bengal, are calculated using data from 2014. The Herfindahl Index (HI) and Simpson Index (SI) are applied to measure the extent of crop diversification. The indices are based on the proportion of the total cropped area under different crops. A higher Herfindahl Index (HI) value indicates low diversification, while a lower value signifies higher diversification.
Table 1 show that the blocks of Krishnanagar-II (0.128), Kaliganj (0.139), and Tehatta-I (0.149) show higher crop diversification. In contrast, Haringhata (0.376) and Chakdaha (0.348) have the lowest crop diversification. Other blocks, such as Krishnaganj, Tehatta-II, Nabadwip, Hanskhali, and Ranaghat-I & II, fall into the medium crop-diversified category. The Simpson Index (SI), which measures horizontal diversification, varies between 0 and 1. A value of ‘zero’ indicates complete specialization, while a value of ‘one’ signifies complete diversification. Haringhata is the least diversified block, with the lowest SI value (0.624), whereas Krishnanagar-II is the most diversified, with the highest SI value (0.872).
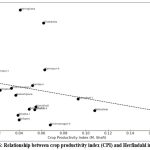 |
Figure 6: Relationship between crop productivity index (CPI) and Herfindahl index (HI) |
The scatter plot shows a negative relationship between Crop Productivity Index (CPI) and Herfindahl Index (HI). As Crop Productivity Index increases, the Herfindahl index tends to decrease. This is confirmed by the downward sloping regression line. Higher CPI implies better crop productivity in a block. Lower HI means greater crop diversification because HI measures concentration, lower HI means more diversified crops. Blocks with higher crop productivity tend to have more diversified cropping patterns. Krishnaganj has the highest CPI (0.166) and a relatively low HI (0.165). Haringhata and Chakdaha show higher HI values (0.37-0.38) despite modest CPI. Most blocks cluster in the mid-zone (CPI: 0.03-0.07; HI: 0.15-0.22), showing, balanced crop productivity and moderate levels of diversification (Santipur, Ranaghat-1).
Agricultural Efficiency
Table 2: The degree of agricultural efficiency in Nadia district, 2014
| Efficiency Level | Kendall Range | Blocks | Characteristics |
| High | 4.00 – 7.50 | Krishnaganj , Nabadwip, Ranaghat-I, Krishnanagar-II, Karimpur-II, and Chakdaha | Best-performing in both efficiency and productivity |
| Medium | 7.51 – 9.00 | Hanskhali, Santipur, Tehatta-II, Tehatta-I, Kaliganj, Ranaghat-II, and Haringhata | Moderate performers, potential to improve |
| Low | >9.00 | Karimpur-I, Chapra, and Krishnanagar-I | Inefficient, need targeted interventions |
It is known that a higher the ranking coefficient value indicates lower agricultural efficiency. Based on the data provided (Appendix 2), The efficiency analysis of agricultural performance across the blocks of Nadia District shows clear spatial variations, which are grouped into three categories: high, medium, and low efficiency levels based on Kendall’s coefficient values. Blocks with high efficiency (range 4.00-7.50), including Krishnaganj, Nabadwip, Ranaghat-I, Krishnanagar-II, Karimpur-II, and Chakdaha, demonstrate strong performance in both agricultural efficiency and productivity, indicating better resource utilization and improved management practices. The medium efficiency category (7.51-9.00), which includes Hanskhali, Santipur, Tehatta-II, Tehatta-I, Kaliganj, Ranaghat-II, and Haringhata, reflects average performance with scope for improvement through better input use, irrigation expansion, and technological support. Finally, the low efficiency group (above 9.00), comprising Karimpur-I, Chapra, and Krishnanagar-I, represents the weakest agricultural performance, highlighting the need for targeted interventions such as improved irrigation facilities, modern farming techniques, and financial support to raise productivity. This spatial pattern indicates uneven development within the district, requiring location-specific planning and resource allocation.
Impact of Agricultural Development
Agricultural development in Nadia district has been integral to enhancing rural livelihoods, income generation, and poverty reduction. Improvements in agricultural productivity and better access to markets have directly increased farmers’ incomes.32 The use of modern farming methods and stronger market connections, including agro-processing activities, has created more earning opportunities for local farmers. Agriculture continues to be the main source of livelihood for a large share of the rural population, with both farmers and agricultural labourers relying on farming activities for their sustenance.33 Agricultural development also plays a key role in poverty reduction, providing opportunities for higher incomes and improved living standards for many in the region. Agricultural growth in Nadia district has had significant social impacts, particularly for women. Women play a crucial role in agricultural activities, including crop cultivation, animal husbandry, and horticulture, enabling them to contribute to household income and decision-making processes.34 The increased agricultural productivity also ensures food security, with higher crop yields and diversification, which helps reduce malnutrition and improves overall health.35 Additionally, agricultural development often leads to enhanced rural infrastructure, such as improved roads, irrigation systems, and storage facilities, contributing to broader economic development in the region.36
Challenges and Opportunities
Agriculture in Nadia District faces several challenges that impact its productivity and sustainability. Climate change has emerged as a significant threat, leading to erratic weather patterns, temperature fluctuations, and altered monsoon cycles. Unseasonal rainfall, prolonged droughts, and frequent flooding disrupt crop growth and reduce yields, affecting the livelihoods of farmers. Reports from the Indian Meteorological Department (IMD)37 and the Indian Council of Agricultural Research (ICAR)38 indicate that nearly 40% of farmers in Eastern India, including Nadia, experience crop losses due to climate variability. Water scarcity (Figure 6) is another major concern, as excessive groundwater extraction has led to declining water tables in certain regions. According to the West Bengal Water Resources Department, groundwater levels in some parts of Nadia have dropped by 10-15 meters over the last two decades, further exacerbating irrigation challenges.39 Soil degradation (Figure 6) due to erosion, salinity intrusion, and the overuse of chemical fertilizers also contributes to declining agricultural productivity, as highlighted by NABARD.40
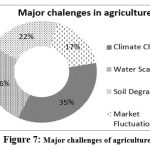 |
Figure 7: Major challenges of agriculture |
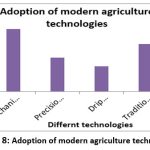 |
Figure 8: Adoption of modern agriculture technologies |
Another significant issue is the reliance on traditional farming methods. Many small and marginal farmers continue to use outdated agricultural practices with limited mechanization, inefficient irrigation systems, and excessive reliance on chemical inputs. The Agricultural Census of West Bengal shows that only about 37% of farmers in Nadia use mechanized farming tools, which is much lower than the national average of 55%. Limited access to markets and frequent price changes also increases economic uncertainty for farmers.41 Rapid shifts in demand and supply affect crop prices, and poor storage and transportation facilities cause large post-harvest losses. According to the West Bengal State Agriculture Marketing Board, these challenges continue to affect farmers’ income and overall agricultural growth in the district and the Food and Agriculture Organization, nearly 20% of perishable produce in Nadia is wasted due to the lack of proper storage and supply chain facilities. Despite these challenges, the district has significant opportunities for agricultural development.42,43 The adoption of climate-resilient farming techniques, such as drought-tolerant crop varieties and improved irrigation methods like drip irrigation (Figure 7) can help mitigate climate-related risks. Studies from ICAR suggest that newly developed hybrid rice varieties could improve yields by 15-20% under water-stressed conditions.44 Advancements in sustainable water management, including the implementation of drip and sprinkler irrigation systems, can optimize water usage and alleviate water scarcity issues, as reported by the Central Ground Water Board.45 Organic farming and agroforestry practices can improve soil fertility and reduce the environmental impact of chemical-intensive farming, with data from the National Horticulture Board indicating that organic farms in West Bengal have shown 30% higher soil fertility compared to conventional farms.46 Technological innovations in precision agriculture (Figure 7), including the use of drones, satellite imagery, and IoT-based sensors, offer new ways to monitor crop health, optimize fertilizer application, and detect pest infestations early. According to the Department of Agriculture, Government of India, the adoption of digital and precision farming techniques can increase crop yields by up to 25% while reducing input costs.47 Capacity-building initiatives and agricultural training programs are crucial for empowering farmers with the knowledge and skills required to adopt modern agricultural practices. NABARD has implemented farmer training programs across West Bengal, leading to a 17% increase in productivity among participating farmers.48 Additionally, investments in research and development for breeding climate-smart crop varieties can enhance resilience against pests, diseases, and changing weather conditions. The Indian Institute of Crop Research has introduced high-yielding, pest-resistant paddy varieties specifically suited for West Bengal, which have demonstrated a 12% increase in output under adverse climatic conditions.49
Discussion
Agricultural development in Nadia District shows big differences between blocks, even though the district has fertile soil and a good tropical monsoon climate. While natural conditions are favourable, the availability of resources, infrastructure, and farming technology greatly affect how well agriculture performs. Blocks like Krishnaganj, Nabadwip, and Ranaghat-I do well because they have better irrigation, more intensive cropping, and stronger farm facilities. On the other hand, blocks such as Karimpur-I, Chapra, and Tehatta-I perform poorly due to limited water, lack of modern tools, and weak infrastructure. This shows that fair distribution of resources is important for balanced agricultural growth.
Irrigation is very important for improving crop productivity and making farming more resilient. Blocks with multiple water sources – like river lift, deep tubewells, and ponds – have higher cropping intensity and better efficiency. Blocks with low irrigation are more affected by rainfall changes and falling groundwater levels. This highlights the need for proper water management, including micro-irrigation, rainwater harvesting, and regulated groundwater use, to make agriculture more sustainable.
Crop diversification is another key factor for sustainable and resilient farming. Blocks with higher productivity, such as Krishnanagar-II, Kaliganj, and Tehatta-I, grow a variety of crops, which reduces dependence on a few major crops and lowers risks from climate changes and market fluctuations. Blocks like Haringhata and Chakdaha are less diversified and more vulnerable. Horticulture, especially mango, guava, and litchi farming, along with agro-processing, is creating extra income and jobs, but better storage, transport, and marketing facilities are needed to fully benefit from it.
The efficiency of farming also varies across blocks. High-efficiency blocks manage land, water, and other inputs well, leading to higher productivity and income. Low-efficiency blocks need special attention through improved irrigation, adoption of modern technology, and farmer training. These differences show that policies should focus on the specific needs of each area to improve agricultural performance.
Overall, agriculture in Nadia supports rural livelihoods, increases farmer income, ensures food security, and improves infrastructure and women’s participation in farming. However, problems like climate changes, soil degradation, and market instability remain. Using climate-resilient farming, precision irrigation, organic farming, digital tools, and training programs can strengthen agriculture, ensuring sustainable and inclusive growth across all blocks.
Conclusion
This study highlights the agricultural development of Nadia district, West Bengal, emphasizing its geographical importance, rich agro-ecological conditions, and substantial contribution to the state’s agrarian economy. The findings underscore the district’s critical role in transforming rural livelihoods through income generation and poverty reduction. Nadia’s fertile alluvial soils, abundant water from the Ganges and its distributaries, and favorable climatic conditions provide an ideal environment for agriculture. The district’s traditional reliance on paddy and jute cultivation, along with the growing emphasis on horticultural crops, forms the core of its agricultural profile. Agricultural development in Nadia is vital for enhancing the socio-economic well-being of its population. The district holds significant potential for sustainable agricultural growth, particularly through improved market linkages, value addition, and climate-resilient practices. Realizing this potential will require targeted investments in research, technological innovation, and capacity building. By leveraging its natural advantages and addressing existing challenges, Nadia district is well-positioned to emerge as a model for prosperous and sustainable agriculture in West Bengal. In summary, agriculture in Nadia district presents both opportunities and challenges. The district’s fertile alluvial plains and favourable climate offer a strong base for agricultural prosperity, but uneven infrastructural development, water scarcity, and traditional farming practices constrain uniform progress. Addressing these gaps through integrated water management, technological innovation, and farmer-oriented capacity building will be crucial for achieving sustainable and equitable agricultural growth across all blocks of the district.
Acknowledgement:
The author(s) express sincere gratitude to Aliah University, Kolkata, for providing the necessary institutional support and encouragement to carry out this research. Special thanks are due to the Department of Geography, Aliah University, for their continuous guidance, academic support, and access to resources that greatly contributed to the successful completion of this work.
Funding Sources
The author(s) received no financial support for the research, authorship, and/or publication of this article.
Conflict of Interest
The authors do not have any conflict of interest.
Data availability
Data can be accessed upon request.
Ethics Statement
This research did not involve human participants, animal subjects, or any material that requires ethical approval.
Informed Consent Statement
This study did not involve human participants, and therefore, informed consent was not required.
Permission to reproduce material from other sources:
Not Applicable
Author Contributions:
Rukhsana: Writing – review and original draft preparation, editing, supervision, methodology, investigation, conceptualization.
Sohel Rana Sk: Writing and analysis, tabulation, mapping, visualization, methodology, data curation.
References
- NSO. National Statistical Office Report: Gross Value Added (GVA) in Agriculture and Allied Sectors, 2020–2021. Government of India; 2021.
- Arndt HW. Economic Development: The History of an Idea. University of Chicago Press; 1987.
CrossRef - Barrett CB, Christiaensen L, Sheahan M. Agricultural development and structural transformation: Revisiting the Lewis model. Food Policy. 2010;45(2):134-150.
- Chowdhury S. Agrarian economy and rural livelihoods in Nadia District, West Bengal. J Rural Stud. 2019;12(3):45-56.
- Das A, Ghosh P, Mandal R. Agro-ecological characteristics of Nadia District, West Bengal. Indian J Geogr Environ. 2020;45(1):78-92.
- Ghosh P. Agricultural diversification and productivity trends in Nadia District, West Bengal. Economic Affairs. 2018;63(2):341-349.
CrossRef - Chatterjee D, Dasgupta S, Sarkar B. Patterns of crop diversity and agricultural productivity in Nadia District. Geogr Rev India. 2019;81(1):23-39.
- Mukherjee R, Bhattacharya K. Crop diversification and rural development in West Bengal: A block-level analysis. Indian J Reg Sci. 2017;49(2):59-72.
- Biswas A, Mandal A, Ghosh S. Jute cultivation and its socio-economic impact in Nadia District, West Bengal. Int J Soc Econ Res. 2017;7(3):182-196.
- Roy A, Das D. Rice and jute cultivation patterns in Nadia District: An economic geography perspective. Geography and You. 2019;19(12):25-31.
- Mukherjee S, Datta R. Changing agricultural practices and rural transformation in Nadia District, West Bengal. J Agric Dev. 2021;16(1):44-60.
- Organisation for Economic Co-operation and Development (OECD). Measuring Productivity: Measurement of Aggregate and Industry-level Productivity Growth. OECD Manual; 2001.
- Mogili UR, Deepak BBVL. Smart agriculture: An approach towards better agricultural productivity. Proceedings of the International Conference on IoT in Social, Mobile, Analytics and Cloud (I-SMAC). 2018:9-14.
- Singh R. Agricultural efficiency and productivity in India: A regional analysis. J Rural Dev. 2006;25(3):351-367.
- Banerjee A, Sen P. Impact of government agricultural schemes on farmer livelihoods in West Bengal. Indian J Agric Econ. 2016;71(4):489-503.
- Bureau of Applied Economics and Statistics. District Statistical Handbook: Nadia. Government of West Bengal; 2014.
- Department of Agriculture, Government of West Bengal. Annual Report on Crop Production and Irrigation. 2018.
- Agriculture Department, Government of West Bengal. District-wise Agricultural Statistics and Schemes Implementation Report. 2019.
- Shafi M. Measurement of agricultural productivity in Uttar Pradesh. The Geographer. 1972;19(2):21-35.
- Kendall MG. The geographical distribution of crop productivity in England. J Agric Sci. 1939;29(4):681-689.
CrossRef - Shafi M. Agricultural efficiency in Uttar Pradesh. Geogr Rev India. 1960;22(1):48-54.
- Nadia District Agricultural Office. Annual Agricultural Report: Nadia District. Government of West Bengal; 2019.
- Government of West Bengal. West Bengal Agricultural Statistics Report. Department of Agriculture; 2018.
- Jute Corporation of India. Annual Report on Jute Production and Marketing in West Bengal. 2021.
- Indian Institute of Natural Fibres. Research and Development Report on Jute Cultivation. ICAR; 2023.
- Department of Agriculture, Government of West Bengal. Agricultural Support Programs and Subsidy Schemes in Nadia District. 2023.
- Krishi Vigyan Kendra, Nadia. Annual Report on Agricultural Extension Activities. 2023.
- Chatterjee S. Horticultural development and fruit crop cultivation in Nadia District. J Hortic Res. 2022;14(1):101-115.
- Das R. Trends in horticultural growth in West Bengal: A district-level study. Econ Dev Rev. 2020;18(3):88-102.
- Singh VK. Agro-processing and value addition in West Bengal’s horticultural sector. Indian J Agric Mark. 2021;35(1):57-73.
- Sharma R. Branding and packaging innovations in Indian agro-processing industries. Int J Rural Mark. 2019;7(2):112-125.
- Roy P. Agricultural development and income generation in West Bengal. Economic Affairs. 2017;62(3):443-455.
- Saha M. Rural livelihoods and agricultural dependence in Nadia District, West Bengal. J Dev Stud. 2018;10(2):33-47.
- Das S, Banerjee A. Women’s participation in agricultural development in West Bengal. Indian J Gender Stud. 2020;27(4):561-579.
- Mukherjee R. Agricultural productivity, food security, and nutrition linkages in rural Bengal. J Food Secur Stud. 2018;5(1):89-104.
- Sen D. Infrastructure development and rural transformation in Nadia District. J Rural Infrastruct. 2021;8(2):77-92.
- India Meteorological Department (IMD). Climate Variability and Agricultural Impacts in Eastern India. 2023.
- Indian Council of Agricultural Research (ICAR). Impact of Climate Change on Crop Productivity in Eastern India. 2021.
- West Bengal Water Resources Department. Groundwater Level and Irrigation Assessment Report. 2021.
- NABARD. Soil Degradation and Sustainable Farming Report. 2023.
- Agricultural Census, West Bengal. Farm Mechanization and Land Use Statistics. 2023.
- West Bengal State Agriculture Marketing Board. Post-Harvest Management and Market Infrastructure Report. 2023.
- FAO. Post-Harvest Losses and Food Security in Eastern India. 2023.
- ICAR. Hybrid Rice Development and Climate Resilience Report. 2019.
- Central Ground Water Board (CGWB). Annual Report on Water Management and Conservation in Eastern India. 2023.
- National Horticulture Board (NHB). Organic Farming and Soil Fertility Improvement Report. 2022.
- Department of Agriculture, Government of India. Precision Agriculture and Digital Farming Initiatives in India. 2023.
- NABARD. Farmer Capacity Building and Skill Development Programs in West Bengal. 2022.
- Indian Institute of Crop Research. High-Yielding and Pest-Resistant Paddy Varieties for West Bengal. 2021.
Appendix
Appendix 1: Block-wise Agricultural Development in Nadia, 2014
| Block | NSA | FC | IA | CI | TU | GU | PP | FI | Z-Score |
| Karimpur-I | -1.88 | -1.33 | -1.88 | -1.82 | -2.19 | -2.43 | -1.76 | -1.89 | -1.90 |
| Karimpur-II | 1.29 | 1.01 | 0.25 | 0.55 | 0.86 | 0.63 | 0.65 | 0.61 | 0.73 |
| Tehatta-I | -1.50 | -0.42 | 0.20 | -1.26 | 0.63 | -1.17 | 0.15 | -1.40 | -0.60 |
| Tehatta-II | 1.15 | 1.72 | -0.28 | -1.04 | 0.29 | -0.74 | 0.80 | -0.37 | 0.19 |
| Kaliganj | -0.93 | -0.87 | -0.65 | 0.37 | -0.28 | -0.30 | -1.31 | -0.22 | -0.53 |
| Nakashipara | 0.82 | 0.55 | -1.29 | -0.74 | -1.09 | 0.41 | 1.25 | 0.22 | 0.02 |
| Chapra | -0.98 | -1.64 | -1.40 | -1.52 | -1.62 | -1.01 | -1.06 | -1.20 | -1.30 |
| Krishnanagar-II | 0.30 | -0.26 | -0.17 | 0.89 | 1.05 | 0.58 | -0.71 | 0.31 | 0.25 |
| Krishnaganj | 0.54 | 0.86 | 1.32 | 1.58 | 1.15 | 1.50 | 1.60 | 1.34 | 1.24 |
| Nabadwip | 1.58 | 1.47 | 1.64 | 0.50 | 1.34 | 1.23 | 1.05 | 1.59 | 1.30 |
| Krishnanagar-I | 0.20 | 0.25 | -0.60 | 0.68 | -0.76 | -0.46 | -0.46 | -0.67 | -0.23 |
| Santipur | -0.65 | -1.13 | 1.22 | 0.12 | 0.34 | 0.74 | -0.16 | 1.10 | 0.20 |
| Hanskhali | 0.01 | -0.31 | 0.52 | 0.93 | 0.43 | 0.25 | 1.20 | 0.46 | 0.44 |
| Ranaghat-I | 0.96 | 1.06 | 0.95 | 1.23 | 0.82 | 1.12 | 0.50 | 0.95 | 0.95 |
| Ranaghat-II | -0.27 | 0.30 | -0.12 | 0.20 | -0.38 | -0.52 | -0.51 | -0.67 | -0.25 |
| Chakdaha | -0.03 | -0.67 | 0.74 | -0.53 | -0.42 | 0.25 | -1.01 | 0.56 | -0.14 |
| Haringhata | -0.60 | -0.57 | -0.44 | -0.14 | -0.18 | -0.08 | -0.21 | -0.71 | -0.37 |
Source: Calculation is based on data collected from the District Statistical Handbook of Nadia (2014), published by the Bureau of Applied Economics and Statistics, Government of West Bengal.
Note: NSA = Net Sown Area (%), FC = Fertilizer Consumption (kg/hectare), IA = Irrigated Area (%), CI = Cropping Intensity (%), TU = Tubewell Usage (%), GU = Groundwater Utilization, PP = Pesticide and Pest management, FI = Farmer’s Income in thousand rupees.
Appendix 2: Agricultural Efficiency Analysis in Nadia, 2014
| Block | Kendall’s Coefficient | Productivity Rank |
| Santipur | 8.25 | 8 |
| Karimpur-II | 7.62 | 6 |
| Tehatta-II | 8.87 | 10 |
| Krishnanagar-II | 6.87 | 4 |
| Nabadwip | 5.62 | 2 |
| Hanskhali | 7.87 | 7 |
| Haringhata | 11.25 | 14 |
| Karimpur-I | 12.00 | 15 |
| Tahatta-I, | 8.75 | 9 |
| Kaliganj | 9.12 | 11 |
| Haringhata | 10.25 | 13 |
| Ranaghat-II | 9.87 | 12 |
| Chapra | 12.25 | 17 |
| Chakdaha | 7.37 | 5 |
| Ranaghat-I | 6.50 | 3 |
| Krishnanagar-I | 9.12 | 16 |
| Krishnaganj | 4.75 | 1 |