
Introduction
Sesame (Sesamum indicum L.) is one the most ancient oilseed crop known to mankind, belongs to the family Pedaliaceae with chromosome number of 2n=26 and containing 16 genera with 60 species. The genus Sesamum consists of 36 species and Sesamum indicum L. is the most utilized species for seed and oil.1 Sesame is called as “Queen of Oilseed crop” due to its stability and quality of oil. The excellent quality of oil is due to the presence of high amount of unsaturated fatty acid content i.e., Linoleic acid (35-45%) and Oleic acid (35-42%), low amount of saturated fatty acid content i.e., Palmitic acid (10-12%) and Stearic acid (5-7%). The stability of the sesame oil is due to the presence of antioxidants lignans (sesamin, sesamolin and sesaminol). Sesame consists of rich source of oil (45-60%), protein (18-25%), carbohydrate (12-14%), minerals and polyunsaturated fatty acid due to thus benefits, sesame is considered as nutritious oilseed crop.2 The health benefits compounds viz., antioxidant, antiaging, antihypertensive, anticancer, cholesterol lowering and antimutagenic properties were present in the sesame.3 4The world sesame was cultivated under 14 million hectares area with production and productivity of about 7.2 million tons and 0.79 tons per hectare, respectively. In India, sesame was cultivated under 1.5 million hectares area, about 0.65 million tons of production and 0.43 tons per hectare productivity. In India, states cultivating sesame were Tamil Nadu, Telangana, Andhra Pradesh, West Bengal, Madhya Pradesh, Gujarat and Rajasthan. In worldwide, currently more than 50 countries were growing sesame and among them 30% was contributed by India. Despite of its quality and nutritional benefits, sesame was not preferred by many of the developed countries due to peculiar reasons viz., indeterminate growth habit, low harvest index, seed shattering effect and susceptible to diseases.5
In Tamil Nadu, more than 30 sesame varieties were released and notified for cultivation. Though most of the varieties were low yielding, indeterminate growth, seed shattering, susceptible to biotic and abiotic stress.6 Sesame breeding aims high yielding with resistance to biotic and abiotic stresses coupled with other traits would be preferred to achieve the goal. Thus, among the available germplasm or cultivar or advance breeding lines might be used as parents for hybridization programme to attain the desired outcome. Statistical analysis like variability, correlation, diversity and principal component analysis might be used to identify the variation and diversity among the genotypes. Thus, sesame breeding programme would be successful only when unraveling the true diversity and variability among the germplasms available. Further, based on the results the selection of parents would be effective for the crop improvement programme. Thus, the present study aims to reveal the diversity, association, variability and to identify the principal component responsible for the variation among set of 57 sesame germplasm for the selection of parents to involve in the hybridization programme.
Materials and Methods
The field experiment was conducted in Regional Research Station, Tamil Nadu Agricultural University, Vridhachalam, Tamil Nadu, India. A total of 57 Sesame germplasms were evaluated during Kharif 2022. The details of 57 sesame germplasm were presented in the Table 1. Each germplasm was grown as a separate row with the spacing of 30 x 10 cm and followed all the standard agronomic practices as per Tamil Nadu condition. Observation was recorded for eight traits viz., days to first flowering, days to 50% flowering, plant height (cm), number of branches per plant, number of capsules per plant, capsule length (cm), number of seeds per capsule and single plant yield (g). The obtained data was subjected to statistical analysis.
Table 1: Details of the sesame germplasm involved in the study
| S.No | Genotype | S. No | Genotype |
| 1 | AT 375 | 30 | EC 370541 |
| 2 | AT 377 | 31 | EC 370556 |
| 3 | DS 10 | 32 | EC 370727 |
| 4 | DS 28 | 33 | EC 370934 |
| 5 | DS 35 | 34 | EC 370992 |
| 6 | DS 45 | 35 | EC 542304 |
| 7 | DS 51 | 36 | GT 10 |
| 8 | DS 56 | 37 | IC 208652D |
| 9 | DS S4 | 38 | IS 1162- B |
| 10 | EC 334968 | 39 | JCS – DT-26 |
| 11 | EC 34615 | 40 | NPGR 10 |
| 12 | EC 346158 | 41 | NPGR 11 |
| 13 | EC 346244 | 42 | RMT 430 |
| 14 | EC 346313 | 43 | RMT 485 |
| 15 | EC 346319 | 44 | RMT 496 |
| 16 | EC 346357 | 45 | RMT 498 |
| 17 | EC 346362 | 46 | RMT 504 |
| 18 | EC 346392 | 47 | RMT 541 |
| 19 | EC 346414 | 48 | RMT 544 |
| 20 | EC 346481 | 49 | RMT 545 |
| 21 | EC 346569 | 50 | RMT 977 |
| 22 | EC 346678 | 51 | TBS 11 |
| 23 | EC 346867 | 52 | TBS 6 |
| 24 | EC 351554 | 53 | TKG 22 |
| 25 | EC 351852 | 54 | TMV 3 |
| 26 | EC 358036 | 55 | TMV 7 |
| 27 | EC 359017 | 56 | VRI (Sv) 2 |
| 28 | EC 361730 | 57 | VRI 3 |
| 29 | EC 370540 |
The observed data was subjected to statistical analysis like descriptive statistics including range, mean and standard deviation, cluster analysis, correlation analysis and principal component analysis (PCA). Grouping of sesame germplasm into various cluster was performed by using Tochers method as suggested.7 Simple correlation analysis was done as per the standard method suggested.8 The correlation among the traits was used to determine the magnitude of associations among the observed traits. Principal component analysis (PCA) was done as suggested.9 Principal component analysis (PCA) was used to find out the characters which accounted more to the total variance. The statistical analysis like cluster analysis and principal component analysis (PCA) were carried out in R statistical software. The simple correlation was performed using software PYTHON programming language.
Results
A successful breeding program relies mainly on the magnitude of variability present and investigating the extent of diversity is vital for its conservation and utilization in crop improvement program.10 The descriptive data of various yield related traits of 57 sesame germplasm were presented in Table 2.
Table 2: Descriptive statistics on sesame germplasm for yield and yield component traits.
| Sl. No. | Traits observed | Mean | Std Dev | Min | Max |
| 1 | Days to 1st flowering | 32.28 | 3.41 | 27.00 | 39.00 |
| 2 | Days to 50% flowering | 35.25 | 3.43 | 29.00 | 42.00 |
| 3 | Plant height (cm) | 102.38 | 18.61 | 67.00 | 132.80 |
| 4 | No. of branches / plant | 4.37 | 1.40 | 2.00 | 7.50 |
| 5 | No. of capsules / plant | 58.77 | 17.13 | 23.00 | 101.00 |
| 6 | Capsule length (cm) | 2.60 | 0.22 | 2.00 | 3.30 |
| 7 | No. of seeds / capsule | 64.16 | 7.25 | 34.00 | 95.00 |
| 8 | Single plant yield (g.) | 5.86 | 2.06 | 0.92 | 10.92 |
The trait days to first flowering ranged from 27 to 39 days with mean value of 32.23 days. The trait days to 50% flowering ranged from 29 to 42 days with mean value of 35.25 days. Plant height had ranged from 67 to 132.80 cm with mean value of 102.38 cm. The trait number of branches per plant ranged from 2 to 7.5 with the mean value of 4.37. Number of capsules per plant trait ranged from 23 to 101 with mean value of 58.77. The trait capsule length ranged from 2 to 3.30 cm with mean value of 2.60 cm. Number of seeds per capsule ranged from 34 to 95 with mean value of 64.16 and the trait single plant yield ranged from 0.92 to 10.92 g with mean value of 5.86 g. The cluster analysis was commonly used multivariant analysis to group the genotypes based on their similarities. In this study, 57 sesame germplasm were grouped into six clusters based on the Tochers method and presented in Table 3 and Fig 1.
Table 3: Clustering pattern among sesame germplasm for yield and yield component traits.
| Cluster number | Number of genotypes | Constituent genotypes |
| I | 35 | AT 375, TBS 11, TBS 6, DS 51, DS 10, DS 28, DS 54, DS 56, EC 542304, DS 35, EC 334968, EC 346319, DS 45, JCS – DT- 26, EC 346481, EC 370992, IC 208652D, EC 361730, EC 346678, RMT 504, RMT 496, EC 346158, TMV 3, EC 370541, TMV 7, VRI 3, EC 346392, EC 351852, VRI (Sv) 2. |
| II | 10 | AT 377, EC 370934, RMT 977, TKG 22, IS 1162-B, RMT 430, RMT 544, RMT 545, RMT 485, EC 34615, RMT 541, RMT 498, EC 346867, EC 370540, EC 346313, EC 346357. |
| III | 1 | NPGR 11 |
| IV | 9 | EC 370727, EC 346414, EC 370556, EC 346244, EC 351554, EC 346362, EC 358036, EC 346569, EC 359017. |
| V | 1 | GT 10 |
| VI | 1 | NPGR 10 |
Among the clusters, cluster I was the major one with 35 genotypes, followed by cluster II with 10 genotypes, cluster IV with 9 genotypes and cluster III, V and VI had one genotype in each cluster.
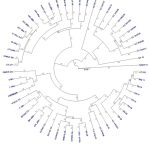 |
Figure 1: Cluster analysis on sesame germplasm |
Correlation analysis used to measure the genetic association between two or more traits and helps in indirect selection in plant breeding programme. The correlation estimate was presented in the Table 4.
Table 4: Correlation analysis on sesame germplasm for yield and yield component traits.
| Days to 50% flowering | Plant height (cm) | No. of branches / plant | No. of capsules / plant | Capsule length (cm) | No. of seeds / capsule | Single plant yield (g.) | |
| Days to 1st flowering | 0.92* | 0.50* | 0.39* | 0.10 | -0.37* | -0.06 | 0.32* |
| Days to 50% flowering | 0.49* | 0.28* | 0.02 | -0.34* | -0.09 | 0.32* | |
| Plant height (cm) | 0.60* | 0.55* | -0.29* | -0.23 | 0.09 | ||
| No. of branches / plant | 0.68* | -0.41* | -0.16 | 0.00 | |||
| No. of capsules / plant | -0.11 | -0.01 | 0.08 | ||||
| Capsule length (cm) | 0.51 | 0.10 | |||||
| No. of seeds / capsule | 0.16 |
*Significant at 5% probability.
The trait single plant yield had positive and significant correlation with days to first flowering (0.32) and days to 50% flowering (0.32). The trait capsule length had negative and significant correlation with days to first flowering (-0.37), days to 50% flowering (-0.34), plant height (-0.29) and number of branches per plant (-0.41). Trait number of capsules per plant recorded positive and significant correlation with plant height (0.55) and number of branches per plant (0.68). Number of branches per plant recorded positive and significant correlation with days to first flowering (0.39), days to 50% flowering (0.28) and plant height (0.60). The trait plant height had positive and significant correlation with days to first flowering (0.50) and days to 50% flowering (0.49).
Principal component analysis (PCA) is one of the multivariate method used to measure the contribution of each component to the total variance. The results of PCA were presented in Table 5.
Table 5: Principal component analysis on sesame germplasm for yield and yield component traits.
| S.No | Traits observed | PC1 | PC2 | PC3 | PC4 | PC5 | PC6 | PC7 | PC8 |
| 1 | Days to 1st flowering | 0.45 | -0.40 | -0.11 | 0.23 | -0.04 | 0.23 | 0.15 | -0.71 |
| 2 | Days to 50% flowering | 0.42 | -0.44 | -0.16 | 0.22 | 0.12 | 0.13 | 0.23 | 0.69 |
| 3 | Plant height (cm) | 0.45 | 0.12 | 0.17 | 0.07 | 0.56 | -0.57 | -0.32 | -0.07 |
| 4 | No. of branches / plant | 0.42 | 0.31 | 0.25 | 0.08 | -0.31 | 0.48 | -0.56 | 0.13 |
| 5 | No. of capsules / plant | 0.29 | 0.37 | 0.53 | -0.14 | -0.04 | 0.02 | 0.69 | 0.00 |
| 6 | Capsule length (cm) | -0.33 | -0.21 | 0.47 | 0.10 | 0.61 | 0.49 | -0.07 | -0.02 |
| 7 | No. of seeds / capsule | -0.18 | -0.34 | 0.55 | 0.49 | -0.42 | -0.37 | -0.08 | 0.04 |
| 8 | Single plant yield (g.) | 0.13 | -0.49 | 0.26 | -0.79 | -0.14 | -0.07 | -0.16 | 0.01 |
| Eigen Values | 3.19 | 1.60 | 1.39 | 0.71 | 0.54 | 0.27 | 0.21 | 0.07 | |
| Proportion of Variance | 0.40 | 0.20 | 0.17 | 0.09 | 0.07 | 0.03 | 0.03 | 0.01 | |
| Cumulative Proportion | 0.40 | 0.60 | 0.77 | 0.86 | 0.93 | 0.96 | 0.99 | 1.00 | |
The principal component analysis (PCA) showed that PC1, PC2 and PC3 accounted for 77% of the cumulative proportion of variation. The eigen values of the principal components PC1, PC2 and PC3 were found to be greater than one and presented in the Scree plot (Fig. 2). In PC1, the traits viz., days to first flowering (0.45), days to 50% flowering (0.42), plant height (0.45) and number of branches per plant (0.42) were positively contributed for 40% of variation. The trait number of capsules per plant (0.37) had positive contribution in PC2 with 20% of variation. In PC3, the traits viz., capsule length (0.47) and number of seeds per capsule (0.55) were positive contribution with 17% of variation.
Discussion
Multivariate analysis using 57 sesame germplasm revealed that grouping of genotypes into various clusters, relationship of association among various yield attributing traits and major contributing traits for the total variance. The descriptive statistics indicates the presence of greater range among the traits indicates the presence of diverse genotypes in the sesame germplasm. Cluster analysis showed that 57 sesame germplasm was grouped into 6 clusters. Among the 6 clusters, cluster I, II and IV were the major cluster consisting of 35, 10 and 9 germplasm in each cluster, respectively. The other clusters, cluster III, V and VI are solitary (Fig. 1). Similar pattern of clustering was reported.1,5,6
Correlation analysis revealed that the trait single plant yield had positive associated with days to first flowering and days to 50% flowering. Similar results were reported.1,2,11 11reported negative correlation for single plant yield with days to 50% flowering. All other traits had no significant correlation with single plant yield. The trait capsule length had negative association with days to first flowering, days to 50% flowering, plant height and number of branches per plant. Similar results were reported by9 and trait capsule length with positive correlation with plant height and number of branches per plant was reported.10-12 The trait number of capsules per plant had recorded positive correlation with plant height and number of branches per plant. Similar results were reported.1,12-14 Trait number of branches per plant had positive association with days to first flowering, days to 50% flowering and plant height. The trait plant height recorded significant association with days to first flowering and days to 50% flowering. Similar results were reported.1,2,12 The trait days to first flowering had positive correlation with days to 50% flowering.
Principal component analysis (PCA) is one of the multivariate statistical tools for investigating the factors majorly contributing to the total variation. The principal component analysis (PCA) revealed that three principal component PC1, PC2 and PC3 have accounted for 77% of total variation. The eigen value of all the three principal components had greater than one. The principal component traits in PC1 viz., days to first flowering, days to 50% flowering, plant height and number of branches per plant and contributed 40% of variation. The principal components traits in PC2 number of capsules per plant had major contribution of 20% of variation. The traits viz., capsule length and number of seeds per capsule had contributed of about 17% of variation. Similar results were reported.5,13,15,16 Hence, importance has to be given to those traits which has more contribution towards variation while framing the crop improvement programme. Further, the identified diverse set of germplasm can be utilized in hybridization breeding program to obtain desirable traits and to develop high yielding genotypes.
Conclusion
Though high yielding sesame varieties were not much popular, because yield is a complex trait controlled by polygenic in nature. The results from multivariate analysis revealed that the trait number of capsules per plant, capsule length and number of seeds per capsule must be included in the selection criteria for the improvement of yield. The selection of heterotic parent was also one of the important objectives for hybridization breeding in sesame.
Acknowledgement
The authors would like to thank the Tamil Nadu Agricultural University for the support and execution of experiment.
Funding Sources
The authors would like to thank the ICAR – AICRP on Sesame, PC Unit, JNKVV, Jabalpur for providing essential financial support.
Conflict of Interest
The authors do not have any conflict of interest.
Data Availability Statement
This statement does not apply to this article
Ethics Statement
This research did not involve human participants, animal subjects, or any material that requires ethical approval
Informed Consent Statement
This study did not involve human participants, and therefore, informed consent was not required.
Permission to reproduce material from other sources
Not applicable
Author Contributions
Mahalingam Angamuthu and Raghul Subramaniyan: Experiment, analysis, writing, and original draft preparation.
Mahalingam Angamuthu, Raghul Subramaniyan and Thalapathiraja Tamilmathi: conceptualization, resources, validation and supervision.
Mahalingam Angamuthu and Kasirajan Subrahmaniyan: Reviewing, and editing.
References
- Hika, Gadisa, NegashGeleta, and ZerihunJaleta. “Correlation and divergence analysis for phenotypic traits in sesame (Sesamum indicum L.) genotypes.” Science, Technology and Arts Research Journal. 2015; 3 (4): 1-9.
CrossRef - Iqbal, Adil, Rumana Akhtar, Tamina Begum, and Tapash Dasgupta. “Genetic estimates and diversity study in Sesame (Sesamum indicum L.).” IOSR Journal of Agriculture and Veterinary Science. 2016; 9 (8): 1-5.
CrossRef - Pavani, K., M. Lal Ahamed, J. V. Ramana, and A. B. M. Sirisha. “Studies on genetic variability parameters in sesame (Sesamum indicum L.).” International Journal of Chemical Studies. 2020; 8 (4): 101-104.
CrossRef - FAOSTAT. 2020. “The Food and Agriculture Organization Corporate Statistical Database (FAOSTAT), Rome, Italy.” http://www.fao.org/faostat.
- Abate, M., and F. W. Mekbib. “Study on genetic divergence in low-altitude sesame (Sesamum indicum L.) germplasm of Ethiopia based on agro morphological traits.” Journal of Advanced Studies in Agricultural, Biological and Environmental Sciences. 2015; 2(3): 78-90.
- Durge, BhagyashreeDevrao, S. Geethanjali, and R. Sasikala. “Assessment of genetic variability for seed yield and its components in sesame (Sesamum indicum L.) based on multivariate analysis.” Electronic Journal of Plant Breeding. 2022; 13 (3): 974-982.
CrossRef - Rao CR. Advanced statistical methods in biometric research. A Division of Macmillan Publishing Co, Inc New York; Collier-Macmillan Publishers; London; 1952.
- Karl Pearson. Contributions to the mathematical theory of evolution III. Regression, heredity and Panmixia. Proceedings of the Royal Society of London. 1896; 59: 69- 71.
CrossRef - Upadhyaya, Hari D., Rodomiro Ortiz, Paula J. Bramel, and Sube Singh. “Phenotypic diversity for morphological and agronomic characteristics in chickpea core collection.” Euphytica. 2002: 123 (3): 333-342.
CrossRef - Yogranjan, Gyanesh K. Satpute, Ajay Kumar Srivastava, and P. Sudhakar. “Characterization of genetic diversity for remodeling of elite accessions of sesame (Sesamum indicum L.).” International Journal of Chemical Studies. 2020; 8(2): 133-140.
CrossRef - Kumar, Vivek, Sima Sinha, Sweta Sinha, Ravi Shankar Singh, and S. N. Singh. “Assessment of genetic variability, correlation and path analysis in sesame (Sesamum indicum L.).” Electronic journal of plant breeding. 2022; 13 (1): 208-215.
CrossRef - Patil, M. K., and R. Lokesha. “Estimation of genetic variability, heritability, genetic advance, correlations and path analysis in advanced mutant breeding lines of sesame (Sesamum indicum L.).” Journal of Pharmacognosy & Natural Products. 2018; 4: 1-5.
CrossRef - Aristya, Vina Eka, TaryonoTaryono, and Rani Agustina Wulandari. “Genetic variability, standardized multiple linear regression and principal component analysis to determine some important sesame yield components.” AGRIVITA, Journal of Agricultural Science. 2016; 39 (1): 83-90.
CrossRef - Disowja, A., C. Parameswari, R. P. Gnanamalar, and S. Vellaikumar. “Evaluation of sesame (Sesamum indicum L.) based on correlation and path analysis.” Electronic Journal of Plant Breeding. 2020; 11 (2): 511-514.
CrossRef - Sirisha, A. B. M., SK Haseena Banu, and R. Saritha. “Genetic Divergence Studies using Mahalanobis D Square Analysis in Sesame (Sesamum indicum L.) Germplasm.” International Journal of Current Microbiology Applied Science. 2020; 9 (8): 2224-2229.
CrossRef - Teklu, DesawiHdru, Hussein Shimelis, Abush Tesfaye, Jacob Mashilo, Xiurong Zhang, Yanxin Zhang, KomiviDossa, and Admire Isaac TichafaShayanowako. “Genetic variability and population structure of Ethiopian Sesame (Sesamum indicum L.) germplasm assessed through phenotypic traits and simple sequence repeats markers.” Plants. 2021; 10 (6): 1129.
CrossRef