


 PDF Downloads:
94
PDF Downloads:
94


Introduction
Agriculture is the cornerstone of Tamil Nadu’s socioeconomic fabric. The state accounts for approximately 7 to 8 per cent of India’s total agricultural production and supports the livelihoods of nearly 2.6 crore farming households, with its agricultural sector employing around 45 per cent of the state workforce. Agricultural Gross State Value Added (GSVA) in Tamil Nadu increased to ₹2.78 lakh crore (approximately USD 334 billion) in 2022-23, contributing around 10 to 11 per cent to the state’s overall Gross State Domestic Product.1 Against this backdrop, increasing rainfall variability and temperature fluctuations have emerged as critical challenges for Tamil Nadu’s agricultural economy, influencing not only crop productivity but also long-term cropping patterns across irrigated and rain-fed regions.2,3 For millions of farming households in the state, an erratic monsoon is not merely a climatic event; it directly affects harvest outcomes, farm income, and seasonal cultivation decisions.4 The growing instability in rainfall distribution and seasonal temperature conditions has intensified production uncertainty, particularly in rain-fed agriculture, while simultaneously contributing to structural shifts in crop cultivation across Tamil Nadu.5
Three structural features make Tamil Nadu especially sensitive to climate variability. First, nearly 60 per cent of the cultivated area remains rain-fed, leaving agricultural production highly dependent on monsoon performance and increasing vulnerability to climatic shocks.5,4 Second, more than 60 per cent of the state’s annual rainfall arrives during the North-East Monsoon between October and December, a system strongly influenced by ENSO dynamics and associated with high inter-annual variability.6,7 Third, Tamil Nadu’s 1,076 km coastline exposes delta districts to storm surges, flooding, and saline intrusion that compound the effects of uneven rainfall.2 Together, these vulnerabilities mean that when the monsoon underperforms, the consequences ripple quickly across food security, rural income, and the state’s broader economic performance.
The IPCC Sixth Assessment Report highlights that tropical monsoon regions are likely to experience increasing climate variability including more intense dry spells and extreme precipitation events rather than only gradual warming.2,20 In the South Asian context, this has translated into growing uncertainty in seasonal rainfall distribution, agricultural planning, and crop productivity.8,3 Yet most existing research on the relationship between climate and agriculture in India either focuses on long-run warming trends or examines a single crop or district. No prior study has simultaneously analysed structural divergence across multiple crops, the correlation between climate variables and rice production, and the differential impact on irrigated versus rainfed systems within a single empirical framework using data through 2023. This study aims to address these gaps.
Objectives and Hypotheses
This study has four objectives: (i) to examine the nature and extent of rainfall and temperature variability in Tamil Nadu during the period 2000 to 2023; (ii) to identify output trends across major crops and examine whether irrigated and rainfed crops respond differently to climate variability; (iii) to quantify the statistical association between climate variables and rice production; and (iv) to derive policy-relevant implications for climate risk management and agricultural adaptation in Tamil Nadu.
To address these objectives, the study tests the following null hypotheses:
H₀₁: There is no significant variability or trend in rainfall, temperature, and the number of rainy days during the study period.
H₀₂: Climate variability has no differential impact on the output trends of irrigated and rain-fed crops.
H₀₃: There is no statistically significant relationship between climatic variables (rainfall, mean temperature, and rainy days) and rice production.
H₀₄: Climate variability has no significant influence on the structural composition of agricultural output in Tamil Nadu.
The empirical findings of the study provide evidence to reject all four null hypotheses, confirming that climate variability has exerted a measurable and differentiated influence on crop performance and agricultural structural change in Tamil Nadu over the study period.
The international literature has increasingly established that climate variability and climate change adversely affect agricultural productivity, particularly in tropical and developing economies. Lobell et al.9 reported that climate trends between 1980 and 2008 reduced global wheat production by approximately 5.5% and maize production by 3.8%. In a broader synthesis of crop simulation studies, Challinor et al.10 analysed more than 1,700 crop model simulations and estimated average yield reductions of nearly 8% per decade for tropical crops, even without fully accounting for adaptation responses. Wheeler and von Braun11 identified South Asia as one of the region’s most vulnerable to climate-induced food insecurity, emphasising rainfall variability and monsoon uncertainty as major sources of agricultural risk.
In the Indian context, Kumar and Parikh12 demonstrated that a 2°C rise in temperature combined with a 7% decline in rainfall could reduce net farm revenues by 8-26%, with rain-fed regions of South India being particularly vulnerable. Birthal et al.4 found that rising temperatures have negatively affected rice productivity in several parts of India, especially in southern states. Similarly, Guiteras13 observed that Indian agricultural output is highly sensitive to temperature shocks exceeding 29°C during the Kharif season, a threshold frequently approached in Tamil Nadu.
Studies focusing specifically on Tamil Nadu also point to increasing climatic vulnerability. Selvaraju14 showed that El Niño years are associated with below-normal North-East Monsoon rainfall and substantial declines in rice productivity. Krishnamohan and Krishnamurthy15 documented significant declining rainfall trends across a majority of weather stations in Tamil Nadu during the latter half of the twentieth century. Gopinath et al.16 estimated that reductions in annual rainfall significantly affect farm household income and agricultural stability in the state.
Despite the growing body of literature, two important gaps remain. First, most studies on Tamil Nadu focus either on individual crops or on isolated climatic variables, thereby overlooking the broader structural relationship between crop type and climate sensitivity. Second, limited attention has been given to distinguishing between the effects of gradual warming trends and inter-annual climate variability on agricultural performance. Addressing these gaps, the present study examines rainfall variability, temperature fluctuations, and structural crop divergence in Tamil Nadu within a unified empirical framework covering the period 2000-2023.
Materials and Methods
Study Area and Data Sources
The study covers Tamil Nadu as a whole for the period 2000-2023, using annual time-series data on climatic variables and major crop production trends. For contextual and regional interpretation, selected agricultural districts representing the major agro-climatic zones of the state are referred to where relevant. These include Thanjavur and Tiruvarur (Cauvery Delta Zone), Nagapattinam and Cuddalore (Coastal Zone), Villupuram (North Eastern Zone), Vellore and Madurai (Dry Farming Zone), and Dindigul, Coimbatore, and Salem (Western Zone). Collectively, these districts account for a substantial share of Tamil Nadu’s cultivated area and reflect the diversity of irrigated and rain-fed agricultural systems across the state.
All data used in this study are secondary in nature. Annual climate data including rainfall, maximum, minimum, and mean temperature, and number of rainy days were obtained from the India Meteorological Department,7 Chennai Regional Meteorological Centre, for the period 2000-2023 (latest available consistent dataset at the time of analysis). Crop production statistics were sourced from DES-TN Season and Crop Reports.1 Agricultural GSVA at constant 2011-12 prices was obtained from the Reserve Bank of India’s Handbook of Statistics on Indian States 17; this series covers 2004-05 to 2022-23 and is used for trend analysis only. District-level vulnerability classification follows the NABARD Climate Risk Atlas.18
Variables and Analytical Methods
The study uses three climate variables: annual rainfall (RF, mm), mean annual temperature (TMEAN, °C), and number of rainy days (NRD). The main agricultural outcome variable is rice production (million tonnes), available for all 24 annual observations (2000-2023). Rice was selected because it is Tamil Nadu’s principal food crop, occupies the largest share of net sown area, and is directly rain-dependent during its critical growth stages. It is acknowledged that climate-crop relationships for rain-fed crops such as groundnut and millets may differ; the need for similar analyses covering these crops is discussed in Section 5. Agricultural GSVA (at 2011–12 constant prices) is retained as a structural trend indicator in Table 2 but is excluded from correlation analysis because its strong structural upward trajectory driven by economy-wide growth produces spurious associations with climate variables.
The study uses three main methods. First, descriptive statistics (mean, standard deviation, coefficient of variation, minimum, and maximum) are used to show how much each variable changes over time. Second, OLS time-trend regression (Yₜ = α + βt + εₜ) is used to find the yearly trend and check whether it is statistically significant. Third, Pearson correlation (r) is used to measure the relationship between each climate variable and rice production (n = 24, df = 22), tested at the 1% significance level.
Results
Climate Variability in Tamil Nadu
Tamil Nadu’s climate shows high variability in rainfall, while temperature remains relatively stable over time. Table 1 presents the descriptive statistics and Ordinary Least Squares (OLS) trend coefficients for key climate variables in Tamil Nadu over the period 2000-2023.
Table 1: Descriptive Statistics and Trend Analysis of Climate Variables, Tamil Nadu (2000–2023)
|
Variable |
Period |
Mean |
Min |
Max |
SD |
CV (%) |
Trend β |
|
Annual Rainfall (mm) |
2000- 2023 |
1078.2 |
780 |
1,420 |
157.2 |
14.58 |
+6.08 |
|
Max Temperature (°C) |
2000- 2023 |
34.57 |
33.8 |
35.6 |
0.48 |
1.38 |
−0.002 |
|
Min Temperature (°C) |
2000- 2023 |
24.94 |
24.4 |
25.7 |
0.32 |
1.28 |
+0.010 |
|
Mean Temperature (°C) |
2000- 2023 |
29.77 |
29.1 |
30.7 |
0.40 |
1.33 |
+0.002 |
|
Rainy Days (no.) |
2000- 2023 |
60.0 |
40 |
82 |
10.1 |
16.84 |
+0.23 |
Source: India Meteorological Department (IMD, 2023), Chennai Regional Meteorological Centre; data.gov.in. Compiled by the authors. Note: None of the trend coefficients are statistically significant at p < 0.05. The high CV values for rainfall (14.58%) and rainy days (16.84%) confirm that variability, rather than a directional trend, is the defining climatic characteristic of Tamil Nadu over this period.
Table 1 shows strong inter-annual variability in rainfall and relatively stable temperature conditions. Annual rainfall ranges from 780 mm to 1,420 mm, a difference of 640 mm, which is nearly 60% of the long-term average. The coefficient of variation (14.58%) confirms substantial year-to-year fluctuations, indicating high uncertainty in rainfall. The number of rainy days is even more variable (CV = 16.84%), showing that both quantity and distribution of rainfall change significantly across years.
In contrast, temperature shows low variability. Mean temperature ranges from 29.1°C to 30.7°C – a 1.6°C range – with a coefficient of variation of only 1.33%. OLS trend results indicate that maximum, minimum, and mean temperatures do not show any statistically significant long-term trend over 2000–2023, suggesting no clear warming trend in the dataset. What it does find is that the temperature fluctuations that already occur from year to year are consequential for crops, as Section 4.3 demonstrates. The absence of a significant long-run warming trend does not diminish this finding; if anything, it sharpens the policy focus toward managing the variability that is already present, rather than waiting for a trend to manifest. H₀₁ is therefore rejected on the grounds of statistically significant inter-annual variability, even in the absence of a significant directional trend.
To further illustrate the pattern of inter-annual rainfall variability identified in Table 1, Figure 1 presents the annual rainfall distribution over the study period.
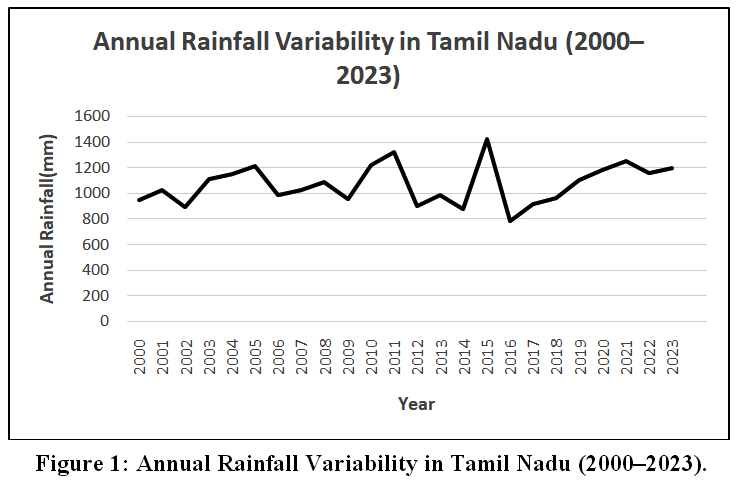 |
Figure 1: Annual Rainfall Variability in Tamil Nadu (2000–2023) |
Source: Authors’ compilation based on India Meteorological Department (IMD), 2023.
Figure 1 illustrates the inter-annual variation in rainfall across Tamil Nadu during 2000–2023. The series shows pronounced fluctuations, with distinct peaks (e.g., 2015) and troughs (e.g., 2016). The fitted trend line indicates a mild upward trajectory, consistent with the positive trend coefficient reported in Table 1. However, the irregular pattern highlights the high year-to-year unpredictability of rainfall, reinforcing its role as a key source of agricultural risk in a predominantly rain-fed system.
Crop Output Trends
Table 2 presents output trends for five major crops along with Agricultural GSVA in Tamil Nadu. The results do not indicate a uniform decline in agriculture; instead, they reveal a widening divergence between irrigated and rain-fed farming systems. Irrigated crops such as rice, sugarcane, and cotton show positive growth trends, whereas rain-fed crops such as groundnut and millets display declining trends. This divergence is consistent with climate vulnerability literature and strongly suggests that differential access to irrigation mediates how crop systems respond to monsoon variability.
Table 2: Descriptive Statistics and Trend Analysis of Agricultural Output, Tamil Nadu (2000–2023)
|
Crop / Variable |
Mean |
Min |
Max |
CV (%) |
Trend β |
Sig. |
|
Rice (million MT) |
6.038 |
5.000 |
7.100 |
9.75 |
+0.057 |
** |
|
Sugarcane (million MT) |
32.1 |
28.5 |
36.5 |
8.1 |
+0.31 |
** |
|
Groundnut (million MT) |
1.63 |
1.10 |
2.10 |
17.2 |
−0.045 |
** |
|
Cotton (lakh bales) |
5.9 |
4.0 |
7.2 |
15.6 |
+0.14 |
** |
|
Millets (million MT) |
0.76 |
0.64 |
0.90 |
10.8 |
−0.012 |
* |
|
Agri GSVA (₹ crore, 2011–12 prices) |
48,200 |
38,500 |
57,800 |
11.6 |
+820 |
** |
Source: DES–TN Season and Crop Reports (2000–2023); RBI Handbook of Statistics on Indian States (RBI, 2024). Compiled by the authors. Note: ** p < 0.01; * p < 0.05. Agri GSVA series covers 2004–05 to 2022–23 at constant 2011–12 prices.
Rice production increased from a low of 5.0 million metric tonnes (million MT) or simply million tonnes, in 2002 to around 7.1 MT by the end of the study period, with a positive trend coefficient of +0.057 MT per year. However, production fluctuations were clearly visible during major drought years such as 2002, 2009, 2012, 2014, and 2016, followed by recovery during years of improved rainfall. This suggests that rice production in Tamil Nadu continues to depend strongly on rainfall conditions and the distribution of rainfall during the cropping season.
Groundnut shows a contrasting pattern. With a coefficient of variation of 17.2% and a negative trend coefficient of −0.045 MT per year, it is both the most variable and the most consistently declining crop in the dataset. Groundnut cultivation is largely rain-fed and highly sensitive to rainfall stress and high temperature conditions. Similarly, millet production also shows a declining trend, despite traditionally being considered drought-resistant. Irregular rainfall onset and changing seasonal conditions appear to have affected sowing patterns and crop performance in recent years. The decline of these crops reflects the growing vulnerability of rain-fed agriculture to climatic uncertainty.
In contrast, sugarcane and cotton show positive production trends. These crops benefit from greater irrigation support through canal systems and groundwater use in major agricultural districts. The results suggest that while irrigation may not completely remove climate risk, it significantly reduces the exposure of crops to rainfall variability. The structural divergence observed in Table 2 therefore provides evidence to reject the second hypothesis (H₀₂).
Spatially, districts with lower irrigation coverage and greater exposure to cyclones and rainfall shocks tend to experience higher agricultural vulnerability. Coastal and dry-zone districts such as Nagapattinam, Tiruvarur, and Madurai are particularly sensitive to climate variability, whereas districts with relatively stronger irrigation access, such as Coimbatore and Vellore, demonstrate better adaptive capacity.
To further illustrate the contrasting performance of irrigated and rain-fed crops, Figure 2 presents the structural divergence in crop output trends during the study period.
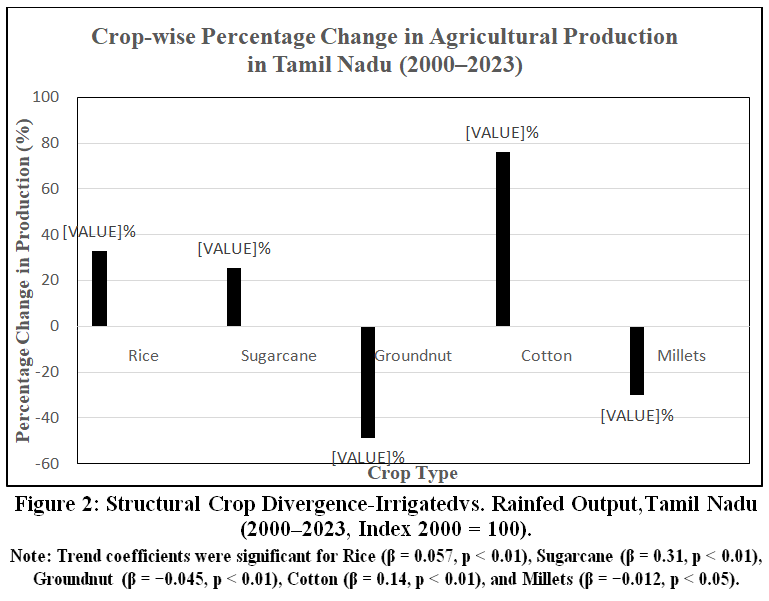 |
Figure 2: Structural Crop Divergence – Irrigated vs. Rainfed Output, Tamil Nadu (2000–2023, Index 2000 = 100) |
Source: Authors’ compilation based on DES–TN Season and Crop Reports, 2023.
Figure 2 presents the percentage change in production of major crops in Tamil Nadu during 2000-2023, highlighting clear differences in crop performance. Rice and sugarcane show substantial positive growth, increasing by approximately 36.5% and 28.8% respectively, indicating the importance of irrigation support and relative resilience to climate variability. Cotton also records a positive trend, reflecting growing commercialization and market expansion.
In contrast, groundnut and millets show notable declines of about 52.4% and 32.2% respectively. These crops are predominantly rain-fed and therefore more vulnerable to fluctuations in rainfall and temperature conditions. The decline indicates increasing stress on traditional rain-fed agriculture under changing climatic conditions.
The contrasting trends shown in the figure point to an ongoing structural shift in cropping patterns, with farmers gradually moving away from climate-sensitive crops towards relatively resilient or economically profitable alternatives. Overall, the figure suggests that climate variability affects Tamil Nadu agriculture through crop-specific responses and structural changes in agricultural production rather than through a uniform decline in overall agricultural output.
What Climate Means for Rice: The Correlation Evidence
Table 3 presents the Pearson correlation results between major climate variables and rice production in Tamil Nadu. The correlations are calculated using 24 annual observations for the period 2000-2023 and are statistically significant at the 1% level.
Table 3: Pearson Correlation— Climate Variables and Rice Production, Tamil Nadu (2000–2023)
|
Variable Pair |
Pearson r |
t-stat (df = 22) |
Significance |
|
Annual Rainfall × Rice Production |
+0.806 |
+6.39 |
p < 0.01 |
|
Mean Temperature × Rice Production |
−0.540 |
−3.01 |
p < 0.01 |
|
Number of Rainy Days × Rice Production |
+0.741 |
+5.18 |
p < 0.01 |
Source: Authors’ calculations based on IMD (2023) and DES–TN data (n = 24, df = 22). All correlations are significant at p < 0.01, two-tailed test. Agricultural GSVA is excluded from correlation analysis because its strong structural upward time trend (r = 0.937 with year number alone, p < 0.01) produces spurious associations with climate variables; it is retained in Table 2 as a structural performance indicator only.
The strongest relationship observed in Table 3 is between annual rainfall and rice production (r = +0.806, p < 0.01). This indicates a strong positive association between rainfall and rice output in Tamil Nadu. Years with higher rainfall generally record higher rice production, while drought years show sharp declines in output. The result highlights the continued dependence of rice cultivation on monsoon rainfall and reservoir-fed irrigation systems.
Mean temperature shows a significant negative correlation with rice production (r = −0.540, p < 0.01). Although the study does not identify a significant long-term warming trend, year-to-year temperature fluctuations still appear to influence agricultural performance. In years when mean temperature was relatively high, particularly around 30.5-30.7°C as observed in 2014 and 2016, rice production levels were comparatively lower. This may be due to the adverse effects of heat stress during flowering and grain-filling stages, which can reduce grain formation and crop productivity. The year 2016 recorded both the highest mean temperature (30.7°C) and the lowest annual rainfall (780 mm), while rice production declined to about 5.2 MT, one of the lowest levels during the study period. This suggests that the combined effect of low rainfall and high temperature can significantly reduce agricultural output.
The number of rainy days also shows a strong positive relationship with rice production (r =+0.741, p < 0.01). This suggests that not only the quantity of rainfall but also its distribution across the cropping season is important for agricultural output. Even moderate rainfall spread across several rainy days is often more beneficial than intense rainfall concentrated within a short period.
Overall, the correlation results indicate that climate variability has a significant influence on rice production in Tamil Nadu. Rainfall and rainy days show positive relationships with output, while temperature shows a negative association. These findings provide evidence to reject the third hypothesis (H₀₃), confirming that climate variables significantly affect rice production.
To visually illustrate the relationship between rainfall and rice production, Figure 3 presents the scatter plot for annual rainfall and rice output during the study period.
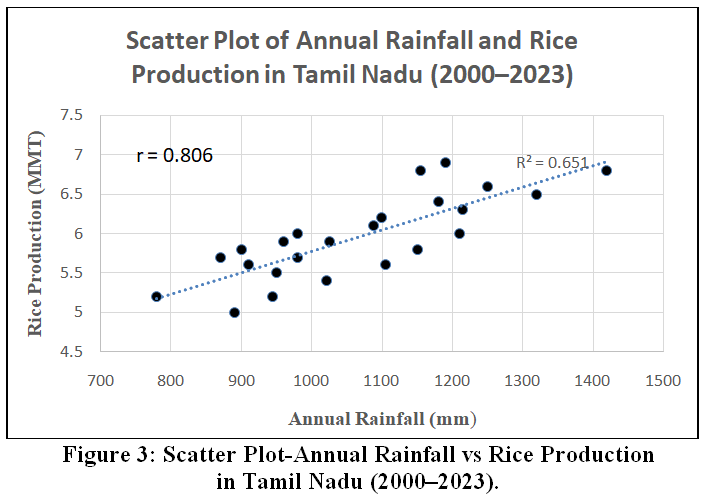 |
Figure 3: Scatter Plot – Annual Rainfall vs Rice Production in Tamil Nadu (2000–2023). |
Source: Authors’ compilation based on IMD (2023) and DES–TN Season and Crop Reports (2023).
Figure 3 shows a clear positive relationship between annual rainfall and rice production in Tamil Nadu. The upward-sloping trend line indicates that years with higher rainfall are generally associated with higher rice output, whereas years with low rainfall correspond to reduced production levels. The figure visually supports the correlation results presented in Table 3 and reinforces the importance of rainfall in determining agricultural performance in the state.
The results also suggest that climate variability affects agriculture through changes in both rainfall quantity and temperature conditions. The impact is not uniform across all crops, but operates through crop-specific responses and differences in irrigation access. Therefore, the findings provide support for rejecting the fourth hypothesis (H₀₄), confirming that climate variability influences the structural composition of agricultural production in Tamil Nadu.
Discussion
The results presented in Section 4 collectively establish that climate variability is the dominant factor associated with agricultural performance in Tamil Nadu, operating through both rainfall and temperature pathways. The strong positive correlation between annual rainfall and rice production (r = +0.806, p < 0.01) confirms that inter-annual monsoon variability, rather than a gradual warming trend, constitutes the primary climatic risk for food crop output. This is consistent with findings from Selvaraju,14 who documented rainfall-linked declines in rice productivity during El Niño years, and aligns with broader evidence from Birthal et al.4 on temperature-linked rice yield losses across southern India. These correlations are consistent across multiple studies in the region, strengthening confidence in the direction of the relationship, though it must be emphasised that correlation does not establish causation. The observed associations may be confounded by co-varying factors and should be interpreted as evidence of a strong statistical relationship rather than a definitive causal mechanism.
The structural divergence between irrigated and rainfed crops is the central empirical finding of this study. Irrigated crops (rice, sugarcane, cotton) show sustained positive output trends, while rainfed crops (groundnut, millets) are in persistent decline. This divergence reflects the buffering role of irrigation against monsoon variability, consistent with the climate resilience literature reviewed in Section 2. The findings extend and complement those of Rao et al.5 and Krishnan et al.3 by demonstrating how differential access to irrigation mediates agricultural vulnerability at the crop-system level within a single state context. It should be acknowledged, however, that this structural divergence cannot be attributed solely to climate variability. Several non-climatic drivers are likely to have contributed to differential crop performance over this period. Expansion of canal and borewell irrigation under state and national schemes has progressively extended irrigated area, particularly in delta districts, decoupling irrigated crop output from monsoon shocks. Minimum Support Price (MSP) revisions and government procurement policies have historically favoured rice and sugarcane over groundnut and millets, creating market incentives that shape cropping decisions independently of climate.19 Technological change, including adoption of improved varieties, mechanisation, and precision nutrient management has advanced more rapidly in irrigated systems. Disentangling these climate and non-climate effects with greater precision will require district-level panel data methods in future research.
The negative correlation between mean temperature and rice production (r = −0.540, p < 0.01), despite the absence of a statistically significant long-term warming trend, confirms that existing inter-annual temperature variability is already agronomically consequential. This observation is consistent with Guiteras,13 who identified 29°C as a critical temperature threshold for Kharif crop output in India. The compounding effect of low rainfall and high temperature observed in 2016 – the worst production year in the study period – illustrates the non-linear interaction between these stressors that simple trend analyses may obscure. The additional contribution of the number of rainy days (r = +0.741) reinforces that rainfall distribution, not merely total volume, is critical for crop performance, a finding with direct implications for seasonal planning and water resource management under increasingly event-driven precipitation regimes. While rice serves as the representative crop in this analysis, rain-fed crops such as groundnut and millets may exhibit different climate sensitivities owing to their distinct phenological stages, varietal characteristics, and cropping seasons. Future research should extend this empirical framework to other key crops using district-level panel data to develop a more comprehensive understanding of climate-agriculture linkages in Tamil Nadu.
Policy Implications
The following policy directions are grounded in observed statistical associations; they should be implemented alongside causal research and contextual assessment. Four policy directions follow from these findings. First, expanding reliable irrigation coverage in the state’s rainfed districts is the single most effective way to reduce agricultural exposure to rainfall variability, not because irrigation eliminates climate risk, but because it decouples crop performance from the most severe monsoon shocks. Second, climate-resilient varieties of groundnut and millets suited to erratic rainfall onset and intermittent heat stress should be actively promoted through research, extension services, and remunerative procurement arrangements. Third, seasonal rainfall forecasting and crop advisory services need to improve so that farmers can make more informed decisions about what to plant, when to sow, and when to deploy supplemental irrigation. Fourth, targeted income support mechanisms for rainfed smallholders – whose vulnerability is structural and persistent, not merely episodic should be embedded in state agricultural policy rather than delivered as emergency relief.
This study has two limitations worth acknowledging. The correlation analysis is restricted to rice as the representative crop, because only rice production data are available annually for the full 24 year period without structural breaks; future research should extend this framework to other major crops using district-level panel data. Additionally, Agricultural GSVA was retained as a structural trend indicator but could not be included in the correlation analysis because its strong upward trajectory driven by economy-wide growth rather than climate, produces misleading associations. Future work using detrended farm income estimates or National Sample Survey Office (NSSO) survey-based data would allow a more complete assessment of climate’s impact on rural livelihoods in Tamil Nadu. It is further recognised that state-level aggregate findings may require significant district-level tailoring in implementation; coastal districts such as Nagapattinam face fundamentally different climate risks from semi-arid inland districts such as Madurai, and policy interventions should be calibrated accordingly.
Conclusion
This study set out to examine how climate variability shapes agricultural output in Tamil Nadu, and the evidence converges on a clear conclusion: the dominant agricultural risk in this state is not a slow and steady warming – though it is acknowledged that a 24-year dataset has limited power to detect subtle long-term warming- but the sharp, unpredictable swings in rainfall that determine whether any given growing season succeeds or fails. Rainfall variability is high (CV = 14.58%), its association with rice production is strong and statistically significant (r = +0.806), and its cumulative consequences for rainfed crops are structural and deepening. No statistically significant long-term warming trend was detected within the 2000- 2023 dataset, but inter-annual temperature fluctuations are large enough to independently depress rice output in above-average temperature years. The structural divergence between irrigated and rainfed crops – the central empirical finding of this study is best understood as an ongoing adaptation. Farmers with irrigation access are effectively buffered against monsoon shocks, and their crops show sustained positive output trends. Farmers without that buffer face the full force of inter-annual climate variability, and their crops are in long-run decline. Tamil Nadu’s agricultural composition is shifting as a result. If this shift continues unchecked, the state risks progressively losing the production base of nutritionally important rainfed crops – particularly groundnut and millets.
Acknowledgement
This paper forms part of the postgraduate research of Ms. Sowndharya S., conducted under the supervision of Dr. J. S. Sindhu at the PG & Research Department of Economics, Agurchand Manmull Jain College, Chennai. The authors thank the India Meteorological Department, the Directorate of Economics and Statistics (Tamil Nadu), and the Reserve Bank of India for making their data publicly accessible. No external funding was received for this work.
Funding Sources
The author(s) received no financial support for the research, authorship, and/or publication of this article.
Conflict of Interest
The authors do not have any conflict of interest.
Data Availability Statement
The manuscript incorporates all datasets produced or examined throughout this research study.
Ethics Statement
This research did not involve human participants, animal subjects, or any material that requires ethical approval.
Informed Consent Statement
This study did not involve human participants, and therefore, informed consent was not required.
Clinical Trial Registration
This research does not involve any clinical trials.
Author Contributions
- J. S. Sindhu: Conceptualization, Methodology, Supervision, Writing – Review & Editing.
- Sowndharya S.: Data Collection, Analysis, Writing – Original Draft.
References
- Department of Economics and Statistics, Government of Tamil Nadu (DES–TN). Statistical Handbook of Tamil Nadu. Government of Tamil Nadu; 2023.
- Intergovernmental Panel on Climate Change (IPCC). Climate Change 2022: Impacts, Adaptation and Vulnerability. Cambridge University Press; 2022. doi : http://dx.doi.org/10.1017/9781009325844
CrossRef - Krishnan R, Sanjay J, Gnanaseelan C, Mujumdar M, Kulkarni A, Chakraborty S. Unravelling climate change in the monsoon region. Curr Clim Change Rep. 2020;6:1-12. doi : http://dx.doi.org/10.1007/s40641-020-00161-3
CrossRef - Birthal P. S, Khan M. T, Negi D. S, Agarwal S. Impact of climate change on yields of major food crops in India: Implications for food security. Agric Econ Res Rev. 2014;27(2):145-155. doi : http://dx.doi.org/10.5958/0974-0279.2014.00015.5
CrossRef - Rao C. S, Gopinath K. A, Prasad J. V. N. S, Singh A. K. Climate resilient villages for sustainable food security in tropical India: Concept, process, technologies, institutions, and impacts. Adv Agron. 2016;140:101-214. doi : http://dx.doi.org/10.1016/bs.agron.2016.06.003
CrossRef - Krishnamurthy V, Goswami B. N. Indian monsoon–ENSO relationship on interdecadal timescale. J Clim. 2000;13(3):579-595. doi : http://dx.doi.org/10.1175/1520-0442(2000)013<0579:IMEROI>2.0.CO;2
CrossRef - Indian Meteorological Department (IMD). Southwest and Northeast Monsoon Reports. Ministry of Earth Sciences, Government of India; 2023.
- Mall R. K, Gupta A, Singh R, Singh R. S, Rathore L. S. Water resources and climate change: An Indian perspective. Curr Sci. 2006;90(12):1610-1626.
- Lobell D. B, Schlenker W, Costa-Roberts J. Climate trends and global crop production since 1980. Science. 2011;333(6042):616-620. doi : http://dx.doi.org/10.1126/science.1204531
CrossRef - Challinor A. J, Watson J, Lobell D. B, Howden S. M, Smith D. R, Chhetri N. A meta-analysis of crop yield under climate change and adaptation. Nat Clim Change. 2014;4(4):287-291. doi : http://dx.doi.org/10.1038/nclimate2153
CrossRef - Wheeler T, von Braun J. Climate change impacts on global food security. Science. 2013;341(6145):508-513. doi : http://dx.doi.org/10.1126/science.1239402
CrossRef - Kumar K. S. K, Parikh J. Indian agriculture and climate sensitivity. Glob Environ Change. 2001;11(2):147-154. doi : http://dx.doi.org/10.1016/S0959-3780(00)00053-1
CrossRef - Guiteras R. The impact of climate change on Indian agriculture [Working Paper]. University of Maryland; 2009. doi : http://dx.doi.org/10.2139/ssrn.1476191
- Selvaraju R. Impact of El Niño–Southern Oscillation on Indian foodgrain production. Int J Climatol. 2003;23(2):187-206. doi : http://dx.doi.org/10.1002/joc.858
CrossRef - Krishnamohan K. S, Krishnamurthy R. R. Trends in rainfall pattern over Tamil Nadu. Int J Geol Earth Environ Sci. 2014;4(3):99-104.
- Gopinath R, Suganya G, Panneerselvam S, Maragatham N. Climate variability and its impact on agriculture in Tamil Nadu. Madras Agric J. 2012;99(7-9):490-494.
- Reserve Bank of India (RBI). Handbook of Statistics on Indian States. Reserve Bank of India; 2024.
- National Bank for Agriculture and Rural Development (NABARD). Climate Risk Atlas. NABARD; 2018.
- Government of Tamil Nadu. Tamil Nadu State Action Plan on Climate Change – Phase II (TNSAPCC-II). Environment and Forests Department; 2023.
- IPCC. Climate Change 2023: Synthesis Report. Contribution of Working Groups I, II and III to the Sixth Assessment Report. Cambridge University Press; 2023. doi : http://dx.doi.org/10.59327/IPCC/AR6-9789291691647
CrossRef
Abbreviations
IMD – India Meteorological Department;
DES-TN – Directorate of Economics and Statistics, Tamil Nadu
OLS – Ordinary Least Squares