

Introduction
Wheat (Triticum aestivum L) ranks second among the cereal crop (rice and maize) and is the immense important crop cultivated extensively in the Rabi season in India. Wheat is a highly nutritious crop providing about 50 per cent of the calories and proteins requirement to a vast majority of India’s population1. It is also used as an important raw material in mills for making many value added product for human consumption like macaroni, biscuits, bread, cake, pasta, spaghetti and many more. It has been observed that there is a significant increase in the wheat production over the last two decades, (72.8 million tonnes in 2002 to 103.5 million metric tonnes in 2019) indicating a better performance of wheat production in the country. China ranked first producing 133.6 million metric tonnes of wheat grain followed by China mainland (133.5 million metric tonnes) contributing about 14 per cent of world production of wheat while, India contributes 11 per cent of world production of wheat. However, India ranked third place in production of wheat, producing 103.5 million metric tonnes of grain production. In context of productivity, France ranked first (7.74 t/ha) followed by Germany (7.39 t/ha), China (5.63t/ha), China mainland (5.63 t/ha) Ukarine (4.15 t/ha) and India (3.35 t/ha)2. In the Union territory of Jammu and Kashmir among the cereals crops rice is the dominant crop cultivated on majority of area of 304.50 thousand hectares followed by maize (293.86 thousand hectares) and wheat (281.87 thousand hectares) with an average yield of 21.23quintals/ha, 17.82 quintals/ha and 19.33quintals/ha respectively. In J&K average area and production of wheat is showing an increasing trend but average productivity shows a declining trend1, therefore it is very important to understand the various factors that influence the efficiency, productivity and profitability of wheat crop in hilly/mountainous areas of Jammu and Kashmir. For this purpose present study was conducted in four intermediate blocks of Rajouri and Poonch with an agro-climatic zone range between 800-1500 m masl. Rajouri district is located between 70o-74o 4’ East longitude and 32o 52’ and 33o 35’ North latitude. It is bounded by Poonch district in the East, Pak occupied Kashmir (Mirpur) in the West while Poonch is located on the Southern slopes of PirPanjal range and lies between 33o 25’to 34o 10’ North latitude and 73o 58’ to 74o 35′ East longitude. In both districts, wheat is a major crop growing after rice and maize and it is grown almost on the same piece of land on which maize and rice are grown. As wheat is mostly rainfed crop and irrigation is mostly dependent on seasonal rain. Its productivity remains low from the national average. Therefore, there is a need to increase the productivity of the wheat crop. Based on the above discussed fact present study aimed to analyze the various cost components (fixed and variable cost components) and to identify various factors that affect the productivity of crops and profit gained by wheat growers by analyzing technical, economic and allocative efficiency of wheat crop in study area.
Methodology and Data
Based on primary data collected from 251 randomly selected farmers from four the blocks of Rajouri and Poonch districts of Jammu and Kashmir by using multi-stage random sampling technique to analyze costs and returns and also to estimate the level of various types of efficiencies. A well-structured schedule was used to collect information from the randomly selected farmers in rainfed areas of hilly districts i.e in Rajouri and Poonch. All 251 farmers were cultivating wheat crop with their main purpose of producing the crop for fodder, to feed their livestock. Rearing livestock is an important livelihood strategy of the people living in mountainous areas. However, agriculture and livestock rearing is the only farming system had been adopted by the farm household in mountainous areas of Jammu.
Economic Analysis
The collected data were analyzed to examine the technical, economic and allocative efficiency and also analyzed to determine the socio-economic factors that affect the technical efficiency.
Method of Analysis
Stochastic frontier approach is most widely used for the efficiency estimation. This approach introduces stochastic random noises that are beyond the control of the farmers in addition to the inefficiency effects. There are many types of stochastic frontier functional forms such as Cobb-Douglas, Translog or the Zellner-Revankar generalized production function4. Among all these functional forms Cobb-Douglas stochastic frontier function (in-spite of its restrictive properties) is mainly preferred because its coefficients directly represent the output elasticity of inputs, easy for interpretation and estimation than other forms of frontier moreover, it takes into account all the disturbance term, error and exogenous shocks that are beyond the human control and it also capture deviations from the frontier due to inefficiency. That is why the Cobb-Douglas stochastic frontier approach was chosen as more appropriate analytical tool for studying efficiency parameter5,6so, on the basis of above discussed facts, Cobb-Douglas stochastic frontier function have been employed in present study for efficiency estimation due to its discreet advantages over the other methods. Aigner7; Ali and Flinn8; Kalirajan and Shand9; Sharma and Dutta10; Rahman11; Galawat and Yabe12 have also used same analytical tool in their various fields of study. Allocative efficiencies were estimated by dividing economic efficiency with technical efficiency.
Cobb-Douglas stochastic frontier production function
The stochastic frontier production function that assumed Cobb-Douglas form is given as:
LnYi= b0+b1lnX1+ b2lnX2+ b3lnX3+ b4lnX4+ b5lnX5+ Vi-Ui………….(1)
Where
bi = parameters denoted the coefficient of inputs to be estimated by maximum likelihood estimation method (MLE)
Ln = Natural logarithm
Yi = Output (quintals/ha)
X1 = Quantity of seed (kg/ha)
X2 = Quantity of inorganic fertilizer (quintals/ha)
X3 = Quantity of organic fertilizer (quintals/ha)
X4 = Human labour (mandays/ha)
X5 = Machine labours (hrs/ha)
Vi = random variable assumed to be independently, identically and normally distributed
Ui = is a non-negative random variable and one-sided component that reflects technically efficiency relative to stochastic frontier
Technical Efficiency
The level of technical efficiency is estimated as:
TEi= Yi/Yi*
= f (Xibi) exp(Ui)/ f(Xibi) exp(vi)
= exp (-Ui)
Where,
Yi is the actual output while
Yi* is the frontier output or the maximum potential output.
To test whether technical inefficiency effect is absent, the convectional production function is more appropriate
For the inefficiency effect model, the household specific factors are assumed to linearly affect farm technically efficiency. Given the specification of the stochastic frontier production function as defined by equation (1), the technical inefficiency effect of the ithfarmer is given as:
Ui= b0+b1lnZ1+ b2lnZ2+ b3lnZ3+ b4lnZ4+ b5lnZ5+ b6lnZ6+ b6lnZ6+ Wi
Where,
bi are parameters denoted the coefficient of technical efficiency effects
Ui = Technical inefficiency
Z1 = Number of females
Z2 = Education years of respondent
Z3 = Family size
Z4 = Cultivated area
Z5 = Age of respondents
Z6 = Number of Children
Wi = unobserved random error term
I = number of farmers.
The Stochastic frontier profit function
The stochastic frontier profit function was used for the estimation of profit efficiency by employing the following profit frontier model
Ln∏i= b0+b1lnX1+ b2lnX2+ b3lnX3+ b4lnX4+ b5lnX5+Vi-Ui
∏I = Restricted profit (Current revenue less current variable cost)
X1 = price of seed per kg normalized by wheat output ( )
X2 = Price of inorganic fertilizer per quintal normalized by the output price of the ith farm.
X3 = Price of organic fertilizer per quintal normalized by the wheat output of the ith farm.
X4 = Human labour wage rate per day normalized by output price of the ith farm.
X5 = Machine labour wage rate per hour normalized by output price of the ith farm.
Vi = random variable
Ui = Farm-specific economic efficiency related variable
Normalized price is obtained by dividing the price of input with the output price.
The economic efficiency in relation to the stochastic profit frontier is given by:
EEi= exp(ui)
Allocative efficiency was estimated by dividing economic efficiency with technically efficiency for each farm.
AEi= EEi/TEi
Results and Discussion
Cropping pattern in studydistricts
Maize, wheat and paddy are three major crops grown in the study districts of Rajouri and Poonch. It is evident from the from the Table 1 that out of total cropped area, maximum acreage is under cereal crop in both districts among which major area is allocated towards maize (47%) and wheat (45%) in district Rajouri and 54 per cent and 33 per cent, respectively in district Poonch. In the Kharif season, paddy is grown on irrigated lands while as under rainfed conditions wheat and maize crops are usually grown. As districts Rajouri and Poonch are mountainous districts, maize and wheat are grown mostly in hilly areas. Rabi season is solely governed by wheat crop and is grown in these lands which are occupied by maize and rice in Kharif season.
Table 1: Area sown under different food crops in study districts (000 ha)
| Crop | Rajouri | Poonch | ||
| Area | Percentage | Area | Percentage | |
| Rice | 4.41 | 4.34 | 2.86 | 6.39 |
| Bajra | 0.56 | 0.55 | 0.00 | 0.00 |
| Maize | 47.48 | 46.75 | 24.20 | 54.11 |
| Wheat | 45.59 | 44.89 | 14.96 | 33.44 |
| Barely | 0.10 | 0.10 | 0.00 | 0.00 |
| Pulses | 0.31 | 0.30 | 0.03 | 0.06 |
| Total Food-grains | 98.44 | 96.94 | 42.04 | 94.00 |
| Total food crops | 0.67 | 0.66 | 0.41 | 0.91 |
| Total non-food crop | 2.43 | 2.40 | 2.28 | 5.09 |
| Total area Sown | 101.54 | 100.00 | 44.73 | 100.00 |
Source: Regional Digest of Statistics (2016-17), DE & S, Govt. of Jammu and Kashmir
As per the field survey in the study area, it was found that 61 per cent of farmers belonged to the marginal farm category and 39 per cent belonged to the small farm category. The dominance of marginal farmers over small farm category in the study area emphasized upon their development. Owing to the fact of hills, the holding size is very small as compared to plains like Punjab and Haryana. Wheat is almost grown on the same piece of land on which maize and rice are grown and is mostly grown as a rainfed crop in hilly areas of Jammu and Kashmir as there areno irrigation facilities to be providedin hilly areas of study districts.The cost of cultivation of wheat crop was estimated considering the quantity of inputs, labour and their wages prevailing in the study area. The operational costs and returns along with the production of wheat crops grown by sample farm households are presented in Table 2.Farmers incur both variable costs as well as fixed costs on the production of wheat crops. Variable cost includes expenditure on part of ploughing, land preparation, seeds, fertilizers, manures, plant protection, cultural operations etc., while as, the fixed cost component usually comprises depreciation on part of farm machinery and buildings, interest on fixed capital and land rent. Cultivation ofwheat entails a total cost of 82,685/ha. Variable costs constitute more than 75 per cent in the wheat crop. One of the obvious reason was that farmers don’t have adequate knowledge on how efficiently they can use seed, manure/fertilizer and other source of production for the cultivation of crops which ultimately lead to miss management of farm practices and raise the cost of production per hectare which deprived the farmers from obtaining the profit from their crop enterprises, also injudicious use of inputs like manure/fertilizer, seed rate etc are the reason for the low productivity of crops. Expenditure on part of labour is the major cost component with contributing almost 50 per cent share to variable cost component i.e 26,000/ha. However, almost 90 per cent of labour employed on farms is owned family labour which makes the reason that farmers continue with the farming.Cost on part of manures and ploughing/land preparation with the help of tractor/bullocks are also major cost components of variable head. The manure is rarely purchased by the farm household and comes from their own livestock.Similarly in wheat crop average yield obtained was 20 quintals/ha with 700 bundles of straw as by-product yielded a gross return of 92,358/ha.Net return is found positive in wheat crop despite of lower gross returns.
Table 3 showed the concept wise costs incurred on the production of wheat. The per hectare cost of cultivation towards cost A, cost B, cost C, respectively worked out to be 63,085, 82,685 and 90,953 in wheat crop.Net return over cost A, cost B, cost C, calculated as 29,273, 9,673, 1,404 in wheat crop, however, the cost C was the overall average of total cost of production which included 10 per cent of cost B i.e value of management input. The major share of cost of cultivation goes towards cost B and cost C and this was due to total material cost like manure, fertilizer and family labour which constitute an important component of variable cost. Net return over cost A, B and C are positive in wheat crop but still it is less profitable when we compare it with total expenditure incurred by the farm household for the cultivation of crop.
Table 2: Cost of cultivation ( /ha).
| Partiulars | Wheat | ||
| Qty. | Value (Rs) | ||
| Depreciation (buildings, farm equipments) | 6100 | ||
| Interest on fixed capital | 2500 | ||
| Land rent | 11000 | ||
| Total fixed cost | 19600 | ||
| Seed(kg) | 76 | 2483 | |
| Manure (qntl) | 165 | 13256 | |
| fertilizers(qntl) | 3.31 | 7620 | |
| Family labour | 50 | 24771 | |
| Hired labour | 3 | 1606 | |
| Bullock charge | 4 | 5750 | |
| Tractor charge | 4915 | ||
| Plant protection chemicals | 0 | ||
| Interest on working capital | 1928 | ||
| Miscellaneous | 756 | ||
| Total variable cost | 63085 | ||
| Gross cost | 82685 | ||
| Value of by-product | 27714 | ||
| Net cost (Gross cost-value of by-product) | 54971 | ||
| Yield | Main product (qtls) | 20 | |
| By-product (bundles) | 700 | ||
| Value of Main Product ( ) | 61644 | ||
| Gross Returns ( /ha) | 92358 | ||
| Cost of Cultivation ( /ha) | 82685 | ||
| Net Returns ( /ha) | 9673 | ||
| Cost of Production ( /qtl)
(Net cost/Yield of main product) |
2493 | ||
Table 3: Net return from the cultivation of wheat crop over various cost level ( /ha).
| Particulars | |
| Grain Yield (qtl/ha) | 20 |
| Fodder Yield (bundles) | 700 |
| Value of Main and by-product ( /ha) | 92358 |
| Cost of cultivation | ( /ha) |
| Cost A | 63085 |
| Cost B | 82685 |
| Cost C | 90953 |
| Net Returns | ( /ha) |
| Over Cost A | 29273 |
| Over Cost B | 9673 |
| Over Cost C | 1404 |
Cost A: All actual expenses in cash and kind incurred in production by owner farmer including the imputed value of family labour.
Cost B: Cost A + Interest on value of owned capital assets + Rental value of land+ depreciation on capital farm assets
Cost C: Cost B + 10% of Cost B on account of managerial functions performed by farmers.
Estimation of Stochastic Frontier Production Function
The maximum likelihood estimates of the parameters of the stochastic production frontier and inefficiency model are estimated using Frontier 4.1 computer programme to examine the parameter estimates of the production frontier and thefactors that affect the efficiency of the farmers, Table 4 reveals thatfertilizer and farmyard manure,negatively affectthe level of wheat output and are found statistically significant,The magnitude of the coefficient of labour indicated that output in crop production is highly elastic to change in the amount of labour used. One per cent increase in labour would induce an increase in output of about 25 per cent in wheat crop. Results are in conformity with Amaza and his co-worker13 where they found that labour is the major factor that positively affects the output of food crops.The value of sigma square is 0.029, indicating the existence of technical inefficiency among the farmers and also an indication of good fit and correctness of model. The estimated value of gamma was 0.60, which means that 60 per cent of inefficiencies for these crops respectively among farmers were due to factors that were under farmers control and 40 per cent were due to random factors beyond their control. The value of log likelihood function was significantly different from zero implies that inefficiencies exist in production of all the three crops.
Table 4: Estimation frontier production function.
| Variables | Coefficient | Standard error |
| Production factor | ||
| Intercept | 2.899 | 0.989** |
| Seed | 0.167 | 0.081* |
| Fertilizer | -0.519 | 0.097* |
| FYM | -0.460 | 0.043* |
| Labour | 0.249 | 0.058* |
| Machine labour | -0.067 | 0.960 |
| Inefficiency factor | ||
| Intercept | 0.818 | 0.032** |
| Number of females | -0.050 | 0.007* |
| Education years | -0.314 | 0.007* |
| Family size | -0.035 | 0.005** |
| Area(ha) | 0.012 | 0.028** |
| Age | -0.119 | 0.028* |
| Children | -0.337 | 0.011** |
| Diagnostic factor | ||
| sigma square | 0.029 | 0.075* |
| gamma | 0.600 | 0.067* |
| Log likelihood function | 43.235 | |
*and ** denote significance at 0.05 and 0.01 level of significance
Determinants of Technical inefficiency model
Technical efficiency relates to the degree to which a farmer produces the maximum feasible output from a given bundle of inputs. The main aim of this analysis was to provide empirical evidence of inefficiency level among the farmers in the study area. The dependent variable of the model was farm in efficiency of the corresponding farm household and the independent variables are number of female, education years, family size, area(ha) children. In this analysis positive sign indicates that an increase in coefficient of the explanatory variable increases the level of inefficiency among the farmer and vice-versa while a negative sign indicates that as the value of the estimated coefficient increase the inefficiency level of farmer decrease and vice-versa. Estimates of socio-economic factors like number of female, education years, family size, children were the most influential determinants of technical inefficiency. The focus of this analysis was to provide a empirical evidence of the determinants of productivity variability/inefficiency gaps among smallholder wheat farmers in the study area. Results revealed that number of female, education years, family size and children decrease the technical inefficiency effect in wheat crop signifying that these variables play a positive role in increasing the efficiency level of farm household (Table 4). The estimated coefficient of technical inefficiency revealed that women play a negative and significant role in increasing the technical inefficiency of crop growing farmer which indicate that as the number of women/women participation increase in farm activities, their efficiency level increase and vice-versa. This finding is parallel with that of Rasheed and his associates14 where they found that women’s participation in agricultural activities reduced the inefficiency of farm by 47 per cent. As agriculture became more feminized in study area, it was found that women folk perform all on-farm activities except that of ploughing which ultimately increase the farm efficiency by devoting their maximum time in agriculture and allied activities. The cultivated area had a positive influence on increasing the inefficiency of all three crops which ultimately reduce the efficiency of farm households. Similar findings were observed by Bhatt and Bhat15on the negative effect of farm size on technical efficiency in Jammu and Kashmir. This is due to the reason that farmers with small farm use the land diligently which reduces the inefficiency level of farmers. When there will be small cultivated area, farmer use the resources in an efficient manner than the farmers with a larger farm size. With increase in number of education years technical inefficiency of farm household decreases and is significant at 0.05 and 0.01 level of significance. Positive and significant impact of education on technical efficiency verifies the importance of education in increasing the efficiency of a farm household. This is due to the fact that when farmers get more educated they get easily acquainted with new technology, proper knowledge about seed rate, application of required fertilizer dosage, using of high yielding varieties which ultimately increase farm efficiency level. As the age of respondents increases, technical efficiency increases, because the knowledge, experience and decision making capacity that the farmers gain over their farming years contribute in increasing technical efficiency. With the increase in family size, more number of farm labour workforce is available for farming activities thereby increasing the farm efficiency by fulfilling the shortage of labour at peak seasons like ploughing, sowing, weeding, harvesting etc. Analysis of technical efficiency of crop producing smallholder farmers in Tigray, Ethiopia by Shumet16 also revealed that an increase in age, education and family size increase the technical efficiency of farmers by increasing the farming experiences, decision making capacity and by the availability of more labour to timely undertake the necessary farming activities.
Estimation of Stochastic Frontier Profit Function
The maximum likelihood estimates of the parameter of stochastic frontier profit function presented in Table 5 revealed that the estimated coefficient of the variable seed cost, fertilizer, farmyard manure, labour and mechanization charge was negative for wheat crop. These results are consistent with Samarpitha and his associates17 where the coefficients ofhuman labour and fertilizer showed a significant negative effect on the profits in rice farms of Nalgonda district of Telangana stateand fertilizer cost and seed cost having a negative effect on profits obtained from the cultivation of `rice in Liberia as reported by Saysay and his co-authors18. The main reasons for poor profitability are due to the high cost of the input variables that are used in the cultivation. Injudicious use, mountain characteristics of the hilly area such as fragility, inaccessibility, etc. All these factors are the main reason for profit inefficiency which makes the crop less profitable and leads the household to vulnerable for shocks of poverty, uncertainty, etc. The value of sigma square was found to be significant suggesting the presence of economic inefficiencies. Values of gamma were highly significant depicting the existence of profit/economic inefficiency to the level of 89 per cent for wheat due to factors that are under farmer’s control and only 11 per cent of farmer’s inefficiencieswere due to random factors outside farmer’s control. Therefore to obtain an optimal level of profit, inefficiency should be minimized. The value of log- likelihood function gives the best fit to this stochastic frontier profit function.
Distribution of farmers under different levels of efficiencies
The technical efficiency ranges from 0-1, zero means a perfect level of inefficiency and 1 indicated the perfect level of technical efficiency. The mean technical efficiency found among the farmers was 86 per cent in wheat which in turn implies scope for increasing production on an average by 14 per cent in wheat, by using existing resources and level of technology (Table 5). In wheat, only about 8 per cent of farmers cross technical efficiencylevel of 90 per cent and more than 40 per cent have efficiency level less than 80 per cent of which indicate that there is the presence of technical inefficiency effect in wheat crop as mean technical efficiency is worked out to be less than 1 indicating a considerable amount of productivity loss due to inefficiency at farm level. This variation in TE is an indication that most of the farmers in the study area are using their resources inefficiently in the production
Table 5: Estimation of the stochastic frontier profit function
| Variables | Coefficient | Standard error |
| Profit factor | ||
| Intercept | 11.340 | 0.398** |
| Seed cost | -0.178 | 0.030* |
| Fertilizer cost | -0.627 | 0.021** |
| FYM cost | -0.444 | 0.031** |
| Labour charge | -0.450 | 0.019* |
| Mechanization charge | -0.079 | 0.027* |
| Diagnostic factor | ||
| sigma square | 0.027 | 0.004** |
| gamma | 0.890 | 0.064** |
| log likelihood Function | 19.40 | |
| Efficiency | Mean efficiency (%) | |
| Technical efficiency | 86 | |
| Allocative efficiency | 71 | |
| Economic efficiency | 83 | |
*and** denote significance at 5 % and 0.1% level of significance
process and their still exist opportunities for raising productivity of crops by improving the yield and also enhancing technical efficiency of farmers by following efficient management of crop practices without increasing the level of input. The mean economic efficiency was found 71 per cent in wheat indicating that in the short run, farmers on an average can decrease input costs by 29 per cent in wheat, respectively given the optimum level of output or in other words have the potential to further improve the economic efficiency by 29 per cent in wheat crop. Similarly, the mean allocative efficiency of crops in the study area was 83 per cent which indicates that the farmer could save upto 17 per cent of their current operational costs by behaving in a cost effective way. Results concluded that the efficiency level of all the three types of efficiencies i.e TE, EE and AE found less than 1 in wheat crops indicating that the potential for increasing the level of all the three types of efficiencies is wheat crop (fig 1, 2 and 3).
Distribution of sampled wheat farmers under different levels of technical efficiency.
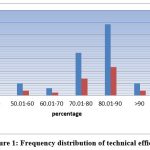 |
Figure 1: Frequency distribution of technical efficiency. |
Distribution of sampled wheat farmers under different levels of economic efficiency.
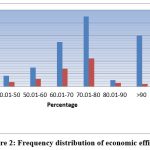 |
Figure 2: Frequency distribution of economic efficiency. |
Distribution of sample wheat farmers under different levels of Allocative efficiency.
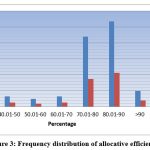 |
Figure 3: Frequency distribution of allocative efficiency. |
Conclusion
The present study reveals that wheat farmers are operated below the maximum possible frontier output and there were the presence of inefficiencies among the wheat farmer. The mean technical efficiency, economic efficiency and allocative efficiency of wheat growing farmers’ were found to be 86, 71 and 83 per cent respectively, indicating that there are still scope to improve all the three efficiencies by proper reallocating the resources in a more effective manner. To enhance the efficiency of farmers there is need to emphasize on the socio-economic factors which influence the same to a great extent. Since the education level of wheat growers and the number of women in a farm family significantly influence the efficiency, so proper training, knowledge of high yielding varieties and scientific package of practices related to the crop should be given as extension services through demonstration on farms. Growing wheat crop in mountainous region is always seen as less profitable due to injudicious use of input and also due to poor marketing value of output therefore government through development departments and research stations should make proper efforts in providing proper technical know-how and latest farming methods and input technologies to boost the resource use efficiency and productivity which has remained confined to plains only and also there is a dire need to grow high valued crops which could fetch a better market value for its produce. As the study area is dominating by marginal farmers, wheat growers should be supported in lowering their costs of production on per hectare basis so that it can help farmers in gain considerably higher profit. Majority of the intermediate zone is a rainfed area, and wheat is the only crop grown on a majority of hilly areas in Rabi season, so more focus should be brought towards rainfed technologies with more emphasis on integrated watershed development programs in a holistic approach.
Acknowledgement
Authors thank SAE&HBM, Dean of Faculty of Horticulture, Division of Agriculture and Statistics Wadura Sopore for their support and encouragement.
Author’s Contribution
Conceptualization of research, framing of sampling design, fitting of model, helping preparation of thesis (FAS SAW); Analysis of data and interpretation (FAS,FAW).
Conflict of Interest
The authors declare No conflict of interest.
Funding Sources
There is no funding source.
References
- Sharma S., Sehgal Trends in area, production and productivity of Wheat Crop in J&K India. Journal for Studies in Management and Planning, 2015; 1(6): 123.
- Available in, http://www.fao.org/ statistical database. 2019.
- Digest of Statistics. Directorate of Economics and Statistics, Government of Jammu and Kashmir. 2016.
- Coelil T.J. Recent developments in frontier modelling and efficiency measurement. Australian Journal of Agricultural Economics, 1995; 39(3): 219-245.
CrossRef - Coelli T., Prasada R., Battese G. An introduction to efficiency and productivity analysis : Kluwer Academic Press. Boston.1998.
CrossRef - Seyoum E.T., Battese G.E., Fleming E.M. Technical efficiency and productivity of maize producers in Eastern Ethiopia: a study of farmers within and outside the Sasakawa Global 2000 Project. Agricultural Economics. 1998; 19: 341–48.
CrossRef - Aigner D.J., Lovell C.A.K., Schmidt P. Formulation and estimation of stochastic frontier production functions models. Journal of Econometric.1977; 6(1): 21-37.
CrossRef - Ali M., Flinn J.C. Profit efficiency among basmati rice producers in Pakistan’s Punjab. Indian Journal of Agricultural Economics. 1989; 71(2): 303-310.
CrossRef - Kalirajan K.P., Shand R.T. A generalized measure of technical efficiency. Applied Economics. 1989; 21: 25-34.
CrossRef - Sharma V.P., Datta K.K. Technical efficiency in wheat production on reclaimed alkali soils. 1997; 38(2): 334.
- Rahman S. Profit efficiency among Bangladeshi rice farmers. Food Policy. 2003;28(5): 487-503.
CrossRef - Galawat F., Yabe M. Profit efficiency in rice production in Brunei Darussalam: a stochastic frontier approach. Journal of International Society for Southeast Asian Agricultural Sciences. 2012; 18(1): 100-112.
- Amaza P.S., Bila Y., Iheanacho A.C. Identification of factors that influence technical efficiency of food crop production in West Africa, empirical evidence from Borno State Nigeria. Journal of Agriculture and Rural Development in the Tropics and Subtropics. 2006; 107 (2): 139-147.
- Rasheed A., Mwalupaso G.E., Abbas Q., Tian X., Waseem R. Women participation: a productivity strategy in rice production. 2020; 12: 1-15.
CrossRef - Bhatt M.S., Bhat S.A. Technical efficiency and farm size productivity-micro level evidence from Jammu and Kashmir. International Journal of Food and Agricultural Economics. 2014; 2(4): 27-49.
- Shumet A. Analysis of technical efficiency of crop producing smallholder farmers in Tigray. MPRA Paper No. 40461. Ethiopia. (2011)
- Samarpitha A., Vasudev N, Sushasini K. Technical, economic and allocative efficiencies of rice farms in Nalgonda district of Telangana State. Economic Affair. 2016; 61(13): 365-374.
CrossRef - Saysay J.L., Gabagambi D.M., Mlay G.I. Profit efficiency among small holder rice farmers in Central Liberia. Journal of Economics and Sustainable Development. 2016; 7 (14).