

Introduction
Random Amplified Polymorphic DNA, a molecular method now available has been successfully applied to notice the genetic likenesses or variations in DNA in several plants 1,2. The supremacy of RAPD is that it is a speedymethod, facile to execute and relativelyinexpensive. It is proximately applied to the scrutiny of many organisms since universal primer sets are utilized without any necessity for earlier information about sequences3,4. Applications of RAPD involveDNA sequence polymorphismsdetection, mapping diversepopulations 5,6, markers isolation associated to different traits or particular targeted intervals 7,8 as well as implementationinparentage analysis andidentification of varieties9,10.
RAPD also allows evolutionary researchers to find the genetic characters of various species that areclosely related. The invention of the RAPD methodhad a keyinfluence on the investigation of the genomesin eukaryotes and backed to the development of several DNA markers. RAPDs are predominantlybeneficial to analyse the gene structure of populations as they disclose polymorphisms in non-coding areas of the genetic material11.
The typical RAPD technology uses short synthetic oligonucleotides generally 10 bases lengthy of arbitrary sequences as primers with low annealing temperatures to amplify nanogram quantities of total genomic DNA using PCR 12. RAPD markers distinctive to organisms from one species in a genus are species-specific13. Identification of hybrid populations is possible by choosing population-specific markers 14.
The dissimilarity coefficients between species could be analysed and clustering can be carried out using unweighted pair group method and arithmetic average. The UPGMA dendrogram is constructed with dissimilarity matrix to reveal the degree of fit with the cophenetic correlation values. Dendograms can clutch the accessions of species into groups based on their eco-geographical regions that provide beneficial insights into their phylogenetic relationships 15. Phylogenetic relationships can also be evaluated by Principal Component Analysis (PCoA) which explains the percentage of cumulative variance among species. The 2DPCoA analysis demonstrates grouping of the diverse accessions signifyingthe clustering of accessions 15.
The current study was designed to compare the biometric morphological data among the five Amaranthus viridis L.accessions from selected regions of Western Ghats in Tamilnadu and Kerala, to isolate genomic DNA and finger print the five A. viridis accessions using three RAPD markers, to calculate the percentage polymorphism, effective multiplex ration, polymorphism information content, marker index and resolving power after data scoring, to construct UPGMA dendrogram using Jaccard’s coefficient and compare the genomic profiles of A. viridis accessions, to find the similarity matrix on the basis of RAPD data among 5 A. viridis accessions and to perform 3D Principal Component Analysis (PCoA) for genetic relatedness among the five A. viridis accessions.
Materials and methods
Collection of plants
The five accessions of Amaranthus viridis L. (SH1431, SH1432, SH1433, SH1434, SH1435) used in the current study were collected from selected regions of Western Ghats in Tamilnadu (ChunkanKadai and Kaliakkavilai) and Kerala(Neyyatintakra, Maruthoor, M.C. Road) (Figure 1) during the month of December, 2018.
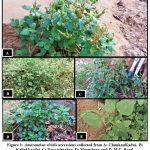 |
Figure 1: Amaranthus viridis accessions collected from A: ChunkanKadai, B: Kaliakkavilai, C: Neyyatintakra, D: Maruthoor and E: M.C. Road. |
The accessions were authenticated and deposited in the Sundaranar Herbarium, Manonmaniam Sundaranar University, Tirunelveli, Tamilnadu, India. The accessions were mapped representing their geographical distribution in Western Ghats of Tamilnadu, India using GoogleMyMaps (Figure 2).
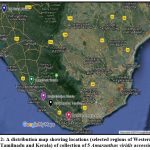 |
Figure 2: A distribution map showing locations (selected regions of Western Ghats in Tamil nadu and Kerala) of collection of 5 Amaranthus viridis accessions. |
The details of the latitude and longitude of the accessions collection sites and the names of the places along with the districts and state names from where the accessions where collected is represented in Table 1.
Table 1: Accession number, Collection location and geographic coordinates of Amaranthus viridis accessions used in the current study.
| Acc. No. | Code | State | District | Place | Latitude | Longitude | Soil type | pH of soil |
| SH
1431 |
AVCHTN | Tamil
Nadu |
Kanyakumari | ChunkanKadai | 8.1993oN | 77.3870oE | red loamy | 6.5 |
| SH
1432 |
AVKATN | Tamil
Nadu |
Kanyakumari | Kaliakkavilai | 8.3318oN | 77.1744oE | loamy clay | 7.5 |
| SH
1433 |
AVNEK | Kerala | Thiruvanantha-puram | Neyyatintakra | 8.4016oN | 77.0871oE | sandy loam | 6.5 |
| SH
1434 |
AVTHK | Kerala | Thiruvanantha-puram | Maruthoor | 8.5724oN | 76.9451oE | brown loam | 7 |
| SH
1435 |
AVKOK | Kerala | Kollam | MC Road | 8.7695oN | 76.8828oE | laterite soil | 7 |
Biometric observations
For the analysisof morphology, 3 plants from every accession were analysed and the data were recorded during collection for three morphometric traits as per the procedure followed by 16: height of the plants, length of leaf blade and width of leaf blade. The type of soil at the collection site was observed during collection and its pH (1g of soil dissolved in 100mL distilled water) was also measured. The local name of the accessions were enquired to the people in the collection site and noted.
Finger printing of Amaranthus viridis L. accessions using RAPD markers
Genomic DNA Isolation
The genomic DNA from leaf samples was isolated using CTAB method 17.
Quantification of DNA and purity assessment
The yield of DNA per gram of fresh leaves was found using aultraviolet–visible spectrophotometer at 260nm and 280nm. The purity of DNA was determined by calculating the ratio of absorbance at 260nm-280nm. The purity and concentration of DNA was also checked by analysing the isolated DNA samples on 1% agarose gel.
Primers used
Three primers were utilized for RAPD study of the five accessions of A. viridis included Primer1: 5′-CCCAGCAACTGATCGCACAC-3′, Primer2: 5′-AGGACTCGATAACAGAC-3′ and Primer3: 5′-ATGTAAGCTCCTGGGGATTCAC-3′(Operon Technologies, Inc., USA).
PCR amplification
Each reaction mixture (25µl) for PCR amplification consisted Template (50ngDNA)-1µL; Primer(100ng/μl)-2.0μl; 10XAssay Buffer-2.5μl; dNTPs(10mM)-1.0μl; TaqPol(3U/μl)-0.5μl; Water-18.0μl. The Thermocycler was automated for aprimary denaturation process of five minutes at 94°C, then forty cycles of one minute at 94°C, annealing for forty five seconds at 37°C, extension process was at 72°C for two minutes and last extension at 72°C for five minutes. The hold temperature was at 4°C. Amplified DNA was loaded onto 1% agarose gel and tinged with ethidium bromide.
Data Scoring
Clear-cut polymorphic bands clearly resolved, were scored apparently for their occurrence or nonappearance with each primer. The scores were obtained in the form of a matrix with ‘1’ and ‘0’, which specify the presence and absence of bands.
Calculation of percentage polymorphism, polymorphism information content (PIC),effective multiplex ration (EMR), resolving power (RP) and marker index (MI)
Percentage polymorphism
The percentage polymorphism among different accessions with a primer was estimated by the formula[18]
Percentage polymorphism=(No. of Polymorphic band/Total no. of bands) × 100
Effective multiplex ratio (EMR)
EMR was calculated by the formula18
EMR=np(np/n)
np=No. of polymorphic bands
n=Total No. of bands
Polymorphism information content (PIC)
The PIC value for each primer was calculated as proposed by 19
PIC = 1–[f2 +(1–f)2]
Where f=No. of bands present
No. of bands absent + No. of bands present
Marker index (MI)
MI was found using the formula20
MI= PIC×EMR
Primer Resolving Power (Rp)
Rp was estimatedby the21 formula:
Rp = ΣIbi
whereIbi =1–[2|0.5–p|]
Where, ‘p’ is the fraction of accessions with the ith band and Ibi is the informativeness of the ith band.
Construction UPGMA dendrogram using Jaccard’s coefficient
The genetic relativeness was measured by computing the Jaccard index for pairwise comparisons on the basis of proportions of shared bands produced by the 3 primers. Similarity matrix, similarity coefficients, cluster analysis and dendrogramwas created using NTSYSpc.2.017,UPGMA and SHAN programs.
Dendrogram drawing and Clustering Analysis
For dendrogram drawing, in “Clustering” tab, input .NTS file. The name and path of output file in the field “Output file” was specified. The desired method for clustering from the “Clustering method” part was selected as UPGMA. The find option under the field ‘in case of ties’ part was clicked. ‘Tie tolerance’ and ‘beta’ fields were unchanged. ‘Compute’ toolbar was clicked. ‘Report listing’ window was closed once the procedure was successful. “Pot tree” toolbar was clicked. A dendogram was displayed.
Genetic similarity
The similarity index between species was found using the protocol of 22. Genetic similarity between individuals X and Y was calculated using the formula:
SXY = 2NXY / (NX + NY)
Where, SXY = rate of band sharing
NX= No. of bands in individual 1
NY = No. of bands in individual 2
NXY = total number of bands shared by both 1 and 2 individual
Principal Component Analysis
In NTSYSpc, Similarity left menu was selected and Qualitative Data and J (J = Jaccard’s coefficient) was chosen for Coefficient. Output file was saved as type .NTS, Positive (= 1.00000) and Negative (=0.00000) codes were set as default.
Statistical analysis
Variability of the data was represented as the mean ± standard error (SE), where n=3. Data were examined using the one way ANOVA(analysis of variance)to identify significant differences between means. Duncan’s test was used to compare the means than differed significantly using at p<0.05 probability level with SPSS software.
Results
Biometric observations
The five accessions of Amaranthus viridis L. (AVCHTN, AVKATN, AVNEK, AVTHK, AVKOK) tested for their variation in the height of plant, length of leaf blade, width of leaf blade, the soil type in which they were cultivated and difference in pH of the soil is represented in Table 2.
Table 2: Local names and morphological data of Amaranthus viridis accessions and their soil types.
| A. viridis
accession |
Local name | Height of Plant(cm) (mean+SE) | Length ofleaf blade (cm)
(mean+SE) |
Width of leaf blade (cm)
(mean+SE) |
| AVCHTN | Kuppaikeerai | 65.33+0.88b | 5.93+0.20a | 4.2+0.12a |
| AVKATN | Kuppaikeerai | 54.67+0.88a | 6.27+0.22ab | 5.4+0.31a |
| AVNEK | Kuppacheera | 82+1.15c | 8+0.06c | 5.33+0.74a |
| AVTHK | Kuppacheera | 86.33+0.88d | 8.23+0.23c | 5.5+0.68a |
| AVKOK | Kuppacheera | 54+0.58a | 6.67+0.15b | 5.27+0.14a |
Values trailed by the same letter (a, b, c, d) are not significantly different (p < 0.05) by Duncan’s multiple
range test.
Plant height
The plant heights of the 5 accessions used in the current study ranged from 54+0.58cm (AVKOK) to 86.33+0.88cm (AVTHK).
Leaf blade length
The largest leaf blade length (8.23+0.23cm) was observed in AVTHK and the smallest leaf blade length (5.93+0.20cm) was observed in AVCHTN.
Leaf blade width
The leaf blade width was maximum (5.5+0.68cm) in the accession AVTHK and the accession AVCHTN had minimum (4.2+0.12cm) blade width.
Soil type
Different accessions of A.viridis was found to grow in different types of soil types red, brown laterite, while majority of them among the accessions were reported to exist in loamy soil type.
pH of soil
The pH of the soil where the accessions collected where mostly found to occur close to the neutral pH from the range 6.5-7.5.
Genomic DNA Isolation, quantification and quality assessment
Samples of DNA were measured usingUV-VIS spectroscopyat 260nm.The 260/280 ratio ranged from 1.6 to 1.72 which were less than 1.8 for all the accessions reflecting high purity DNA. The whole DNA isolated from the garden-fresh Amaranthus viridis accessions leaves were quantified by means of agarose gel electrophoresis (1%) and resulted in, high molecular weight,good quality DNA.
Finger printing of Amaranthus viridis L. accessions using RAPD markers
The three RAPD markers used in the current research to detect the genetic relationship generated amplification products (Figure 3). Polymorphic bands percentage was from 44.44% to 80.77%. The primer with maximum number of polymorphic bands was Primer3 (21alleles). ‘1’ and ‘0’,specifies if bands were present and absent (Table 3).
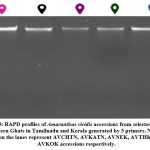 |
Figure 3: RAPD profiles of Amaranthus viridis accessions from selected regions of Western Ghats in Tamilnadu and Kerala generated by 3 primers. Numbers 1-5 on the lanes represent AVCHTN, AVKATN, AVNEK, AVTHK and AVKOK accessions respectively. |
The three RAPD primers produced 66 bands totally among that 46 bands were polymorphic with bands numbers between 8 and 21, with an average of 15.33 bands per primer (Table 4).
Table 3: Data scoring of RAPD gel using three primers in the five A. viridis accessions
| Primer1 | ||||||
| Base pairs | Acc1 | Acc2 | Acc3 | Acc4 | Acc5 | Mono/polymorphic |
| 4000 | 1 | 0 | 0 | 0 | 0 | Poly/unique |
| 2500 | 1 | 1 | 1 | 1 | 1 | mono |
| 2000 | 1 | 0 | 0 | 0 | 0 | Poly/unique |
| 1750 | 1 | 1 | 1 | 1 | 1 | mono |
| 1500 | 1 | 1 | 1 | 0 | 1 | poly |
| 1300 | 1 | 0 | 0 | 0 | 0 | Poly/unique |
| 1150 | 0 | 0 | 0 | 0 | 1 | Poly/unique |
| Primer2 | ||||||
| Base pairs | Acc1 | Acc2 | Acc3 | Acc4 | Acc5 | Mono/polymorphic |
| 750 | 1 | 0 | 0 | 0 | 0 | Poly/unique |
| 650 | 1 | 0 | 0 | 0 | 0 | Poly/unique |
| 500 | 1 | 1 | 1 | 1 | 1 | mono |
| 400 | 0 | 0 | 0 | 0 | 1 | Poly/unique |
| 375 | 1 | 0 | 0 | 0 | 0 | Poly/unique |
| 300 | 0 | 0 | 0 | 1 | 1 | Poly |
| 275 | 1 | 1 | 1 | 0 | 0 | poly |
| 175 | 0 | 1 | 1 | 1 | 1 | poly |
| <100 | 0 | 1 | 1 | 1 | 1 | poly |
| Primer3 | ||||||
| 1750 | 0 | 0 | 0 | 1 | 1 | poly |
| 1500 | 1 | 1 | 1 | 0 | 0 | poly |
| 1250 | 1 | 0 | 0 | 1 | 1 | poly |
| 800 | 1 | 1 | 1 | 1 | 1 | mono |
| 700 | 1 | 0 | 0 | 1 | 1 | poly |
| 650 | 1 | 1 | 1 | 0 | 0 | poly |
| 550 | 1 | 1 | 1 | 0 | 0 | poly |
| 200 | 1 | 0 | 1 | 1 | 1 | poly |
Table 4: Details of primers, polymorphism information content (PIC), effective multiplex ration (EMR), percentage polymorphism, , marker index (MI) and resolving power (RP) in Amaranthus viridis accessions.
| Primer | Sequence
(5′-3′) |
GC content (%) | Mono-
morphic bands |
Poly- morphic bands | Percentage
Polymorphism (%) |
EMR | PIC | MI | RP |
| Primer1 | 5′-CCCAGCAACT
GATCGCACAC-3′ |
60 | 10 | 8 | 44.44 | 3.56 | 0.5 | 1.78 | 6.66 |
| Primer2 | 5′-AGGACTCGAT
AACAGAC-3′ |
47.06 | 5 | 17 | 77.27 | 13.14 | 0.5 | 6.57 | 7.72 |
| Primer3 | 5′-ATGTAAGCTCC
TGGGGATTCAC-3′ |
50 | 5 | 21 | 80.77 | 17.01 | 0.46 | 7.82 | 9.86 |
| Average | 52.35 | 6.67 | 15.33 | 67.49 | 11.24 | 0.49 | 5.39 | 8.08 |
Calculation of percentage polymorphism, polymorphism information content (PIC), effective multiplex ration (EMR), marker index (MI) and resolving power (RP)
Effective multiplex ratio
EMR for 66 bands was from 3.56 to 17.01 with a mean of 11.24 per primer. The peak value was observed with the primer3 and the lowest value for the primer1.
Polymorphism Information Content
The PIC scores for polymorphic locifluctuated from 0.46 to 0.5, with a mean value of 0.49 per primer. The maximum PIC score was found for the primers1 and 2 and the lowest for the primer3.
Marker Index
The marker index value oscillated from 1.78 to 7.82 with a mean valueof 5.39 perprimer grouping. The peak score (7.82) was found for the primer3and the lowest for the primer1.
Resolving Power
The RP valueswerefrom 6.66 to 9.86 with a mean of 8.08 per primer blend. The maximum value (9.86) was observed for the primer3 and the lowest for the primer1. The details of primers, polymorphism information content (PIC), resolving power (RP),percentage polymorphism, effective multiplex ration (EMR) andmarker index (MI) in A.viridis accessions is listed in Table 4.
Construction UPGMA dendrogram using Jaccard’s coefficient
The UPGMA dendrogram comparing the genomic profiles of the 5 Amaranthus viridis accessions in selected regions of Western Ghats in Tamilnadu and Kerala using Jaccard’s coefficient is shown in Figure 4.
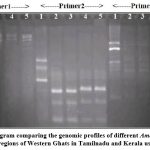 |
Figure 4: UPGMA dendrogram comparing the genomic profiles of different Amaranthus viridis accessions collected from selected regions of Western Ghats in Tamilnadu and Kerala using Jaccard coefficient. |
A UPGMA dendrogram showed peak Jaccard’s coefficient value of 0.96 between AVKATN and AVNEK, indicating the highest genetic similarity and least value(0.58) was noticed between AVCHTN with the rest. A value of 0.87 was found between AVTHK and AVKOK. Clusters analysis exposed the establishment of one major cluster (1) and two sub clusters (1B and 1A). Cluster 1A includes AVKATN and AVNEK while cluster 1B includes AVTHK and AVKOK.
Genetic similarity
Following the method of Nei & Li (1979) the similarity index values calculated pair-wise among the 5 accessions are shown in Table 5. The similarity coefficients lied between 0.4828 and0.9565. Among the 5 varieties, the maximum similarity index (0.9565) was found among AVKATN and AVNEK, least value (0.4828) was observed among AVCHTN and AVTHK.
Table 5: Genetic similarity matrix constructed on RAPD analysis of 5 Amaranthus viridis populations in selected regions of Western Ghats using Nei and Li’s formula.
| AVCHTN | AVKATN | AVNEK | AVTHK | AVKOK | |
| AVCHTN | 1 | ||||
| AVKATN | 0.6207 | 1 | |||
| AVNEK | 0.6667 | 0.9565 | 1 | ||
| AVTHK | 0.4828 | 0.5455 | 0.6087 | 1 | |
| AVKOK | 0.5 | 0.56 | 0.6154 | 0.88 | 1 |
Principal Component Analysis
For the ease of interpretation, the genetic similarity values between pairs of genotypes in RAPD were subjected to principal component analysis (PCoA) to obtain 3D graphical representations between the 5 genotypes. Three-dimensional representation using Principal Component Analysis (PCoA) for genetic relatedness among 5 Amaranthus viridis accessions were clubbed into three individualsets(Figure 5). In thesecombinations, all accessions from tamilnadu were allotted to group I. Group II involved of only AVTHK and Group III consisted of only AVKOK.
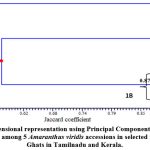 |
Figure 5: Three-dimensional representation using Principal Component Analysis (PCoA) for genetic relatedness among 5 Amaranthus viridis accessions in selected regions of Western Ghats in Tamilnadu and Kerala. |
Discussion
In the current study, the five accessions of Amaranthus viridis L. (AVCHTN, AVKATN, AVNEK, AVTHK, AVKOK) collected from selected regions of Western Ghats in Tamilnadu (ChunkanKadai and Kaliakkavilai) and Kerala (Neyyatintakra, Maruthoor, M.C. Road) varied in their plant height (54+0.58cm to 86.33+0.88cm), leaf blade length (5.93+0.20cm to 8.23+0.23cm), leaf blade width(4.2+0.12cm to 5.5+0.68cm), the soil type in which they were cultivated and difference in pH of the soil (6.5-7.5). [23]observed that A. viridis in Africa consisted of petiole that is upto 10cm long.
In this study, we have also analysed the finger printing of five Amaranthus viridis L. accessions using RAPD markers to evaluate their genetic diversity. Also, investigation by24 using random amplified polymorphic DNA (RAPD) marker indicated the genetic diversity and relationships among 6 Amaranthus species from 8 phytogeographic regions of the Indo-Gangetic plains. RAPD primers yielded a total of 262 amplicons, of which 254 amplicons(96.94%) were polymorphic. Description of grain Amaranth germplasm using RAPD analysis in south west Nigeria has been described previously by25. In a recent study, 26 have performed marker assisted genetic diversity studies.
In the current study, the percentage polymorphism, polymorphism information content (PIC),effective multiplex ration (EMR), resolving power (RP) and marker index (MI) calculated whereEMR for 66 polymorphic loci ranged between 3.56 and 17.01, PIC values ranged from 0.46 and 0.5, the MI oscillated from 1.78 to 7.82 and the RP range was between 6.66 to 9.86. A similar study on nuclear polymorphism was done by 13 in Colletotrichum gloeosorioides isolates of mango. According to a study by 27, the PIC index existed from 0.19-0.81 Effective Multiplex Ratio (EMR) of the primers ranged from 0.5-7.0 with a mean value of 2.47.
In the current research, the UPGMA dendrogram comparing the genomic profiles of the 5 Amaranthus viridis accessions in selected regions of Western Ghats in Tamilnadu and Kerala where the peak value observed was 0.96 between AVKATN and AVNEK, indicating the highest genetic similarity. Cluster 1A included AVKATN and AVNEK while cluster 1B included AVTHK and AVKOK. Previously28 have assessed the molecular diversity in Amaranthus spp.29 had reported genetic relationship among 8 Amaranthus palmeri inhabitants.
Our further experiments revealed the Jaccard Similarity values achieved comparison of every pair wise among the 5 varieties of A.viridis where the similarity coefficients analysed using 3 RAPD markers extendedbetween0.4828 and0.9565. Amongst the 5 selections the peak similarity index (0.9565) was witnessed between AVKATN and AVNEK and the least similarity index (0.4828) was detected between AVCHTN and AVTHK. It has been earlier established by 24 that disparityoccurred in the genomics of Amaranthus populations in the Indo-Gangetic grasslands.25characterized grain Amaranth germplasm based on their physical, dietary, as well as RAPD analysis.
In this study, we have also analyzed the genetic similarity values for RAPD between pairs of genotypes by subjecting to principal component analysis (PCoA) to obtain 3D graphical representations between the 5 genotypes for ease of interpretation.30 has already described the PCoAof physical characteristics in 36variationsto differentiate the diversity by GBS.
Conclusion
Upon finger printing of five Amaranthus viridis L. accessions in selected regions of Western Ghats in Tamilnadu and Kerala, using three RAPD markers to evaluate their genetic diversity, several polymorphic bands which ranged up to 80.77% has proved their genetic variations. Also, the UPGMA dendrogram comparing the genomic profiles of the five A. viridis accessions using Jaccard coefficient has revealed AVKATN and AVNEK had the highest their genetic distances, whereas AVKATN and AVNEK were genetically similar among the 5 varieties. An enhanced understanding of genetic diversity among plant species and its distribution is vital for its protection and potential use. Other molecular diversity analysis studies may use RFLPs, AFLPs or SSRs.
Acknowledgement
We are grateful to Dr. P. Ravichandran, Head of the Department of Plant Sciences in Manonmaniam Sundaranar University, Tamilnadu, India for authentication of the accessions. I am also thankful to the staff members of Biotechnology Department, Malankara Catholic College for theirencouragement throughout this work. We are alsothankful to Rev. Fr. Jose Bright, Correspondent/Secretary and Dr. J. Thampi Thanka Kumaran, Principal, Malankara Catholic College, Mariagiri for their constant encouragement and support.
Conflict of Interest
The authors have no conflict of interest.
References
- Carvalho L. C., Goulao L., Oliveira C., Goncalves J. C., Amancio S. RAPD Assessment for identification of clonal identity and genetic stability of invitroropagated chestnut hybrid. Plant Cell Tissue and Organ Culture. 2004;77(1):23-27.
CrossRef - Martins M., Sarmento D., Oliveira M. M. Genetic stability of micropropagated almond plantlets, as assessed by RAPD and ISSR markers. Plant Cell Reports. 2004;23(7):92-496.
CrossRef - Bardakci F., Skibinski D. O. F. Applications of the RAPD technique in tilapia fish: species and subspecies identification. Heredity. 1994;73:117-123.
CrossRef - Callejas S., Gutiérrez J. C. A simple and rapid PCRbased method to isolate complete small macronuclearminichromosomes from hypotrich ciliates: 5S rDNA and S26 ribosomal protein gene of Oxytricha (Sterkiella) nova. Protist. 2002;153(2):133-142.
CrossRef - Carlson J. E., Tulsieram L. K., Glubitz J. C., Luk V. W. K., Kuffeldt C., Tutledge R. Segregation and random amplified DNA markers in F1 progeny of conifers. Theoretical and Applied Genetics. 1991;83:194–200.
CrossRef - Reiter R. S., Williams J. G. K., Feldmann K. A., Rafalski, J. A., Tingey S. V., ScolnikP. A. Global and Local genomic mapping in Arabidopsis thaliana by using recombinant inbred lines and RAPDs. Proceedings of the National Academy of sciences of the united states of America. 1992;89:1477- 1481.
CrossRef - Giovannoni J. J, Wing RA, Ganal MW, Tanksely S. Isolation of molecular markers from specific chromosomal intervals using DNA pools from existing mapping populations. Nucleic Acid Research. 1991;19:6553-6558.
CrossRef - Michelmore R. W., Paran I., Kesseli R. V. Identification of markers linked to disease-resistance genes by bulked segregant analysis: a rapid method to detect markers in specific genomic regions by using segregating populations. PNAS. 1991;88(1):9828-9832.
CrossRef - Tinker N. A., Fortin M. G., Mather D. E. Random amplified polymorphic DNA and pedigree relationships in spring barley. Theoretical and Applied Genetics. 199;85:976–984.
CrossRef - Mailer R. J., Scarth R., Fristensky B. Discrimination among cultivars of rapeseed (Brassica napus L.). Theoretical and Applied Genetics. 1994;87:697–704. doi: 10.1007/BF00222895
CrossRef - Lymanskaya S. V. Estimation of the genetic variability of an amaranth collection (Amaranthus L.) by RAPD analysis. Cytology and Genetics. 2012;46(4):210-216.
CrossRef - Shikano T., Taniguchi N. Using microsatellite and RAPD markers to estimate the amount of heterosis in various strain combinations in the guppy Poeciliareticulata as a fish model. Aquaculture. 2002;204:271-281.
CrossRef - Sornakili A., Rathinam P. K., Thiruvengadum R., Kuppusamy P. Comparative Assessment of RAPD and ISSR Markers to Study Genetic Polymorphism in Colletotrichumgloeosorioides Isolates of Mango. Asian Journal of Plant Pathology. 2017;11:130-138.
CrossRef - Hadrys H., Balick M., Schierwater B. Applications of random amplified polymorphic DNA (RAPD) in molecular ecology. Molecular Ecology. 1992;1:55-63.
CrossRef - Grewal AS, Sharma N, Singh S, Arora SA. Molecular Docking Studies of Phenolic Compounds from Syzygiumcumini with Multiple Targets of Type 2 Diabetes. Journal of Pharmaceutical Technology, Research and Management. 2018;6(2):123-131.
CrossRef - Eid M. RAPD Fingerprinting and Genetic Relationships of Some Wheat Genotypes. International Journal of Genetics and Genomics. 2019;7(1):1-11.
CrossRef - Doyle J. J., Doyle J. J. Isolation of plant DNA from fresh tissue. Focus. 1990;12:13-15.
CrossRef - Avendaño R., GarcíaDíaz E., Valdez-Melara M., ChavesSolano N., Mora Villalobos A., Aguilar Cascante F., Williamson Benavides B., Solís-Ramos L. Genetic diversity analysis of Jatropha species from Costa Rica using AFLP markers. American Journal of Plant Sciences. 2015;6:2426–2438.
CrossRef - Avadhani M. N. M. A, Selvaraj I., Rajasekharan P. E., Rao V. K., Munirajappa H., Tharachand C. Genetic diversity analysis and chemical profiling of Indian Acoruscalamus accessions from South and North-East India. Indian Journal of Biotechnology. 2016;15:560-567.
- Varshney R. K., Chabane K., Hendre P. S., Aggarwal R. K., Graner A. Comparative assessment of EST-SSR, EST-SNP and AFLP markers for evaluation of genetic diversity and conservation of genetic resources using wild, cultivated and elite barleys. Plant Science. 2007;173(6):638–649.
CrossRef - Prevost A., Wilkinson M. J. A new system of comparing PCR primers applied to ISSR fingerprinting of potato cultivars. Theoretical and Applied Genetics. 1999;98:668.
CrossRef - Nei M., Li W. H. Mathematical model for studying genetic variation in terms of restriction endonucleases. Proceedings of the National Academy of Sciences of the United States of America. 1979;76:5269-5373.
CrossRef - Reyad-ul-Ferdous M., Shahjahan D. M., Tanvir S., Mukti M. Present Biological Status of Potential Medicinal Plant of Amaranthusviridis: A Comprehensive Review. American Journal of Clinical and Experimental Medicine. 2015;3(5-1):12-17.
CrossRef - Ray T., Roy S. C. Genetic Diversity of Amaranthus Species from the Indo-Gangetic Plains Revealed by RAPD Analysis Leading to the Development of Ecotype-Specific SCAR Marker. Journal of Heredity. 2009;100(3):338–347.
CrossRef - Akin-Idowu, P. E., Gbadegesin, M. A., Orkpeh, U., Ibitoye, D. O., Odunola, O. A. 2016, Characterization of Grain Amaranth (Amaranthus spp.) Germplasm in South West Nigeria Using Morphological, Nutritional, and Random Amplified Polymorphic DNA (RAPD) Analysis Resources, vol. 6, no. 6, pp. 1-15.
CrossRef - Pandey V. R., Jatt B. L., Pandey R. Marker assisted genetic diversity among Amaranthus Species through RAPD. Journal of Pharmacognosy and Phytochemistry. 2019;8(3):83-89.
- Srivastava S., Pathak A. D. Molecular diversity and genetic relatedness of some top borer tolerant sugarcane genotypes. Indian Journal of Sugarcane Technology. 2017;32(2):84-89.
- Anjali K., Joshi A., Maloo S. R, Sharma R. Assessment of the morphological and molecular diversity in Amaranthus spp. African Journal of Agricultural Research,. 2013;8(19):2307-2311.
CrossRef - Küpper A., Manmathan H. K., Giacomini D., Patterson E. L, McCloskey W. B, Gaines T. A. Population Genetic Structure in Glyphosate-Resistant and -Susceptible Palmer Amaranth (Amaranthuspalmeri) Populations Using Genotyping-by-sequencing (GBS). Frontiers in Plant Science. 2018;1.
CrossRef - Hailu A. F. Principal Component Analysis of Morphological Traits in Thirty-Six Accessions of Amaranths (Amaranthus Spp.) Grown in a Rainfed under MizanandTepeCondtions, South West Ethiopia. Journal of Biology, Agriculture and Healthcare. 2016; 6 (1):113.
- Wu X., Blair M. W. Diversity in Grain Amaranths and Relatives Distinguished by Genotyping by Sequencing (GBS). Frontiers in Plant Science. 2017;8:1960.
CrossRef