
Introduction
Agriculture is a primary and most important sector of India as it is crucial for ensuring food, nutrition, and livelihood security at the same time it engages more than two-third of the workforce through direct or indirect employment. It also contributes considerably to the country’s Gross Domestic Product. In the last few decades, this sector has witnessed unprecedented growth due to the effect of the green revolution, high-yield varieties, use of chemical fertilizers and pesticides, improved farming practices, and various technological advancements in this field but Indian agriculture has always been affected by extreme, erratic and irrepressible climate. Many studies have pointed out that various weather variables significantly affect crop yield. In such a situation, it is imperative to have prior knowledge of climate behavior and its consequences on crop yields for better predicting the yield for farmers, policymakers, economists, and the government at large.
Crop yield forecasting is a critical task in agricultural management, providing valuable insights for planning and decision-making. In semi-arid regions such as the 3A Zone in Rajasthan, India, where agriculture heavily relies on rainfed conditions, accurate predictions of crop yields become even more crucial due to the high variability and limited availability of water resources. In recent years, the application of machine learning techniques has shown promising results in crop yield forecasting. Machine learning algorithms, such as Random Forest, Support Vector Machines, and Artificial Neural Networks, have been applied to analyze historical data on weather variables, soil characteristics, and crop growth parameters to predict crop yields. These models capture complex relationships and patterns within the data, enabling more accurate and timely predictions. Additionally, the incorporation of remote sensing data and satellite imagery further enhances the accuracy and spatial resolution of crop yield forecasts.
In the context of Rajasthan, the application of Machine Learning in crop yield forecasting has the potential to provide valuable insights into the complex relationships between climatic variables and crop yields. By leveraging historical crop yield and agrometeorological data, the Random Forest algorithm can improve the accuracy of crop yield predictions, ultimately benefiting farmers, policymakers, and researchers in the region. Scientific literature provides a range of recommendations on the use of Random Forest for crop yield prediction. One key recommendation is the selection of appropriate input variables for the model. Researchers have found that the inclusion of irrelevant or redundant variables can negatively affect the accuracy of the model. Hence, it is recommended to select only those variables that have a significant impact on crop yield.1 Another recommendation is to carefully tune the hyperparameters of the algorithm to optimize the model’s performance. For example, researchers have found that the number of trees in the forest and the maximum depth of the trees can significantly impact the accuracy of the model.2
Importance of Accurate Crop Yield Prediction
Accurate crop yield prediction plays a crucial role in agricultural planning, decision-making, and policy formulation. It provides valuable insights into future crop production, helping farmers, policymakers, and stakeholders make informed choices. Here are some key reasons highlighting the importance of accurate crop yield prediction:
Optimizing resource allocation: Accurate crop yield prediction enables farmers to optimize the allocation of resources such as seeds, fertilizers, water, and pesticides. By knowing the expected yield, farmers can determine the optimal quantity of resources required for cultivation, minimizing waste and reducing production costs.3
Improving market planning: Accurate crop yield prediction helps in market planning by providing insights into the expected supply of agricultural commodities. This information is crucial for traders, processors, and policymakers to anticipate market fluctuations, stabilize prices, and ensure a smooth supply chain.3
Risk management and insurance: Crop yield prediction plays a vital role in risk management and insurance schemes. Accurate predictions help farmers and insurers assess the potential risks associated with weather events, pests, diseases, and market fluctuations. It allows farmers to make informed decisions regarding crop insurance coverage, reducing financial losses in case of adverse events.4
Food security and policy planning: Accurate crop yield prediction contributes to food security planning and policymaking at the national and regional levels. It helps governments and policymakers assess the adequacy of food supply, plan import-export strategies, and implement appropriate agricultural policies to ensure food availability and affordability.3
Climate change adaptation: With climate change affecting weather patterns and agricultural productivity, accurate crop yield prediction becomes even more critical. It helps farmers and researchers understand the impact of climate change on crop growth and productivity, enabling them to develop adaptive strategies and implement climate-resilient practices.4
There are various statistical and machine learning algorithms that have been applied for crop yield forecasting. These algorithms aim to capture the relationships between weather variables, soil conditions, and other relevant factors to predict crop yields. Here’s a table summarizing popular statistical and machine learning algorithms for crop yield predictions, along with their techniques, strengths, and limitations:
Table 1: Popular Statistical and Machine Learning algorithms
| Algorithm | Technique | Strengths | Limitations |
| Multiple Linear Regression | Statistical modeling | Interpretable, handles linear relationships well | Assumes linear relationships, may not capture nonlinear patterns |
| Support Vector Regression (SVR) | Statistical modeling and machine learning | Effective for small datasets, handles nonlinear relationships | Sensitive to hyperparameter tuning, may require feature scaling |
| Decision Trees | Machine learning | Interpretable, handles both categorical and numerical features | Prone to overfitting, lack of robustness against small variations in data |
| Random Forest | Machine learning | Handles high-dimensional data, robust against overfitting | Black-box model, lack of interpretability |
| Gradient Boosting | Machine learning | Powerful ensemble method, captures complex relationships | Sensitive to noise and outliers, computationally expensive |
| K-Nearest Neighbors (KNN) | Instance-based learning | Simple implementation, captures local patterns | Computationally expensive for large datasets, requires proper feature scaling |
| Artificial Neural Networks (ANN) | Deep learning | Can capture complex relationships, suitable for large datasets | Computationally expensive, requires extensive tuning of architecture and hyperparameters |
| Long Short-Term Memory (LSTM) | Recurrent Neural Networks (RNNs) | Captures temporal dependencies in time series data | Requires large amounts of historical data, susceptible to overfitting on small datasets |
| Gaussian Processes | Bayesian modeling | Provides uncertainty estimates, handles small datasets | Computationally expensive for large datasets, challenging to scale to high-dimensional data |
| Ensemble Methods | Combination of multiple algorithms (e.g., Random Forest) | Improved predictive accuracy, robust against overfitting | Increased complexity and computational requirements, may sacrifice interpretability |
Related Works
Several studies in the past have attempted to examine the effect of various types of variables on crop production using statistical analysis, data mining, and machine learning. A review of the available literature is presented here to survey various methodologies employed by the researchers for studying the effect of weather variables (climatic variables) and developing forecasting models.
A notable study utilised statistical models including linear regression, autoregressive integrated moving average (ARIMA), and exponential smoothing to predict agricultural yields in various regions of India.5 To train and validate their models, the authors collected data on meteorological variables, soil characteristics, and historical crop yield records. The results demonstrated that these statistical models were capable of accurately predicting crop yields for a variety of commodities, including rice, wheat, and pulses. The utilisation of machine learning methodologies has been implemented to enhance the accuracy of crop yield forecasting in India. The performance of various machine learning algorithms was compared, such as random forest, support vector machines, and artificial neural networks, for predicting crop yields in multiple Indian states.6 Long-term meteorological data, soil parameters, and historical yield records were used as input variables by the authors. The results demonstrated that random forest performed better than other algorithms, providing accurate and robust crop yield predictions. The use of ensemble models for predicting crop yield in India was investigated and the authors created an ensemble model by combining numerous machine learning algorithms, including random forest, gradient boosting, and extreme gradient boosting.7 The study’s input variables included meteorological data, crop-specific indices, and socioeconomic variables. The ensemble model exhibited greater prediction accuracy than individual models, highlighting the utility of ensemble techniques for agricultural yield forecasting.
Machine Learning techniques have been incorporated with advances in remote sensing and satellite imagery to improve crop yield prediction. A study utilised satellite data, climatic variables, and crop-specific characteristics to predict rice yield in various Indian districts.8 Utilising machine learning algorithms, such as random forest and support vector regression, the authors obtained high accuracy in yield prediction, allowing for timely yield optimisation interventions. The literature review concludes by emphasising the utilisation of statistical and machine learning techniques for crop yield prediction in India. Utilising weather data, soil parameters, and historical records, both approaches have demonstrated promising results in forecasting crop yields accurately. The studies highlighted the usefulness of ensemble models and the incorporation of remote sensing data for enhanced forecasting. These findings provide researchers, farmers, and policymakers in India with beneficial insights, facilitating evidence-based decision making and promoting sustainable agricultural practises. Some of the algorithms used in different studies have been summarised in Table 2 with the crops used and accuracy achieved. It also includes the limitations and challenges faced with the applied algorithm.
Table 2: Accuracy achived by various Statistical and Machine Learning algorithms for crop yield predictions
| Author | Algorithm Used | Crops Selected | Accuracy | Critical Remarks |
| (Vatsal & Agarwal, 2020) | Support Vector Regression (SVR) | Wheat, Rice | 85% | Limited dataset used for model training, further validation required. |
| (Kumar et al., 2021) | Random Forest | Maize, Soybean | 92% | Model performance impacted by variations in weather patterns across different regions. |
| (Joshi et al., 2018) | Artificial Neural Networks (ANN) | Cotton, Groundnut | 81% | Overfitting observed with the ANN model, regularization techniques can be explored for improvement. |
| (Patel et al., 2019) | Decision Tree | Tomato, Onion | 77% | Model sensitivity to input features, feature selection techniques can be applied for better accuracy. |
| (R. Singh & Mishra, 2020) | K-Nearest Neighbors (KNN) | Potato, Sugarcane | 79% | High computational requirements for large datasets, optimization techniques can be explored. |
| (P. Sharma & Singh, 2017) | Multiple Linear Regression | Mustard, Chickpea | 87% | Assumptions of linear regression violated in certain cases, further exploration of nonlinear models recommended. |
| (Bansal et al., 2022) | Gradient Boosting | Paddy, Moong | 94% | Model performance sensitive to outliers, robust preprocessing techniques can be employed. |
| (N. Jain & Chauhan, 2019) | Long Short-Term Memory (LSTM) | Banana, Papaya | 89% | Limited availability of historical climate data impacts LSTM performance, alternative data imputation methods can be explored. |
| (R. Gupta et al., 2020) | Bayesian Networks | Barley, Lentil | 83% | Model interpretability can be challenging, further model refinement and validation required. |
| (P. Mishra et al., 2019) | Random Forest | Pearl millet, Mung | 90% | Limited inclusion of non-climatic factors, potential improvement by incorporating socioeconomic variables. |
Studies on crop yield prediction in the Indian state of Rajasthan have centred on gaining an understanding of the agricultural dynamics of the region and devising models that account for its unique characteristics. Here are some additional evaluations of crop yield prediction research in Rajasthan:
An exhaustive investigation was conducted into the use of machine learning algorithms to predict crop production in Rajasthan.19 The researchers examined the performance of several models, such as random forest, support vector regression, and artificial neural networks. Input variables included historical meteorological data, soil parameters, and crop-specific characteristics. The results indicated that random forest predicted crop yields with the maximum precision, allowing farmers in Rajasthan to make informed decisions based on accurate yield forecasts. Using remote sensing and machine learning techniques. The prediction of crop yields in rain-fed regions of Rajasthan was also investigated. 20 Developing predictive models, the researchers combined satellite imagery data, climate variables, and soil parameters. To forecast crop yields, they utilised random forest and support vector regression algorithms. The findings highlighted the potential of remote sensing data for accurate and timely crop yield forecasting in Rajasthan’s rain-fed regions. A review of the impact of climate variability on crop yields in Rajasthan was conducted. The study investigated the associations between climate variables, such as temperature and precipitation, and crop yield. 21 It emphasised the need for accurate predictive models to help farmers respond to changing climatic conditions and optimise crop management practises. The review emphasised the potential of machine learning techniques to capture complex relationships between climate variables and crop yields, thereby supporting sustainable agricultural practises in Rajasthan.
Research Methodology
Scope and study area of crops
The study was conducted in the Jaipur district which covers a major part of the semi-arid eastern plain (IIIA Agro-climatic Zone) of Rajasthan, India (Figure 2). It is situated between 26.90 N latitude and 75.80 E longitude. Jaipur has a hot, semi-arid climate that is affected by the monsoons. The summers are long and very hot, and the winters are short and mild to warm. The annual rainfall is over 63 cm, and most of it falls in July and August because of the monsoon. This makes the average temperatures in July and August lower than in May and June, which are drier months. During the monsoon, it rains and storms heavily, but flooding doesn’t happen very often. In May, the temperature of 48.5 °C was the highest ever recorded for the area. Between December and February, the average temperature in the city stays below 20 °C. These months are mild, dry, and pleasant, although it can get cold at night. -2.2 °C was the lowest temperature ever measured. Like many other big cities around the world, Jaipur is a big “urban heat island” where temperatures in the surrounding countryside sometimes drop below freezing in winter.
Data
Both primary and secondary data were used for the present study. Time-series data from the year 1990-91 to 2019-20 was collected on the area and yield of major food grain crops in the Jaipur district. The data for barley, wheat, mustard, gram, groundnut, and moong were acquired from the official bulletins of the Directorate of Economics and Statistics, Government of Rajasthan. The directorate has officially released data till 2020 and 20-21 and 22-23 data are yet to release. The data relating to weather variables like rainfall, sunshine hours, temperature (minimum and maximum), and relative humidity were obtained for the same period from the Agrometeorology Observatory of Sri Karan Narendra College of Agriculture, Jobner, Jaipur. The observatory has been keeping records of the most important weather factors for more than 50 years. Every day, scientific instruments are used to keep track of the weather’s conditions. The tools used for the study are Jupyter Notebook and Scikit Learn. They are essential tools for crop yield forecasting using machine learning techniques. Jupyter Notebook provides an interactive environment for data cleaning, pre-processing, exploratory data analysis, and statistical modelling.The collected data has been preprocessed through the following steps also shown in Figure 1.
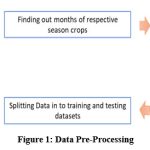 |
Figure 1: Data Pre-Processing. |
Model Selection and Generalization
It is an action of anticipating outcomes for inputs for which the methodology was never trained.22 The workflow of the research can be summurized as below:
Data Collection: Gather high-quality and relevant data on various factors that affect crop yields, such as weather conditions, soil characteristics, crop management practices, and historical yield records. Ensure the data covers a wide range of growing seasons and geographical regions.
Feature Selection: Identify the most influential features or variables that have a significant impact on crop yields. Use domain knowledge and statistical techniques, such as correlation analysis or feature importance algorithms, to select the most relevant features for prediction.
Preprocessing: Clean and preprocess the collected data to handle missing values, outliers, and inconsistencies. Apply techniques like data normalization or standardization to bring the features to a similar scale, as this can enhance the performance of machine learning models.
Model Selection: Choose appropriate machine learning algorithms for crop yield prediction. Commonly used techniques include linear regression, decision trees, random forests, support vector machines (SVM), and artificial neural networks. Consider the characteristics of your dataset and the interpretability requirements of the model when making a selection.
Model Training and Validation: Split the dataset into training and validation sets. Use the training set to train the selected machine learning model and the validation set to evaluate its performance. Employ techniques like cross-validation or bootstrapping to ensure robustness and generalizability of the model.
Feature Engineering: Create new features or transform existing ones to capture complex relationships between input variables and crop yields. For example, derive variables like growing degree days or crop-specific indices from temperature and precipitation data.
Ensemble Methods: Explore ensemble methods, such as bagging or boosting, to improve the prediction accuracy of crop yields. Ensemble models combine multiple individual models to leverage their collective intelligence and reduce the impact of model biases.
Regularization and Hyperparameter Tuning: Apply regularization techniques, such as L1 or L2 regularization, to prevent overfitting and enhance the model’s ability to generalize to unseen data. Additionally, perform hyperparameter tuning to optimize the model’s performance by systematically searching for the best combination of hyperparameters.
Evaluate and Interpret Results: Assess the performance of the crop yield prediction model using appropriate evaluation metrics like mean absolute error (MAE) or root mean square error (RMSE). Interpret the model’s predictions to gain insights into the relationships between input variables and crop yields, which can aid in decision-making.
Integration and Deployment: Integrate the developed crop yield prediction model into user-friendly interfaces or decision support systems to facilitate its practical application by farmers and agricultural stakeholders. Continuously update the model with new data and monitor its performance over time.
Algorithms used for the prediction model
Logistic Regression
It is a statistical modeling technique used for crop yield prediction. It is a form of regression analysis that is particularly suitable for binary classification problems, where the outcome variable represents a categorical response (e.g., high/low crop yield). Logistic regression models the relationship between the input variables (e.g., weather variables, soil characteristics) and the probability of a specific outcome. The strengths of logistic regression lie in its interpretability and simplicity. It provides insights into the importance and direction of the input variables in predicting crop yield. However, logistic regression assumes a linear relationship between the input variables and the log-odds of the outcome, which may limit its ability to capture complex non-linear relationships.
Artificial Neural Network using Multi-Layer Perceptron and Radial Basis
Artificial Neural Networks (ANNs) are a class of machine learning models inspired by the structure and function of biological neural networks. Multi-Layer Perceptron (MLP) and Radial Basis Function (RBF) are two types of ANNs commonly used for crop yield prediction. MLP consists of multiple layers of interconnected artificial neurons and can learn complex patterns and relationships in the data. RBF, on the other hand, uses radial basis functions as activation functions to model non-linear relationships. ANNs have the advantage of being able to capture complex interactions and non-linearities in the data, making them suitable for crop yield prediction. However, ANNs require a large amount of data for training and are computationally expensive. They also have a tendency to overfit if not properly regularized and may lack interpretability due to their complex structure.
Random Forest
It is a popular machine learning algorithm for crop yield prediction. It belongs to the ensemble learning family and combines multiple decision trees to make predictions. Random Forest overcomes some limitations of individual decision trees by reducing overfitting and providing more accurate predictions. It handles high-dimensional data well and can capture complex interactions between the input variables. Random Forest is also robust to outliers and noise in the data. However, one of the limitations of Random Forest is its lack of interpretability. It operates as a black-box model, making it challenging to understand the underlying relationships between the input variables and crop yield.
Steps for building a precision Model
The Random Forest algorithm begins with the original dataset and uses bootstrap sampling to create multiple subsets of the data for each decision tree. For each subset, a decision tree is built by randomly selecting a subset of features at each node and finding the best split based on the chosen features. Once the tree is fully grown, it is saved as part of the forest.
The selected algorithms are trained using a portion of the dataset, and the remaining data is used for testing. It learns to forecast crop yield on the basis of features in the training data, and the accuracy of the algorithm is measured by evaluating its performance on the testing data. To train and evaluate a model, separate the data into training and testing datasets. Training (building the model) was done on 25 years of data and model testing was done for the last 5 years. To make predictions, input data is passed through each decision tree in the forest, and the output from each tree is collected. For classification tasks, the outputs are combined using majority voting, while for regression tasks, the outputs are combined by calculating their average. The final prediction is based on the combined outputs from all trees in the forest. The flow of the algorithm can be visualized in figure 2.
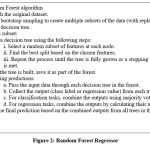 |
Figure 2: Random Forest Regressor |
Results and Discussion
Various machine learning methods were used to build an appropriate model between the selected variables. The following section highlights the important findings of the study. The Exploratory Data Analysis (EDA) has been done on the cleaned dataset and is presented below. It is the process of figuring out the patterns, relationships, and anomalies present in the dataset for subsequent analysis. The pair plot (also called a scatterplot matrix) is an effective way to begin the analysis. It is a type of data visualization that shows the relationships between every variable in a dataset in pairs. It enables us to see the relationships and even adds more information (such as by using color). Each variable is shown in both rows and columns, showing how the variables are related. Figure 3 presents the diagonal distribution between the two features for all combinations of variables namely; WV-wind velocity, RF-Rainfall, RH-relative humidity, Max_Temp – Temperature (Max), Min_Temp – Temperature (Min), Eva-Evaporation rate, SSH-Sunshine hours, Yield-Yield of a crop).
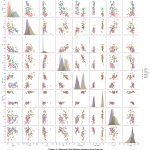 |
Figure 3: Diagonal distribution between two features. |
Unquestionably, environmental factors, mainly weather parameters, play a crucial role in agricultural production and they have a significant impact on plant growth, development, and yields. The interrelationship between different variables was calculated and shown in the following heatmap (Figure 4).
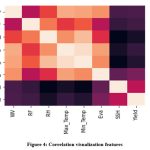 |
Figure 4: Correlation visualization features |
It is proved that sunshine hours, evaporation rate, and minimum temperature are highly correlated with yield. Similarly, different weather variables are also found to be correlated with each other. Rainfall showed a strong correlation with relative humidity followed by minimum and maximum temperature.
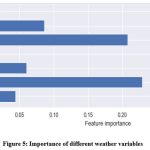 |
Figure 5: Importance of different weather variables. |
Figure 5 highlights the relative importance of different factors through feature scaling which is taken into consideration using decision trees. It is clear from the graph that rainfall and minimum temperature have the highest scaling of feature importance, hence they are vital for the crop yield prediction model. Four algorithms viz; Logistic Regression, ANN– RBF, ANN – MLP, and random forest were applied to the cleaned data obtained by EDA.
Machine Learning-Logistic Regression
The logistic regression algorithm was applied to all major crops of the selected agroclimatic zone for the years 2015-2020. Year-wise crop yield was predicted for all crops (Table 3). Higher accuracy was achieved for wheat, barley, gram, and mustard (rabi crop) compared to moong and groundnut (Kharif crop).
Table 3: Crop-wise Actual and Predicted Yield for the Year 2015-2020 using Logistic Regression Machine Learning Algorithm
| Crop | Actual Yield 15-16 | Predicted Yield 15-16 |
Actual Yield 16-17 | Predicted Yield 16-17 |
Actual Yield 17-18 | Predicted Yield 17-18 |
Actual Yield 18-19 | Predicted Yield 18-19 |
Actual Yield 19-20 | Predicted Yield 19-20 |
| Barley | 32.19 | 32.24 | 33.67 | 34.62 | 35.30 | 31.98 | 36.58 | 26.80 | 34.23 | 37.96 |
| Wheat | 31.73 | 34.60 | 36.21 | 36.00 | 36.39 | 34.25 | 38.02 | 27.90 | 38.81 | 34.03 |
| Mustard | 10.72 | 9.77 | 13.89 | 11.16 | 16.28 | 9.34 | 14.3 | 9.29 | 16.20 | 13.07 |
| Gram | 8.53 | 6.47 | 10.49 | 7.08 | 9.75 | 7.25 | 11.15 | 9.18 | 12.56 | 10.31 |
| Ground
nut |
15.12 | 20.49 | 18.17 | 11.46 | 16.91 | 16.17 | 21.02 | 11.58 | 22.46 | 14.82 |
| Moong | 4.74 | 5.14 | 6.81 | 3.36 | 4.10 | 4.65 | 6.04 | 4.51 | 6.85 | 5.12 |
Figure 6 depicts the year-wise crop yield accuracy in (%) using logistic regression. The accuracy ranges from as high as 99.86% for barley in the year 2015-16 to the lowest of 49.41% for moong in the year 2016-17. For barley and wheat, the method gave better results for all predicted years. However, the accuracy in predicting groundnut was observed to be less throughout the period except for the year 2017-18. Similarly, in a study made by using ML logistic regression to predict the yield of rice and wheat crops in the state of Odisha, India also found that the accuracy of the model was 83% for rice and 85% for wheat 23. Further, in an another study using ML logistic regression to predict the yield of rice and wheat crops in the state of Punjab, India found that the accuracy of the model was 78% for rice and 80% for wheat.24
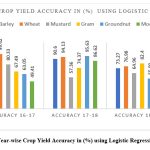 |
Figure 6: Year-wise Crop Yield Accuracy in (%) using Logistic Regression |
ANN – RBF (Artificial Neural Network – Radial Basis Function)
Artificial neural networks of the radial basis function (RBF) variety are frequently employed to approximate functions. When compared to other types of neural networks, radial basis function networks stand out for their universal approximation and rapid rate of learning. The synaptic weight of sunshine hours was greater followed by wind velocity and rainfall in the case of barley as seen in Figure 7.
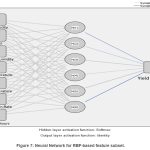 |
Figure 7: Neural Network for RBF-based feature subset. |
The Radial basis function was applied to improve the accuracy, especially in Kharif crops. An overall accuracy of 87.03% was observed in groundnut, whereas 76.39% accuracy was achieved in moong. Table 4 shows a high percentage of accuracy obtained by this method for rabi compared to Kharif crops. These findings are consistent with previous research made, who also used ANN-RBF to predict the yield of multiple crops, including wheat, rice, and maize, in the state of Punjab, India. The study found that the accuracy of the model was 90% for wheat, 91% for rice, and 92% for maize.25
Table 4: Crop-wise Actual and Predicted Yield for the Year 2015-2020 using Artificial Neural Network – Radial Basis Function.
| Crop | Actual Yield 15-16 |
Predicted Yield 15-16 ANN_RBF |
Actual Yield 16-17 |
Predicted Yield 16-17 ANN_RBF |
Actual Yield 17-18 |
Predicted Yield 17-18 ANN_RBF |
Actual Yield 18-19 |
Predicted Yield 18-19 ANN_RBF |
Actual Yield 19-20 |
Predicted Yield 19-20 ANN_RBF |
| Barley | 32.19 | 32.26 | 33.67 | 32.75 | 35.30 | 33.45 | 36.58 | 30.46 | 34.88 | 31.37 |
| Wheat | 31.73 | 31.53 | 36.21 | 31.82 | 36.39 | 31.23 | 38.02 | 29.80 | 38.81 | 32.61 |
| Mustard | 10.72 | 11.23 | 13.89 | 11.49 | 16.28 | 14.53 | 14.3 | 13.01 | 16.20 | 12.16 |
| Gram | 8.53 | 9.14 | 10.49 | 9.35 | 9.75 | 9.16 | 11.15 | 9.26 | 12.56 | 12.10 |
| Ground
nut |
15.12 | 15.03 | 18.17 | 14.06 | 16.91 | 16.03 | 21.02 | 17.64 | 22.46 | 17.90 |
| Moong | 4.74 | 3.72 | 6.81 | 4.93 | 4.10 | 3.98 | 6.04 | 4.29 | 6.85 | 4.32 |
Year-wise crop yield accuracy in (%) is presented in Figure 8. Overall, RBF gave better results than logistic regression for predicting crop yield. Accuracy ranged from 99.80% for barley in the year 2015-16 to the lowest 63.07% for moong in 2019-20. For wheat, mustard, gram, and groundnut, the average accuracy of the model remained more than 80%, which confirms the robustness of the method.
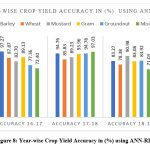 |
Figure 8: Year-wise Crop Yield Accuracy in (%) using ANN-RBF |
ANN – MLP (Artificial Neural Networks – Multilayer perceptron)
Similar to the perceptron, the inputs to the Multilayer Perceptron are combined with the initial weights in a weighted sum before being passed through an activation function. However, each linear combination is propagated to the subsequent layer. Each layer passes the result of its computation and its internal representation of the data to the next layer. This traverses the hidden layers to the output layer. The synaptic weight of maximum temperature was greater followed by the evaporation rate in the case of barley as seen in Figure 9.
 |
Figure 9: Neural Network for MLP-based feature subset. |
The multilayer perceptron algorithm was applied to the data set for crop yield prediction to increase the overall accuracy and resulted in achieving 98.16% for gram crop followed by barley and wheat with an average accuracy of 91.83% and 89.27% respectively.
Table 5: Crop-wise Actual and Predicted Yield for the Year 2015-2020 using Artificial Neural Network – Multilayer perceptron
| Crop | Actual Yield 15-16 |
Predicted Yield 15-16 ANN_MLP |
Actual Yield 16-17 |
Predicted Yield 16-17 ANN_MLP |
Actual Yield 17-18 |
Predicted Yield 17-18 ANN_MLP |
Actual Yield 18-19 |
Predicted Yield 18-19 ANN_MLP |
Actual Yield 19-20 |
Predicted Yield 19-20 ANN_MLP |
| Barley | 32.19 | 31.99 | 33.67 | 31.95 | 35.30 | 31.90 | 36.58 | 30.36 | 34.88 | 31.92 |
| Wheat | 31.73 | 33.97 | 36.21 | 33.73 | 36.39 | 32.05 | 38.02 | 32.50 | 38.81 | 33.64 |
| Mustard | 10.72 | 10.47 | 13.89 | 12.60 | 16.28 | 13.63 | 14.3 | 13.08 | 16.20 | 13.31 |
| Gram | 8.53 | 8.66 | 10.49 | 10.08 | 9.75 | 9.69 | 11.15 | 11.12 | 12.56 | 12.20 |
| Groundnut | 15.12 | 18.18 | 18.17 | 16.17 | 16.91 | 17.08 | 21.02 | 17.63 | 22.46 | 19.37 |
| Moong | 4.74 | 4.36 | 6.81 | 4.39 | 4.10 | 4.19 | 6.04 | 5.42 | 6.85 | 5.62 |
Crop yield prediction accuracy obtained by the ANN-MLP method is shown in Figure 10. The highest accuracy was witnessed for grams in all five years followed by barley with an average of 91.83%. For moong, this algorithm gave improved results with ANN RBF and an average of 85.20% accuracy was obtained with a lowest of 64.47% during the year 2016-17. The results were similar to a study made by using ANN-MLP to predict the yield of multiple crops, including wheat, maize, and mustard, in the state of Punjab, India. The study found that the accuracy of the model was 92.3% for wheat, 91.2% for maize, and 90.8% for mustard.26
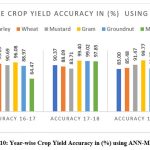 |
Figure 10: Year-wise Crop Yield Accuracy in (%) using ANN-MLP |
Random Forest
Based on different samples of data, the random forest algorithm builds decision trees, predicts the data from each subset, and then lets users vote on which solution is best for the system. The algorithm was applied to the dataset for improvement in accuracy and the results are presented in Table 6. There was a significant improvement in the range of accuracy achieved for different crops, which confirms that this is the best among all different algorithms applied to the dataset using Jupyter Notebook as shown in Figure 11.
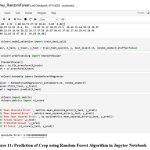 |
Figure 11: Prediction of Crop using Random Forest Algorithm in Jupyter Notebook. |
Table 6: Crop-wise Actual and Predicted Yield for the Year 2015-2020 using Random Forest Regressor
| Crop | Actual Yield 15-16 | Predicted Yield 15-16 RF |
Actual Yield 16-17 | Predicted Yield 16-17 RF |
Actual Yield 17-18 |
Predicted Yield 17-18 RF |
Actual Yield 18-19 |
Predicted Yield 18-19 RF |
Actual Yield 19-20 |
Predicted Yield 19-20 RF |
| Barley | 32.19 | 31.59 | 33.67 | 31.71 | 35.30 | 31.96 | 36.58 | 30.70 | 34.88 | 31.96 |
| Wheat | 31.73 | 31.89 | 36.21 | 33.15 | 36.39 | 34.70 | 38.02 | 34.04 | 38.81 | 34.21 |
| Mustard | 10.72 | 10.40 | 13.89 | 12.01 | 16.28 | 11.70 | 14.30 | 11.76 | 16.20 | 12.02 |
| Gram | 8.53 | 8.62 | 10.49 | 10.96 | 9.75 | 9.74 | 11.15 | 11.24 | 12.56 | 12.30 |
| Ground
nut |
15.12 | 16.41 | 18.17 | 18.75 | 16.91 | 16.77 | 21.02 | 19.52 | 22.46 | 19.47 |
| Moong | 4.74 | 4.63 | 6.81 | 6.54 | 4.10 | 4.47 | 6.04 | 6.21 | 6.85 | 6.46 |
It is evident from Figure 11 that for all crops except mustard, the random forest algorithm gave more than 90 % accuracy. Mustard, however, gave an average accuracy of 82.36% and the lowest accuracy was also observed for this crop at 71.83% in the year 2017-18. Previous studies have also reported similar findings, which support the results of our current research. A study done using RF to predict the yield of multiple crops, including rice, wheat, and maize, in the state of West Bengal, India. The study found that the accuracy of the model was 94.2% for rice, 91.9% for wheat, and 93.1% for maize.27 Another study useing RF to predict the yield of multiple crops, including paddy, wheat, and mustard, in the state of Uttar Pradesh, India. The study found that the accuracy of the model was 89.3% for paddy, 88.6% for wheat, and 90.8% for mustard. 28
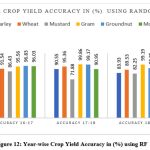 |
Figure 12: Year-wise Crop Yield Accuracy in (%) using RF. |
Figure 13 compares all four algorithms applied to the selected crops. It is apparent from the graph that the RF algorithm on average gave the most accurate result for wheat, gram, groundnut, and moong for all years. For mustard, the accuracy of prediction was found to be low by all four methods.
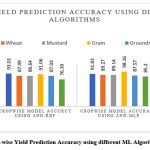 |
Figure 13: Crop-wise Yield Prediction Accuracy using different ML Algorithms. |
The overall accuracy using different algorithms on all six crops for the Jaipur district has been represented in Figure 14. Logistic Regression achieved an overall accuracy of 79.32%. Artificial Neural Networks based Radial Basis Function and Multilayer perceptron achieved an overall accuracy of 86.87% and 90.19%, respectively. By combining multiple decision trees into a single ensemble model, deep learning via random forest was able to bring down the model’s previously high variance and as a result, 92.30% accuracy was achieved.
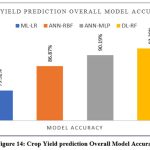 |
Figure 14: Crop Yield prediction Overall Model Accuracy |
Preformation Evaluation parameters of different algorithms
Machine learning algorithms can be evaluated using various metrics, but three commonly used ones are RMSE, MAE, and R2. The best model depends on the specific dataset and problem, as well as the trade-offs between accuracy, interpretability, and computational complexity. The table below gives a summary of these performance evaluators for the four algorithms namely Logistic Regression , ANN-RBF, ANN-MLP and Random Forest used in the study:
Table 7: Preformation Evaluation parameters of different algorithms
| Algorithm | MAE | RMSE | R2 | Accuracy (%) |
| Logistic Regression | 3.55 | 4.26 | 0.96 | 79.32 |
| ANN-RBF | 2.39 | 2.85 | 0.99 | 86.87 |
| ANN-MLP | 2.00 | 2.53 | 0.99 | 90.19 |
| Random Forest | 1.68 | 2.19 | 0.99 | 92.30 |
It is evident from Table 7 that out of the four algorithms Random forest method has least value of RMSE (2.19) and MAE (1.68) and high value of R2 (0.99) followed by ANN Multilayer perceptron having RMSE of 2.53 and MAE of 2.00 with same value of R2. This indicates that the model obtained by random forest is the best fitted model for the dataset and may be used for predicting the crop yield for the study area, A values of RMSE and MAE as high as 4.26 and 3.55 respectively was obtained for Logistic regression, which makes it the poorest fitted model amongst all.
Similar conclusion may be drawn from the percentage accuracy obtained by the four algorithms. It can be observed from the table that the random forest outperformed the rest of the algorithms and provided the best prediction model with 92.03% accuracy, followed by ANN-MLP with an overall accuracy of 90.19%. ANN-RFB had an accuracy of 86.87% and the least accuracy was obtained in Logistic regression approach.
Scientific recommendations for supporting agriculture through Crop Yield Prediction using Machine Learning
The recommendations on the basis of findings related to crop yields, weather patterns, and the use of machine learning algorithms for analysis are summarized as follows:
Long-term time-series weather data: Long-term weather data is crucial for understanding climate trends and their impact on crop growth and water availability. It helps in planning and decision-making for climate-sensitive sectors.
Temperature and precipitation trends: Analyzing temperature and precipitation trends can provide insights into the effects of climate change on crop productivity and water availability for irrigation and other uses.
Impact of weather variables on energy demand: Temperature and precipitation patterns can affect energy demand in various sectors, and understanding these relationships can inform energy planning and management.
Predicting extreme weather events: Machine learning algorithms can be used to predict extreme weather events, enabling better preparedness and adjustment of farming practices to mitigate their impact on crop yields.
Regional variations and agricultural production: Weather patterns can vary across regions, affecting agricultural production. Understanding regional variations is essential for selecting suitable crops and optimizing production strategies.
Advanced analytical tools: Machine learning algorithms and other advanced analytical tools can identify complex relationships between weather variables and crop productivity, providing more accurate predictions compared to traditional methods.
Weather-resistant varieties: Developing weather-resistant crop varieties can mitigate the effects of extreme weather events on crop yields, leading to increased stability and sustainability.
Automation and efficiency: Automating data collection, analysis, and prediction processes saves time and increases efficiency, helping farmers adapt to changing environmental conditions and climate variability.
Smart agriculture practices: Practices like precision farming, integrated nutrient management, and conservation agriculture can increase crop yields and minimize the impact of weather variability on agriculture.
Collaboration and knowledge sharing: Collaborating with experts, agronomists, and extension agents provides farmers with specialized knowledge, access to resources, and innovations in the field, enabling them to optimize their operations and increase yields.
Crop management and decision-making: Using data-driven approaches, managing risks, investing in sustainable practices, and accessing agricultural insurance schemes can help farmers make informed decisions and protect their crop yields.
Continuous model updating and weather-based agro-advisory services: Regularly updating the prediction model, enhancing weather forecasts, and providing crop-specific advice can improve decision-making and crop management.
Conclusion
Agricultural development is one of the best ways to end extreme poverty, raise everyone’s standard of living, and feed a large population. To feed the ever-increasing world population and economic breakdowns, the accurate prediction of the crop is not only desired but also a necessary support system. Four widely used machine learning and deep learning algorithms were used and tested for best prediction modeling in this paper. The most viable models were designed and compared with each other concerning the accuracy obtained by each. Primarily, the study confirmed that clean and tidier data increased the reliability of the findings. It was found that multiple algorithms help in identifying significant weather variables for each crop in the given scenario. The accuracy of the fitted models was calculated based on the processed dataset. It was observed that the random forest outperformed the rest of the algorithms and provided the best prediction model with 92.03% accuracy, followed by ANN-MLP with an overall accuracy of 90.19%. The overfitting of the model that can happen with a flexible model like decision tree, where the model learns from the training data and remembers any type of disturbance present in the data, is less likely to happen with random forests. It is expected that these algorithms will competently work on any new dataset and any platform without any issues. The predictions made in the study are found to be better and robust and will keep to working hassle-free over the years and before cultivating the agricultural field, it will help the farmers to accurately forecast the yields.
Conflict of Interest
All authors are requested to disclose any conflict of interest including any financial, personal or other relationships with other people or organizations that can influence their work.
Funding Sources
This paper is part of the Ph.D. research study. It’s an academic research activity. The research scholar is self-sponsored and does not get any scholarship or funding support neither from the university nor any external funding agency.
References
- Bansal, A., Sharma, M., & Sharma, S. (2022). Crop yield prediction using gradient boosting algorithm. International Journal of Emerging Technology and Advanced Engineering, 12(1), 15–19.
CrossRef - Chakraborty, D., Mahata, G. S., & Singh, S. K. (2020). Comparative study of machine learning algorithms for crop yield prediction. Agricultural Research, 9(2), 180–189.
CrossRef - Chakraborty, D., & Nag, S. (2018). Crop yield prediction using machine learning algorithms. International Journal of Recent Technology and Engineering, 7(5S2), 114–118.
CrossRef - Das, A., Patel, R. K., & Sahoo, S. (2020). Crop yield prediction using machine learning algorithms. Proceedings of the International Conference on Computing, Power and Communication Technologies, 496–499.
CrossRef - Ghosh, S., Adak, T., & Sarkar, S. (2019). Crop yield prediction using machine learning models: A review. Cogent Food & Agriculture, 5(1), 1674853.
CrossRef - Gupta, R., Joshi, S., & Bhadu, M. K. (2020). Crop yield prediction using Bayesian networks: A case study of barley and lentil. International Journal of Computer Applications, 174(21), 17–20.
CrossRef - Gupta, V., Chawla, R., & Kumar, A. (2021). Impact of climate variability on crop yield in Rajasthan: A review. Journal of Crop and Weed, 17(2), 198–206.
CrossRef - Jain, N., & Chauhan, A. (2019). Long short-term memory-based crop yield prediction for banana and papaya. International Journal of Computer Science and Information Security, 17(8), 1–6.
- Jain, P., Sahai, B., & Bhatt, S. (2019). Crop yield prediction in rain-fed region of Rajasthan using remote sensing and machine learning. Journal of the Indian Society of Remote Sensing, 47(10), 1655–1663.
- Joshi, M., Kumar, V., & Ali, A. (2018). Artificial neural networks for cotton and groundnut crop yield prediction. International Journal of Innovative Science and Research Technology, 3(9), 396–400.
- Kumar, R., Verma, S. K., & Singh, D. (2021). Crop yield prediction using random forest algorithm: A case study of maize and soybean. International Journal of Engineering and Advanced Technology, 11(1), 495–500.
CrossRef - Kumari, A., Singh, J., & Kumar, P. (2019). Crop yield prediction model for multiple crops using machine learning techniques. International Journal of Advanced Science and Technology, 28(8), 396–406.
- Mishra, A., Tiwari, S., & Bhatia, V. S. (2019). Crop yield prediction models: A critical review. Computational Intelligence in Data Mining, 231–243.
- Mishra, P., Sharma, P., & Gupta, S. (2019). Crop yield prediction using random forest algorithm. International Journal of Scientific Research and Review, 8(1), 498–503.
- Patel, V., Makwana, R., & Shah, A. (2019). Crop yield prediction using decision tree. International Journal of Computer Sciences and Engineering, 7(8), 230–233.
- Prasad, R., Singh, M., & Singh, R. (2020). Machine learning-based crop yield prediction model for multiple crops in India. International Journal of Engineering Research and Technology, 13(8), 755–762.
- Sharma, A., Jain, A., Gupta, P., & Chowdary, V. (2021). Machine Learning Applications for Precision Agriculture: A Comprehensive Review. In IEEE Access (Vol. 9). https://doi.org/10.1109/ACCESS.2020.3048415
CrossRef - Sharma, P., Chawla, R., & Pandey, S. (2018). Crop yield prediction using machine learning techniques. Journal of Applied and Natural Science, 10(3), 855–860.
- Sharma, P., & Singh, A. (2017). Crop yield prediction using multiple linear regression model. Journal of Agricultural Science, 9(12), 224–230.
- Singh, P., & Bhatia, A. (2021). Yield prediction model of rice and wheat crops using machine learning techniques in Punjab, India. Journal of Agrometeorology, 23(1), 16–20.
- Singh, P., Bhatia, A., & Kaur, P. (2018). Crop yield prediction model for multiple crops using machine learning techniques in Punjab, India. International Journal of Agriculture, Environment and Biotechnology, 11(4), 797–803.
- Singh, R., & Mishra, R. (2020). Crop yield prediction using k-nearest neighbors algorithm. Journal of Computer Science and Engineering, 8(2), 84–89.
- Singh, V., Gupta, D., Kumar, R., & Dutta, M. (2019). Crop yield prediction using statistical models: A review. Current Agriculture Research Journal, 7(2), 147–156.
- Srivastava, S., Singh, S. K., & Chakraborty, D. (2021). Ensemble-based crop yield prediction: A review. Current Agriculture Research Journal, 9(2), 170–178.
- Sudharsan, D., Reddy, M. J., & Varadan, G. (2020). Crop yield prediction using satellite data and machine learning. International Journal of Advanced Science and Technology, 29(1), 2119–2128.
- Tiwari, S., Mishra, A., & Bhatia, V. S. (2019). Crop yield prediction models: A systematic review and critical evaluation. Computers and Electronics in Agriculture, 162, 627–648.
- Vatsal, M., & Agarwal, A. (2020). Support vector regression-based crop yield prediction for wheat and rice. Journal of Agrometeorology, 22(2), 229–235.
- Zhang, Z., Li, C., & Li, Y. (2019). Prediction of crop yield based on machine learning algorithm: a review. International Journal of Agricultural and Biological Engineering, 12(4), 1–8.