
Introduction
As the primary source of human nutrition, agriculture is always looking for new and creative ways to increase output and guarantee food security. The amalgamation of technology, data analytics, and machine learning has surfaced as a revolutionary methodology in this endeavour. Using extensive datasets from the United States Department of Agriculture (USDA) covering the years 2003 to 2013, this study aims to estimate crop yields by leveraging the capability of these techniques. Crop yield prediction is essential to agricultural decision-making because it helps farmers, policymakers, and other stakeholders plan ahead and anticipate changes in agricultural productivity. It is crucial for this endeavour to comprehend the multitude of elements that affect agricultural yield, ranging from different environmental parameters to soil composition and weather patterns. Consequently, the present study commences with a comprehensive Exploratory Data Analysis (EDA) that explores a wide range of agricultural variables in an attempt to unravel the complex interplay between these variables and crop yields. The key to this study is how several machine learning models are then applied to precisely estimate crop output. This study intends to assess the effectiveness of several algorithms, including Linear Regression, Random Forest, Gradient Boost, XGBoost, KNN, Decision Trees, and Bagging Regressor, in predicting agricultural production. We want to determine the most accurate predictors of crop output fluctuations by evaluating and contrasting the performance of different models, which will enable more exact and knowledgeable agricultural estimates. This research aims to both simplify the processes involved in crop yield prediction and open the door to more precise and useful agricultural decision-making by combining data-driven insights with machine learning capabilities.
Objective
The main goals of this study are to use USDA data from 2003 to 2013 and a variety of machine learning models, such as Random Forest, XGBoost, and others, to accurately estimate crop yields. By using measurements like accuracy and Mean Squared Error (MSE), the study seeks to systematically assess and contrast these algorithms’ performances. Furthermore, by doing extensive exploratory data analysis (EDA), the research aims to pinpoint important variables impacting agricultural output. The study examines model dependability using k-fold cross-validation to guarantee the robustness of the results. In the end, the research aims to offer insightful information that can improve crop output forecasts, aid in agricultural decision-making, and help the advancement of sustainable farming methods.
Hypothesis
We postulate that by using USDA data spanning from 2003 to 2013, including a variety of machine learning models and doing extensive exploratory data analysis (EDA), crop yield forecasts would be much improved. Certain algorithms are predicted to perform better than KNN and Linear Regression, including Random Forest, Decision Trees, and Bagging Regressor. These models’ ability to foresee is expected to be significantly enhanced by the underlying elements that EDA identifies. Furthermore, to improve the robustness of the model, k-fold cross-validation is expected. In order to optimise agricultural production, assist wise decision-making, and advance sustainable practices, the research seeks to offer insightful information.
Literature
The ultimate goal of our efforts is to improve the productivity and sustainability of farming methods in order to provide a more robust and fruitful future for the world’s food systems. While LDA is used to efficiently group or categorise the data, EDA is utilised as a first step in exploring and understanding the data. The study analyses and forecasts wheat production depending on environmental conditions by using these techniques in combination with predictive models such as decision trees and random forest regression. In addition, many models are used in ensemble learning to improve prediction accuracy and get understanding of model performance 1. This research attempted to thoroughly collect and synthesise data about algorithms and characteristics used in agricultural yield prediction studies using a Systematic Literature Review (SLR). There were 567 pertinent studies found after the first search of six internet databases. Fifty studies met the predetermined inclusion and exclusion criteria and were chosen for further analysis2. The Random Forest method, in particular, shows to be useful in producing these very accurate predictions using machine learning. Because of its use, accurate crop projections are made possible, assisting farmers in choosing the best crop to plant in light of the current environmental conditions 3. The usefulness of Support Vector Machines (SVM), Single-Layer Artificial Neural Networks (ANN), Deep Neural Networks (DNN), and Extreme Gradient Boosting (XGBoost) models in forecasting daily temperatures for summer maize production in Northwest China was examined in this study4. Using a set of parameters, machine learning techniques—both supervised and unsupervised—allow for the prediction of results. Creating a useful connection between the input variables and the intended output parameter is the aim. In order to improve crop yield forecast accuracy, an ensemble of two machine learning algorithms is utilised in this.After conducting a thorough search across several databases, the study found almost seven relevant characteristics. The researchers then assembled and examined a dataset that included 28,242 occurrences. Analysing these characteristics and comparing different algorithms produced enlightening findings. The study examined the efficacy of machine learning algorithms and suggested directions for further research in this field5. The present work underscores the importance of clustering approaches in identifying patterns within agricultural data, hence reducing the difficulties associated with sparse data when estimating crop productivity. A robust cross-validation method called K-Fold validation is used to thoroughly examine different prediction models. Using this strategy, the data is divided into K subsets, and each model is tested at various folds6. A robust cross-validation technique called K-Fold validation is employed to assess different prediction models. Each model is tested on various folds by dividing the data into K subsets. Our multi-model ensemble strategy’s generalizability is confirmed by K-Fold validation, which enhances crop production predictions7.
The rapid evolution of big data applications in agriculture is driven by an increasing accumulation of experience, growing applications, the emergence of best practices, and enhanced computational power. Despite this progress, actual implementations addressing real-life problems are limited. What defines the process of adapting big data challenges to solutions, and to what degree is there alignment between them8.
This research involved conducting a Systematic Literature Review (SLR) to systematically extract and amalgamate algorithms and features employed in studies related to crop yield prediction. Utilizing predefined search criteria, a total of 567 pertinent studies were retrieved from six electronic databases. Subsequently, 50 studies were meticulously selected for in-depth analysis based on inclusion and exclusion criteria. The chosen studies underwent careful examination, wherein we scrutinized the employed methodologies and features, offering insights and recommendations for future research directions. Our analysis identified temperature, rainfall, and soil type as the predominantly utilized features, with Artificial Neural Networks emerging as the most commonly applied algorithm in these predictive models9.
Recently, there has been a growing application of Deep Learning (DL) techniques in the analysis of dense scenes, with a notable emergence in the field of dense agricultural scenes. This review aims to delve into the diverse applications of DL for analyzing dense scenes in agriculture. To provide a comprehensive understanding of the topic, we initially outline the different types of dense scenes encountered in agricultural settings, along with the associated challenges. Subsequently, we present an overview of widely employed deep neural networks specifically tailored for analyzing these dense scenes. The review then extensively covers the applications of these neural network structures across various agricultural tasks, encompassing aspects such as recognition and classification, detection, counting, and yield estimation10.
Leveraging sensors and biosensors with the capacity to perceive alterations in plant health and forecast the progression of both morphology and physiology has emerged as a valuable approach for enhancing crop yields. The advent of flexible sensors and nano materials has sparked innovations in wearable and portable devices designed for on-plant use. These devices offer continuous and precise long-term sensing capabilities, capturing morphological, physiological, biochemical, and environmental parameters. This review offers a comprehensive exploration of cutting-edge plant sensing technologies, examining wearable and integrated devices specifically designed to engineer and monitor the morphological traits, physiological processes, and interactions between plants and their environment11.
Proposed Methodology
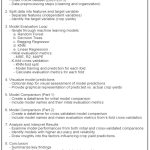 |
Table 1: The Workflow |
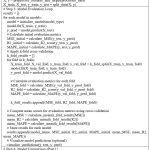 |
Figure 1: Steps involved for proposed methodology |
Dataset
The dataset12 has 8 columns with different data kinds and 28242 items indexed from 0 to 28241: Six of the eight columns have data types other than float64 and int64.There are just two columns that contain the object data type: Item and Area. In terms of missing values, every column has 28242 non-null items, which means that there are no missing values in the dataset. Table 2 represents the summary of the numerical columns present in the data set and some inferences drawn out from the table 2 as there are roughly 1149 rainy days on average every year, with 51 being the wettest and 3240 being the most, with a low of 0.04 and a high of 367778 tonnes, the average amount of pesticides used is an astounding 37077 tonnes.hg/ha_yield: Crop output yields range from 50 to 501412 hectograms per hectare, with an average of 77053.3. Area: Out of 28242 entries, India appears 4048 times, making it the most frequent category among the 101 distinct countries/areas. Item: There are ten distinct kinds of crops. “Potatoes” is the most prevalent kind, occurring 4276 times. Further we have done EDA on the data set used in our research work, there are various graphs drawn through the data set and the inferences have been drawn out. The figure 1 Heat map shows that there is a strong negative correlation between Area and pesticides_tonnes, along with Area and average rainfall of -0.35 and -0.26. An inverse link between the crop type (“Item”) and the crop production yield (“hg/ha_yield”) is represented by the negative sign (-). There is a tendency for the other variable (yield) to shift somewhat in the opposite direction when one variable (crop type) changes. Degree of Correlation Strength: -0.22 is a value that indicates a moderately strong negative association. It suggests that the crop type will likely have a minor impact on the final yield per hectare. Impact of Crop Selection: Given the negative association, it is possible that some crop varieties would marginally affect the final output. There is a slight tendency for the yield per hectare to fluctuate inversely with crop type selection.
Table 2: The summary of numerical valued column in the data set.
| Count | Mean | Std | Min | 25% | 50% | 75% | Max | |
| Unnamed: 0 | 28242.0 | 14120.50 | 8152.90 | 0.00 | 7060.2500 | 14120.5 | 21180.7 | 28241.00 |
| Year | 28242.0 | 2001.54 | 7.05 | 1990.00 | 1995.0000 | 2001.00 | 2008.0 | 2013.00 |
| hg/ha_yield | 28242.0 | 77053.33 | 84956.61 | 50.00 | 19919.2500 | 38295.0 | 104676.7 | 501412.0 |
| Average_rain_
fall_mm_per_year |
28242.0 | 1149.05 | 709.81 | 51.00 | 593.0000 | 1083.00 | 1668.00 | 3240.00 |
| Pesticides_tonnes | 28242.0 | 37076.90 | 59958.78 | 0.04 | 1702.0000 | 17529.4 | 48687.8 | 367778.0 |
| Avg_temp | 28242.0 | 20.54262 | 6.312051 | 1.30 | 16.7025 | 21.51 | 26.0026.0 | 30.65 |
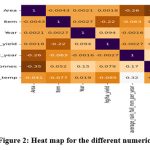 |
Figure 2: Heat map for the different numerical valued column |
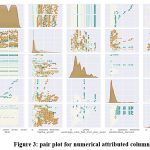 |
Figure 3: pair plot for numerical attributed columns |
The pair plot has given the relationship among different variables, the inference concluded from the pair plot is Items: yams: It seems that yams grow in all rainfall ranges and consume a lot of pesticides. Wheat: Grows well in all typical temperature ranges and requires little to no moisture to flourish.2003–2013: In an effort to boost yam yield, an increasing amount of pesticides were applied to them between 2003 and 2013.hg/ha_yield: While potatoes are the most common crop, sorghum and soybeans have the lowest yields.
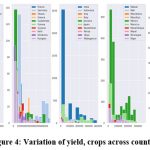 |
Figure 4: Variation of yield, crops across countries. |
From the above figure we concluded that Australia yielded the most while harvesting potatoes, whereas Angola yielded the least when harvesting maize, sorghum, and soybeans. Ecuador was having difficulty harvesting wheat, while Egypt was generating the highest output in this group by cultivating sweet potatoes and potatoes. Honduras had poor luck harvesting wheat, while France and Germany are leading the world in yield output when it comes to potatoes. Madagascar failed to cultivate soybeans and sorghum, while India excelled in producing cassava and Japan was the best at growing potatoes. Niger did not produce a lot of wheat, but Morocco and Mexico did well in producing potatoes. Saudi Arabia, South Africa, and Spain excelled in sorghum cultivation, but Pakistan struggled. Maximum Yield: Maximum yields for various crop types across different areas: Highest yield observed for Maize: 10250.87 hectograms per hectare (Cameroon).Minimum Yield: Minimum yields for different crop types in various regions: Lowest yield observed for Soybeans: 941.75 hectograms per hectare (Tajikistan).Average Yield: Averages (means) for specific crop types in different regions: Sorghum: Ranges from around 2500 to over 10,000 hectograms per hectare in various countries. Soybeans, Maize, and Wheat also show considerable yield variations across regions.
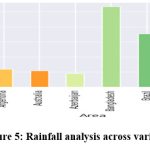 |
Figure 5: Rainfall analysis across various countries |
We have total 7 such figures for analysis of rain fall and we have concluded from the bar graph that Top nations for rainfall: Papua New Guinea, Ecuador, Suriname, Bangladesh, Colombia, Guyana, Indonesia, and Nicaragua get more than 2000 mm of rain annually.
Saudi Arabia, Pakistan, South Africa, Mali, Mauritania, Morocco, Niger, Libya, Iraq, Egypt, Azerbaijan, and Algeria are among the nations with the least amount of rainfall, with an average of less than 500 mm.
Top nations that use pesticides: Argentina, Brazil, and Italy France: Using more than 80,000 tonnes of pesticides might be detrimental for a nation that produces excellent yields. Japan is a high-producing nation that uses more than 60,000 tonnes of pesticides. Among the nations that use the fewest pesticides are Algeria, Angola, Azerbaijan, Bulgaria, Burkina Faso, Burundi, Cameroon, Central African Republic, Croatia, Egypt, El Salvador, Greece, Guinea, Guyana, Haiti, Honduras, Hungary, Indonesia, Iraq, Jamaica, Kenya, Kazakhstan, Libya, Madagascar, Malawi, Mali, Mauritana, Mauritius, Mozambique, Nepal, Niger, Papua New Guinea, Rwanda, Senegal, Saudi Arabia, Sri Lanka, Suriname, Tajikistan, Uganda, Zambia, imbabwe, Uruguay The least amount of pesticides used countries include all low-yielding nations. The top producing nations are the United Kingdom, Australia, and Germany, and they use an average amount of pesticides around 30,000 tonnes. The figure tells Brazil’s output began with modest yields and increased as it applied an increasing amount of pesticides. But Argentina, Australia, and Algeria produced more output than Brazil ever could, despite using less pesticides overall. Figure tell Yams are the item that uses pesticides the most, while plantains and other foods use the least.
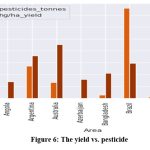 |
Figure 6: The yield vs. pesticide |
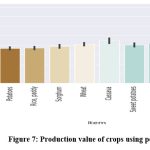 |
Figure 7: Production value of crops using pesticide |
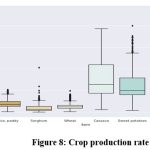 |
Figure 8: Crop production rate |
Above figure 8 concluded that Top-producing crops: cassava and potatoes/the least productive crops include rice, paddy, soybeans, sorghum, wheat, and maize.
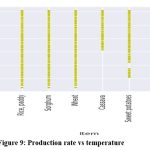 |
Figure 9: Production rate vs temperature |
Above figure 9 concluded that all other foods can grow at any temperature range, although some, like plantains, cassava, and yams, require more than 15 average temperatures to thrive.
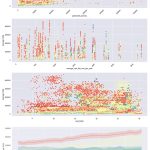 |
Figure 10: Relationship among various factors. |
It seems that from the figure 10 production of goods declines as rainfall increases for more than 2500 avg_temp: it indicates that average yield declines as average temperature falls below 5. pesticides_tonnes: it seems that production of goods drops as pesticides increases.
Results and Discussion
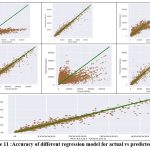 |
Figure 11 :Accuracy of different regression model for actual vs predicted values |
Table 3: Model accuracy before K folds validation
| Model Accuracy | MSE | R2_score | ||
| 0 | Linear Regression | 0.073724 | 6.293719 | 0.073724 |
| 1 | Random Forest | 0.985628 | 9.765432 | 0.985628 |
| 2 | Gradient Boost | 0.831140 | 1.147346 | 0.831140 |
| 3 | XGBoost | 0.974317 | 1.745043 | 0.974317 |
| 4 | KNN | 0.288206 | 4.836388 | 0.288206 |
| 5 | Decision Tree | 0.976174 | 1.618903 | 0.976174 |
| 6 | Bagging Regressor | 0.985881 | 9.593398 | 0.985881 |
With higher accuracy and lower mean square error (MSE), the Random Forest, XGBoost, Decision Tree, and Bagging Regressor models demonstrate much superior predicting skills. Although they are both rather good, Linear Regression and Gradient Boost are less accurate and have comparatively more faults. Among these models, KNN, on the other hand, has the worst performance, with low accuracy and noticeably large error rates.
Table 4: Model accuracy after applying K folds cross validation
| Model Accuracy | MSE | MAE | MAPE | R2_score | ||
| 0 | Linear Regression | 0.073724 | 6.293719 | 60955.31 | 2.419536 | 0.073724 |
| 1 | Random Forest | 0.985628 | 9.765432 | 3480.84 | 0.102571 | 0.985628 |
| 2 | Gradient Boost | 0.831140 | 1.147346 | 21184.66 | 0.596784 | 0.831140 |
| 3 | XGBoost | 0.974317 | 1.745043 | 7073.08 | 0.198378 | 0.974317 |
| 4 | KNN | 0.288206 | 4.836388 | 47716.35 | 1.631186 | 0.288206 |
| 5 | Decision Tree | 0.976174 | 1.618903 | 3559.26 | 0.096101 | 0.976174 |
| 6 | Bagging Regressor | 0.985881 | 9.593398 | 3450.50 | 0.101199 | 0.985881 |
The thorough analysis shows that while KNN and Linear Regression perform poorly, Random Forest, XGBoost, Decision Tree, and Bagging Regressor constantly produce excellent outcomes. Even though it performs admirably, Gradient Boost is not quite as good as the best models.
Enhancements for Model Accuracy: To further enhance model accuracy, several strategies can be considered:
Feature Engineering: Explore better utilization of existing features or introduce new pertinent features to improve model fitting.
Parameter Tuning: Adjust model parameters or perform hyperparameter tuning to optimize the efficiency of each model.
Ensemble Methods: Leverage ensemble methods to combine the strengths of multiple models for improved overall performance.
More Data: Consider expanding the dataset, as a larger and more diverse dataset can lead to improved model generalization.
Conclusion
The study concludes by highlighting the remarkable predictive powers of the Decision Tree, Random Forest, XGBoost, and Bagging Regressor models in predicting agricultural yields. These models routinely outperform others, exhibiting reduced error rates and increased accuracy. Potential strategies for enhancing model performance are also suggested by the research, including feature engineering, parameter adjustment, using ensemble techniques, and growing the dataset.
By putting these improvements into practice, we can raise the models’ accuracy even more and help provide more accurate and precise projections of crop production. This is in line with the overarching objective of improving agricultural decision-making and encouraging sustainable methods.
Acknowledgment
I sincerely thank all the people and DAVV that helped with this study project by lending their knowledge, direction, and assistance.
We would like to sincerely thank [Dr.Anita Seth] for all of their help during this study, including their insightful comments, important assistance, and unshakable support. The direction and caliber of this study have been greatly influenced by their knowledge and mentoring.
Funding Sources
No funding resource has been required to carry out this research.
Conflict of Interest
We do not have any conflict of interest; all the data set used for this work is publically available
Data Availability Statement
The data set is taken from the kaggle and the reference has been made.
Authors’ Contribution
Author has collected the dataset from the kaggle and implement the methodology by his own.
Reference
- Kumar, Y. Kumar, V. Kukreja, A. Bansal and A. Bhattacherjee, “High Performance EDA and LDA Analysis: An Application for Wheat Yield Estimation,” 2023 3rd International Conference on Advances in Computing, Communication, Embedded and Secure Systems (ACCESS), Kalady, Ernakulam, India, 2023, pp. 163-167, doi: 10.1109/ACCESS57397.2023.10200446.
CrossRef - Thomas van Klompenburg, Ayalew Kassahun, Cagatay Catal,Crop yield prediction using machine learning: A systematic literature review,Computers and Electronics in Agriculture,Volume177,2020,105709,ISSN016899,https://doi.org/10.1016/j.compag.2020.105709.
CrossRef - J. N. Kumar, V. Spandana, V. S. Vaishnavi, K. Neha and V. G. R. R. Devi, “Supervised Machine learning Approach for Crop Yield Prediction in Agriculture Sector,” 2020 5th International Conference on Communication and Electronics Systems (ICCES), Coimbatore, India, 2020, pp. 736-741, doi: 10.1109/ICCES48766.2020.9137868.
CrossRef - Junliang Fan, Jing Zheng, Lifeng Wu, Fucang Zhang,Estimation of daily maize transpiration using support vector machines, extreme gradient boosting, artificial and deep neural networks models,Agricultural Water Management,Volume 245,2021,106547,ISSN 0378-3774,https://doi.org/10.1016/j.agwat.2020.106547.
CrossRef - Keerthana, K. J. M. Meghana, S. Pravallika and M. Kavitha, “An Ensemble Algorithm for Crop Yield Prediction,” 2021 Third International Conference on Intelligent Communication Technologies and Virtual Mobile Networks (ICICV), Tirunelveli, India, 2021, pp. 963-970, doi: 10.1109/ICICV50876.2021.9388479.
CrossRef - Kolipaka, V. R. R. ., & Namburu, A. . (2023). K-Fold Validation of Multi Models for Crop Yield Prediction with Improved Sparse Data Clustering Process . International Journal of Intelligent Systems and Applications in Engineering, 11(10s), 454–463. Retrieved from https://www.ijisae.org/index.php/IJISAE/article/view/3300
CrossRef - Kolipaka, V. R. R. ., & Namburu, A. . (2023). K-Fold Validation of Multi Models for Crop Yield Prediction with Improved Sparse Data Clustering Process . International Journal of Intelligent Systems and Applications in Engineering, 11(10s), 454–463. Retrieved from https://www.ijisae.org/index.php/IJISAE/article/view/3300
CrossRef - Sjoukje A. Osinga, Dilli Paudel, Spiros A. Mouzakitis, Ioannis N. Athanasiadis,Big data in agriculture: Between opportunity and solution,Agricultural Systems,Volume 195,2022,103298,ISSN 0308-521X,https://doi.org/10.1016/j.agsy.2021.103298.
CrossRef - Thomas van Klompenburg, Ayalew Kassahun, Cagatay Catal,Crop yield prediction using machine learning: A systematic literature review,Computers and Electronics in Agriculture,Volume 177,2020,105709,ISSN 0168-1699,https://doi.org/10.1016/j.compag.2020.105709.
CrossRef - Zhang, Q.; Liu, Y.; Gong, C.; Chen, Y.; Yu, H. Applications of Deep Learning for Dense Scenes Analysis in Agriculture: A Review. Sensors2020, 20, 1520. https://doi.org/10.3390/s20051520
CrossRef - Daniela Lo Presti, Joshua Di Tocco, Carlo Massaroni, Sara Cimini, Laura De Gara, Sima Singh, Ada Raucci, Gelsomina Manganiello, Sheridan L. Woo, Emiliano Schena, Stefano Cinti,Current understanding, challenges and perspective on portable systems applied to plant monitoring and precision agriculture,Biosensors and Bioelectronics,Volume 222,2023,115005,ISSN 0956-5663,https://doi.org/10.1016/j.bios.2022.115005.
CrossRef - https://www.nass.usda.gov/Statistics_by_Subject/index.php?sector=CROPS