
Introduction
Pomegranate (Punica granatum L.) is an oasis crop that grows in arid and semiarid regions. Among the farmers, Pomegranate has great economic significance. In pomegranate production, India has been the leading country since 2013.1,2 Pomegranate has great export potential worldwide, but only 6% of the total production has been exported from India.3 In India, Maharashtra is the highest pomegranate-producing state, and more than 80% pomegranate crop area exists in Maharashtra.4 Pomegranate is commercially cultivated in regions of Maharashtra such as Nasik, Ahmednagar, Solapur, Pune, Sangli, Satara, Dhule, Aurangabad, Latur, and Osmanabad,. The yield per hectare is less than 6.7 tons in India, whereas countries like China, Iran, Israel, Spain, etc. have a higher per hectare yield of 39.5tons.5 The pomegranate required maximum irrigation during the fruit growth phenological state. The prime reason for low productivity is water scarcity in most regions of Maharashtra. Medium to low soil is best for growing a pomegranate. These soils have low water-holding capacity and good drainage properties. Hence water requirement is always high in such types of soil. The crop water requirement depends on management strategies, the age of the plant, location, and season.6 Crop water requirements can be found using methods like Thronthwaite and Christiansen, Blaney-Criddle, Penman, Modified Penman, Penman-Monteith, Pan Evaporation, Radiation, and Hargreaves-Samani, which are significant.7,8 To find the crop water requirement, daily data of weather parameters is required. The water requirement mostly depends upon actual evapotranspiration (ETc).9 Precise instruments, climatic parameters data, and soil moisture measuring devices are required to measure actual evapotranspiration.10 FAO Penman-Monteith method seems like the standard recommended method.1 To find the crop water requirement crop coefficient (kc) is one of the most important factors.11,12 The estimation of k and reference evapotranspiration (ET ) key component for the irrigation pomegranate crop.13,14 In the study area ( Nashik, Maharashtra), most farmers don’t know the exact supply of water as per the water requirement of the crop, and most of the farmers are confused about which method of surface irrigation is more efficient in concerned to pomegranate yield.9 Hence, it is a need of time to find out the best suitable method for pomegranate crops for better yield and quality. This study aims to find out the best suitable irrigation method using actual experimental data for three years on the pomegranate field.
This study uses five different surface watering techniques in a field experiment on a pomegranate orchard. Free flooding (FF), drip irrigation with two emitters (DI2), drip irrigation with three emitters (DI3), micro-irrigation with one lateral (MI1), and micro-irrigation with two laterals (MI2) are employed irrigation technologies in this experimental investigation. This study aims to identify the most productive and economically feasible irrigation method among the five specified irrigation systems for pomegranate crops.
Materials and Methods
This research is done by conducting experimentation work on the pomegranate (Punica granatum L.), which is cultivated in the Nashik of India’s West Agro-Climatic Zone (WACZI) at 20o04’19 N, 73o54’05 E, and 585m MSL. The research region features a flat topography, a semiarid climate, 600 mm of annual rainfall on average, and a maximum dry season from April to June. For the years 2020–2022, climatological monthly average data are gathered from the Indian Meteorological Department (IMD) and the Nashik Meteorological Station. In Figure 1, the time series of monthly averaged climatological parameters is displayed. During the monsoon (rainy) season, which runs from July through October, the total amount of precipitation ranges from 300 to 850 mm. Additionally, it has been noted that the winter season, from November to February, has the lowest temperature, and the summer season, from April to June, has the highest temperature. According to meteorological factors, evapotranspiration (ETo), wind speed, and sunshine hours change.12
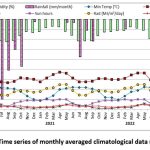 |
Figure 1: Time series of monthly averaged climatological data (2020-2022) |
The CROPWAT-8.0 model was used to determine the Pomegranate plant’s water needs.8 The CROPWAT-8.0 aims to determine crop water demand and irrigation scheduling based on data input in the specified format.15 FAO recommendations served as the foundation for the CROPWAT-8.0 calculating processes 1.1 This makes it simple for the user to take into consideration a variety of soil, meteorological, and agricultural data while determining crop water requirements, irrigation plans, and supply. Evapotranspiration (ETo) was determined using the Penman-Monteith theory. The crop’s evapotranspiration can be calculated using the Penman-Monteith method, climatic data, air resistance factors, and crop resistance factors.13 Despite the lack of crop-specific data, Penman-Monteith models were used to determine the evapotranspiration (ETo). The coefficient of Crop (Kc) is the name given experimentally to the calculated ratio of ETc•ETo-1. It was also used to calculate ETc from ETo. The values of water requirement of pomegranate plantation spaced at 3.5*2.5 m vary with Bahar (seasons) such as Ambe Bahar (January to July), Hasta Bahar (October to April), and Mrig Bahar (June to December). The crop coefficient values climbed from 0.22 to 1.10 over the time from the commencement of new leaves to crop growth, and during the maturity stage, the Kc values were close to 1.2. Due to the drop of leaf, water sprouts, breakdown of the foliage, and harvesting of fruit, the Kc decreased from 1.14 to 0.65 at harvesting.15 Stages of Crop are taken as Ambe Bahar (January to August) for the entire three years. The evapotranspiration is determined with Equation 1.16
![]()
Primarily, five irrigation methods are designed and mounted in the field. The graphic view of five methods, such as FF, DI2, DI3, MI1, and MI2, is presented in Figure 2. In a pomegranate orchard, in a North-South direction, plant rows are placed with 10 plants in one row, with a 2.5-meter distance between two lines. Data from experimental results were collected from 8 plants; one plant of each side is considered a border plant. The pomegranate plant is trained as one main stem and five to six sub-branches. Maximum plant height is controlled up to 2.1 meters for the convince of spraying and labor activity. Observations of the experiment are recorded for five different irrigation methods. Moisture level is supervised in 30 cm and 60 cm penetration, at location of the same location.
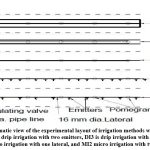 |
Figure 2: Schematic view of the experimental layout of irrigation methods where FF is free flooding, DI2 is drip irrigation with two emitters, DI3 is drip irrigation with three emitters, MI1 is micro irrigation with one lateral, and MI2 micro irrigation with two laterals. |
The five irrigation systems, such as FF, DI2, DI3, MI1, and MI2, are installed at the study plot. The PVC pipeline of 65 mm is a main pipeline, and it is the same in all methods. In the FF irrigation method, water is openly applied on the surface of the soil, traditionally with a discharge of 0.4 m3·s–1. Drip irrigation has a regular 16 mm lateral attached to the sub-main pipeline of size 65 mm. In the DI2 irrigation method, two emitters of a capacity of 8 liters ·h–1 are installed between two pomegranate plants. In the DI3 irrigation method, 3 emitters of a capacity of 8 liters ·h–1 are installed between two pomegranate plants. In MI1 single lateral line with inbuilt emitters is placed near the pomegranate plants, and in MI2 double lateral line with inbuilt emitters is placed both side of the pomegranate plants. Micro irrigation has regular 16 mm lateral and with inbuilt 2 liter ·h–1 capacity emitters of an interval of 45 cm. The pipeline of sub-main of size 65 mm is connected to the lateral Micro Irrigation. Since water release changes with pressure, regulation has been complete using a water pressure meter with a range of 50 to 400 kPa. Every time there is an irrigation schedule, the water pressure is measured, and the water amount delivered to the trees is adjusted.
In comparison to placing them at separate locations, two sensors placed at different depths at the same position provide more useful information.17 Capacitive ECH2O sensors from Decagon Devices are placed for measuring soil moisture. According to the manufacturer’s statement, sensors have a resolution of 0.002 m and a 2% error margin. According to IS2720 part 2, a soil mass’s water content is determined by dividing the quantity of water in voids by the quantity of solids, as per equation (2) below.
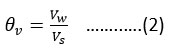
Where: Vs = the volume of soil, m3, Vw = the volume of water, m3; θv =soil moisture, m3.m-3;
The application of fertilizer and the characteristics of the soil affect pomegranate yield.18 On the test site, organic fertilizers including composted rodent waste, cow urine, and decomposed cow dung were employed. Crop growth depends on the biochemical characteristics of the soil. The root zone is often found 10 to 30 cm under the surface. As a result, a soil sample was taken from each of the four corners of the experimental site, at a depth of 30 cm. For irrigation and crop output, soil biochemistry and physical characteristics are crucial. The National Horticulture Research and Development Centre (NHRDC), located in Nashik, investigated the soil’s characteristics. The soil texture at the trial site was silt loam, with a water-holding capacity of 0.30 m3 m-3 and a wilting point of 0.19 m3 m-3, according to the testing report. Table 1 lists the biochemical characteristics of the soil.
Table 1: Properties soil with Biochemical characteristic in the Pomegranate orchard.
| Magnesium mg·kg–1 | Sulphur mg·kg–1 | Chlorides mg·kg–1 | Calcium carbonate % | Iron mg·kg–1 | Copper mg·kg–1 | Zinc mg·kg–1 | Manganese mg·kg–1 |
| 245.2 | 8.7 | 1.72 | 12.2 | 1.787 | 2.632 | 0.879 | 2.326 |
| Electric cond- uctivity dS·m–1 | Nitrogen kg·ha–1 | Organic carbon % | pH | Potassium kg·ha–1 | Phosphorus kg·ha–1 | Sodium mg·kg–1 | Calcium mg·kg–1 |
| 0.241 | 450.9 | 0.92 | 8.41 | 370.0 | 24.20 | 242.2 | 702.0 |
The descriptive statistical analysis of the result has been carried out with mean, standard deviation, and coefficient of variance. In this analysis, pomegranate yield, water productivity, number of fruits per plant, and fruit weight have been selected. Microsoft Excel Statistical Analysis Pack-2010 was used to do the statistical analysis.
Materials and personnel costs were regarded as being subject to market rates. The initial cost of an irrigation system, which is a requirement for all irrigation systems, was the cost of laying the fencing line, installing the electric pump, and establishing the pipelines. All irrigation systems have distinct material and setup costs. After pomegranates were sold in the market, the net profitable result was used to determine the value of irrigation systems. Per plant, benefit-cost analyses were conducted.
Results and Discussions
Irrigation scheduling depends on evapotranspiration and effective rainfall and is calculated with the help of the CROPWAT-8.0 model.18 Details are as shown in Figure 3.
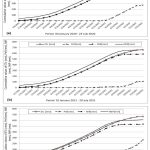 |
Figure 3: climatic parameters and water balance with the for crop year 2020; 2021; 2022; |
In all three research years, the cumulative ETc was consistently observed to be between 650 and 700 (mm) under regular conditions, as shown in Figure 3. The drip system is proven to be the maximum cost-effective for irrigating pomegranates based on evapotranspiration at a four-day interval.19 In contrast to the other two years, the year 2020 had the lowest reported net irrigation demand (500 mm), and this difference can be attributed to more productive precipitation than the other two years. All four irrigation techniques, except the FF method, are effective in meeting crop water demand when it is needed. Soil moisture varies continuously based on evaporation, water release, and the method of irrigation. It is quite interesting to observe the month-wise soil moisture variation. Using an irrigation water supply, the wetness level is consistently retained in April and May. Due to the monsoon season’s precipitation, the moisture is constantly retained the July. Figure 4 shows soil moisture variation concerning free flooding, drip irrigation, and micro irrigation methods throughout the period 01 January 2020 to 31 July 2020.
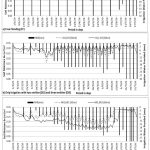 |
Figure 4: Time series of observed atdepth of 30 cm and 60 cm using the a) Free Flooding (FF) (1 January 2020 to 31 July 2020) b) Drip Irrigation with two emitters (DI2) and three emitters (DI3) (1 January 2020 to 31 July 2020) c) Micro Irrigation with one lateral (MI1) and two laterals (MI2) (1 January 2020 to 31 July 2020). |
According to Figure 4, the FF irrigation method shows a sudden increase in moisture level at 30cm and 60cm depth because of the instant release of water. Whereas, in the DI2 and DI3 methods, the moisture level has observed always higher at 60 cm. It means the moisture level is maintained in the DI3 and DI2 methods. In the MI1 and MI2 methods, moisture at 60cm depth is always observed to be lower as compared to 30cm depth. Water always reaches the top root zone. Surface evaporation losses are higher in MI1 and MI2 systems. It is mainly because the surface of the Earth contact with sunlight and air, hence the evaporation rate is always high at the surface of the Earth as compared to the deep portion of the Earth.20
Table 2 shows the recorded data of Pomegranate yield (kg/plant), Fruits per plant, water productivity (kg/m3), Fruit weight (gm), and Water Productivity (kg/m3) concerning five irrigation methods. Observations are taken on 8 plants allotted to each irrigation method. The mean, standard deviation (SD), and coefficient of variance (CV%) of collected results are shown in Table 2.
Table 2: Experimental data of Pomegranate yield (kg/plant), Fruits per plant, water productivity (kg/m3), Fruit weight (gm), and Water Productivity (kg/m3) with reference to five irrigation methods (2020 to 2022)
| Types of Irrigation | Year | 2020 | 2021 | 2022 | ||||||
| Statistics | Mean | SD | CV(%) | Mean | SD | CV(%) | Mean | SD | CV(%) | |
| FF | Yield (kg/plant) | 8.9 | 1.4 | 16.1 | 8.6 | 0.9 | 11.1 | 8.3 | 1.2 | 14.8 |
| Fruits per Plant | 42.4 | 5.3 | 12.6 | 41.3 | 4.7 | 11.5 | 39.8 | 4.7 | 11.9 | |
| Fruit weight (gm) | 177.5 | 28.6 | 16.1 | 171.3 | 19.0 | 11.1 | 165.0 | 24.5 | 14.8 | |
| WP (kg/m3) | 2.2 | 0.4 | 16.1 | 2.1 | 0.2 | 11.1 | 2.1 | 0.3 | 14.8 | |
| DI2 | Yield (kg/plant) | 11.4 | 1.3 | 11.8 | 11.5 | 1.9 | 16.1 | 11.1 | 1.5 | 13.3 |
| Fruits per Plant | 57.0 | 6.7 | 11.7 | 57.6 | 9.1 | 15.9 | 55.4 | 7.3 | 13.2 | |
| Fruit weight (gm) | 227.5 | 26.8 | 11.8 | 230.0 | 37.1 | 16.1 | 221.3 | 29.3 | 13.3 | |
| WP (kg/m3) | 2.8 | 0.3 | 11.8 | 2.9 | 0.5 | 16.1 | 2.8 | 0.4 | 13.3 | |
| DI3 | Yield (kg/plant) | 14.9 | 0.8 | 5.2 | 15.8 | 1.2 | 7.6 | 15.1 | 1.4 | 9.2 |
| Fruits per Plant | 71.4 | 4.6 | 6.4 | 68.6 | 4.2 | 6.0 | 70.1 | 4.6 | 6.6 | |
| Fruit weight (gm) | 323.1 | 23.6 | 7.2 | 315.0 | 24.0 | 7.6 | 301.3 | 27.6 | 9.2 | |
| WP (kg/m3) | 3.6 | 0.3 | 8.4 | 3.9 | 0.3 | 7.6 | 3.8 | 0.3 | 9.2 | |
| MI1 | Yield (kg/plant) | 10.6 | 1.5 | 13.9 | 9.4 | 1.7 | 18.0 | 9.8 | 1.4 | 14.2 |
| Fruits per Plant | 52.8 | 7.4 | 14.0 | 47.1 | 8.6 | 18.1 | 48.1 | 6.5 | 13.4 | |
| Fruit weight (gm) | 211.3 | 29.3 | 13.9 | 187.5 | 33.8 | 18.0 | 196.3 | 27.8 | 14.2 | |
| WP (kg/m3) | 2.6 | 0.4 | 13.9 | 2.3 | 0.4 | 18.0 | 2.5 | 0.3 | 14.2 | |
| MI2 | Yield (kg/plant) | 11.4 | 1.3 | 11.8 | 11.5 | 1.9 | 16.1 | 11.1 | 1.5 | 13.3 |
| Fruits per Plant | 56.9 | 6.6 | 11.5 | 57.3 | 9.6 | 16.7 | 55.1 | 7.4 | 13.5 | |
| Fruit weight (gm) | 227.5 | 26.8 | 11.8 | 230.0 | 37.1 | 16.1 | 221.3 | 29.3 | 13.3 | |
| WP (kg/m3) | 2.8 | 0.3 | 11.8 | 2.9 | 0.5 | 16.1 | 2.8 | 0.4 | 13.3 | |
According to Table 2, the DI3 method shows a low coefficient of variance in all three years for yield, fruits per plant, fruit weight, and water productivity among all three study years. Results obtained from the DI3 method are relevant as per mean, coefficient of variance (CV%), and standard deviation (SD), indicating the best scenario of outcome of the DI3 method.5 The MI1 method shows a high coefficient of variance for the same parameters. Figure 5 shows pomegranate yield (kg/plant) for five irrigation systems (the years 2020 to 2022)
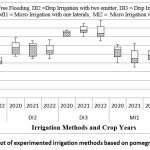 |
Figure 5: Performance plot of experimented irrigation methods based on pomegranate yield (2020-2022). |
According to the performance plot in Figure 5, which compares the five irrigation systems, the DI3 produces the highest yield among them all and 50–55 percent more pomegranate yield than the FF method, which is the irrigation method most frequently used in the study area from 2020 to 22. During the study year (2020–2022), the MI2 approach exhibits a yield of pomegranates that is 20–31% higher than the FF method. In this study (2020–2022), the DI2 approach yields 22–30% more pomegranates than the FF method. The MI1 method is showing 2 to 10% more pomegranate yield than the FF method during the period under this study (2020-22). Pomegranate yield depends on the irrigation system and fertilizer use.21 In drip irrigation yield is maximum as compared to other methods.22
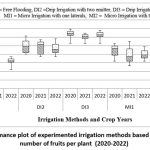 |
Figure 6: Performance plot of experimented irrigation methods based on Pomgranete number of fruits per plant (2020-2022). |
Figure 6 shows that, DI3 method is producing the highest number of fruits overall and 50–60% more pomegranate fruits than the FF method, MI2 method displays 11 to 30% more pomegranate fruits during the study period (2020-2022). The DI2 method shows 15 to 25 % more pomegranate fruits than the FF method during this study (2020-22). The number of pomegranate fruits is higher in well-water management crops as compared to free-flooded crops.23 The quantity of fruit on a pomegranate tree depends on water management during the stress period and optimum irrigation during the flowering phenological stage of pomegranate.24,15
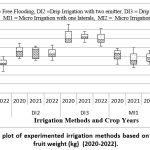 |
Figure 7: Performance plot of experimented irrigation methods based on Pomegranate average fruit weight (kg) (2020-2022). |
From the performance plot, as shown in Figure 7, the DI3 method is showing the highest fruit weight as compared to all other methods and observes 50 to 65% more pomegranate fruit weight as compared to the FF method, which is commonly used in the irrigation method during 2020-22. The MI2 method is showing 11 to 30% more pomegranate fruit weight as compared to the FF method for the study period (2020-22). Alternate irrigation systems in sustainable agriculture reduce fruit yield.14,24 Pomegranate fruit weight depends on several factors, but irrigation is the prime factor among all parameters.25,20
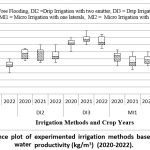 |
Figure 8: Performance plot of experimented irrigation methods based on Pomegranate water productivity (kg/m3) (2020-2022). |
From the box plot, as shown in Figure 8, the DI3 method is showing the highest water productivity as compared to all other methods and observes 55 to 64% more pomegranate fruit weight as compared to the FF method, which is commonly used as the irrigation method in the study area during 2020-22. In the experimental period (2020–2022), the MI2 approach exhibits 22–31% greater water productivity than the FF method. In comparison to the FF approach, the DI2 method exhibits 20 to 29% greater water productivity during the research period (2020–2022). Water productivity of pomegranate plants depends upon the frequency of irrigation according to the demand of pomegranate plants.26,27 Drip irrigation with sufficient optimum irrigation fulfills the water requirement of the plant as per requirements.28,29
Pomegranate productivity and fruit quality utilizing each irrigation technique are taken into account to determine the benefits. For pomegranates of the same weight and grade, the yield and market prices are always the same. Thus, market rates are the same across all irrigation techniques. Table 3 below displays the findings of the cost-benefit analysis of tried-and-true irrigation techniques.
Table 3: Benefit cost analysis of irrigation methods
| Benefit and Cost each plant | DI2 | DI3 | MI1 | MI2 | |
| A | Gross charge of material (*INR) | 12 | 13 | 12 | 24 |
| B | Labor charges (INR) | 1 | 1 | 1 | 1 |
| C | The sum of labor and material (INR)(A+ B) | 13 | 14 | 13 | 25 |
| D | Life of materials (Years) | 10 | 10 | 10 | 10 |
| E | The total cost per year (INR) (C/ D) | 1.3 | 1.4 | 1.3 | 2.5 |
| F | Three years average yield (kg. plant-1) of designed method minus three years average yield (kg. plant-1) of FF method | 2.75 | 6.6 | 1.35 | 2.75 |
| G | Market Average rate (INR.kg-1) | 50.0 | 50.0 | 50.0 | 50.0 |
| H | Net per year benefit per plant (INR.plant-1) (K=(F*G) – E) | 137.50 | 333.33 | 67.70 | 137.5 |
| I | Benefit cost ratio (L=H/E) | 106 | 238 | 52 | 55 |
The highest value benefit-cost ratio, 238 for the DI3 method and 106 for the DI2 method, is shown in Table 3, indicating that these two strategies are more economically feasible than others. It has been demonstrated through experimentation that the DI3 approach results in the cultivation of high-quality pomegranates. It is acknowledged as a pomegranate of export quality in the marketplace. Pomegranate market prices are always influenced by fruit quality.30 The benefit-cost analysis leads to the conclusion that the DI3 approach is more economically feasible than the other alternatives.
Conclusion
According to experimental results and observation of the 2020-2022 periods it has been observed that irrigation systems respond differently in parameters such as yield, number of fruits per plant, fruit weight, and water productivity. The moisture level is always high at 60cm depth for DI2 and DI3 methods, whereas low in MI1 and MI2 methods. According to statistical analysis, the DI3 method shows low variation, and the MI1 method shows high variation in results. It has been found that DI emitters show 55% more yield, 65% more fruit weight, and 64% more water productivity as compared to traditional (FF) irrigation methods in all three years. Whereas DI2, MI1, and MI2 methods have low values in all outcome parameters as compared to the DI3 method. The benefit-cost ratio is highest in the DI3 method. Hence, this method is recommended for pomegranate crops.
Acknowledgement
The authors are thankful to the Krishiyog farmers’ producer group for their help in experimentation and farm availability.
Funding Source
Self-funded, the author(s) received no financial support for the research, authorship, and/or publication of this article.
Conflict of Interest
The authors do not have any conflict of interest.
Data Availability Statement
This statement does not apply to this article.
Ethics Statement
This research did not involve human participants, animal subjects, or any material that requires ethical approval.
Permission to reproduce material from other sources
Not applicable.
Author Contributions
Sharad Kadbhane: Conceptualization, Methodology, Writing – Original Draft., Data Collection, Analysis, Writing.
Vivek Manekar: Review & Editing.
References
- Jadhav T., Sharma J. Pomegranate cultivation is very promising. Indian Horticulture. 2007; 52: 30-31.
- Narayan P. and Chand S. Explaining status and scope of pomegranate production in India: An economic analysis Prem Narayan and Subhash Chand. International Research Journal of Agricultural Economics and Statistics. 2020; 11(2):157-165. DOI: 10.15740/HAS/IRJAES/11.2/157-165.
CrossRef - Holland, , Hatib, K., Bar-Ya’akov, I. Pomegranate: botany, horticulture, breeding. In: In: Janick, J. (Ed.), Horticultural Reviews 35. John Wiley and Sons, New Jersey, 2009; 127–191. DOI: 10.1017/S002185960008446X
CrossRef - APEDA.Product Profiles of Post-Harvest Manual for Export of Pomegranates, New Delhi. 2017;1-7.
- Gupta G. Fundamental of statistics. Himalaya Publishing House 1981; 7: 27.1-27.31.
- Holland, , Bar-Ya’akov, I. The pomegranate: new interest in an ancient fruit. Chron. Horticul. 2008; 48: 12–15.
- Vishwakarma, D. K., Kumar, R, Kurki, A. Eco-Hydrological Modeling of Soil Wetting Pattern Dimensions Under Drip Irrigation Systems. Heliyon. 2023; 9: 18078
CrossRef - Kumar, R., Nissa, R., Kumar, M. Moisture dynamics and irrigation modelling in apple trees using CROPWAT model in temperate region of India. Indian Journal of Agricultural Sciences, 2018; 88 (9): 1449–54.
CrossRef - Jalikop, H., Linked dominant alleles of inter-locus interaction result in a major shift in pomegranate fruit acidity of ‘Ganesh’ and ‘Kabul Yellow. Euphytica 2007; 158: 201–207. DOI: 10.1007/s10681-007-9443-1
CrossRef - Doorenbos , and Kasssam A.H. Yield response to Water. Irrigation and Drainage FAO Rome, Ital. 1979; 33 : 1-11.
- Allen , Pereira L.S., Raes D., Smith M. Crop evapotranspiration –Guidelines for computing crop water requirements. FAO Irrigation and Drainage Paper No. 56.. Rome, Italy. 1998; 17-27.
- Patil, D. and Gorantiwar, S.D. Probability analysis of weekly crop evapotranspiration of Rahuri region. International Journal of Agricultural Engineering. 2009; 2 (1): 68-71.
- Vishwakarma, D.K., Yadav, D., Kumar, R., Kumar, R., S.A., Mirzania, E., Kuriqi, A. Assessing the performance of various infiltration models to improve water management practices. Paddy and Water Environment. 2024. https://doi.org/10.1007/s10333-024-01000-9.
CrossRef - Ghamarnia , Arji I., Sepehri S., Norozpour S., Khodaei E. Evaluation and comparison of drip and conventional irrigation methods on sugar beets in a semiarid region. Journal of Irrigation Drainage Engineering, 2012; 362(1) :90–97. DOI: 10.1061/(ASCE)IR.1943-4774.0000362
CrossRef - Meshram T., Gorantiwar S.D., Mittal H.K., Singh N.V., Lohkare A.S. Water requirement of pomegranate (Punica granatum L.) plants up to five years of age. Journal of Applied Horticulture. 2012; 14(1):47-50. DOI:10.25073/2588- 1132/vnumps.4267
CrossRef - Steduto, Hsiao T.C., Fereres E., Raes D. Crop yield response to water. Irrigationand Drainage Paper. 2012; 66:270–275. DOI:10.1017/S0014479712001366
CrossRef - Parvizi, , Sepaskhah, A.R., Ahmadi, S.H. Effect of drip irrigation and fertilizer egimes on fruit yields and water productivity of pomegranate (Punica granatum(L.)Rabab) orchard. Agricultural Water Management. 2014; 146: 45 56. DOI:10.1016/j.agwat.2014.07.005.
CrossRef - Thomas T., Kendall C.D. Crop Water Use and Crop Coefficients of Maize in the Great Plains. Journal of Irrigation and Drainage Engineering 2018; 144(6): 1-13. DOI:10.1061/(ASCE)IR.1943-4774.0001309.
CrossRef - Kovachev , Pondev K. Determination of optimum drip irrigation regime for cultivar Pamid. Rasteniev’ dni Nauki. 1988; 25(5): 86–90.
- Kadbhane J., Manekar V.L., An experimental study of the surface and subsurface irrigation methods with respect to soil moisture on the grape yard. Journal of Waterand Land Development. 2017; 31(10): 73–85. DOI: 10.1515/jwld-2017-0005
CrossRef - Sheikh, K. Effect of growth regulators and hand thinning of flowers/fruits on size of pomegranate (Punica granatum L. ‘Ganesh’). Acta Horticulturae. 2015; 1089: 407-410. DOI: 10.17660/ActaHortic.2015.1089.55.
CrossRef - Gadge B., Gorantiwar S.D., Kumar Virendra and Kothari Mahesh Estimation of crop water requirement based on Penman-Monteith approach under micro-irrigation system. Journal of Agrometeorology. 2011; 13 (1): 58-61. DOI: 10.54386/jam.v13i1.1336
CrossRef - Venkatesha, , Yogish, S.N. Trends in area, production, and productivity of pomegranate-producing states of India. International Journal of Multidisciplinary Research and Development. 2016; 3(1): 356-359.
- Thomas T., Kendall C.D. Crop Water Use and Crop Coefficients of Maize in the Great Plains. Journal of Irrigation and Drainage Engineering 2018; 144(6): 1-13. DOI:10.1061/(ASCE)IR.1943-4774.0001309.
CrossRef - Laribi, I., Palou, L., Intrigliolo, D.S., Nortes, P.A., Rojas-Argudo, C., Taberner, V., Bartual, J., Pérez-Gago, M.B. Effect of sustained and regulated deficit irrigation on fruit quality of pomegranate Mollar de Elche’ at harvest and during cold storage. Agricultural Water Management, 2013; 125: 61-70. DOI:10.1016/j.agwat.2013.04.009
CrossRef - Kabuli, , Sharma, D.P., Singh, N. Effect of rejuvenation pruning on the growth, productivity, and disease incidence in declining trees of pomegranate (Punica granatumL.) Journal of Applied and Natural Science. 2018;10(1): 358-362. DOI:10.31018/jans.v10i1.1630
CrossRef - Ussahatanonta , Jackson D.I., Rowe R.N. Effect of nutrient and water stress on vegetative and reproductive growth in Vitis vinifera L. Australian. Journal of Grapeand Wine Research. 1996; 22: 64–69. DOI: 10.1111/j.1755-0238.1996.tb00096.x
CrossRef - Sheikh, K. Effect of growth regulators and hand thinning of flowers/fruits on size of pomegranate (Punica granatum L. ‘Ganesh’). Acta Horticulturae. 2015; 1089: 407-410. DOI: 10.17660/ActaHortic.2015.1089.55.
CrossRef - Venkatesha, , Yogish, S.N. Trends in area, production, and productivity of pomegranate-producing states of India. International Journal of Multidisciplinary Research and Development. 2016; 3(1): 356-359.
- Kahramanoğlu, İ., Usanmaz, Pomegranate Production and Marketing. CRC Press. 2016; 148: DOI: 10.1201/b20151
CrossRef