
Introduction
India has one of the highest population densities of any country in the world. Despite only 2% of the global land resources and 1.5% of the global forest regions, this country is home to 18% of the global human and 15% animal population. As a result, the Production of food grains holds a very high level of significance in economics, society, and politics. According to the 2011 census, there were 0.83 billion people who call rural areas their home. These represents approximately 70% of the entire population of the country. Many of these people lived in poverty. Rain-fed agriculture was the primary source of income for many people living in rural areas; as a result, the success or failure of the country’s crops is essential to the nation’s economic development. Around sixty years ago, the primary component of India’s budget was the country’s expectation of monsoon rains. This is still relevant in a significant way, even today. The majority of the nation’s precipitation falls between June and September, corresponding to the southwest monsoon. This season accounts for more than 70 percent of the yearly precipitation that falls throughout a significant area of the country. The amount and frequency of rain that falls during this season directly affect agricultural productivity. Despite the country’s tremendous achievements in putting more land under irrigation systems, the country’s overall rate of advancement in this field has slowed significantly in recent years. Agricultural Production’s reliance on rainfall can be reduced by irrigation, which also boosts both the reliability and output of crop production. A facility that draws water from various natural and artificial water sources, including rivers, canals, lakes, and so on, is used to irrigate approximately forty percent of the land under cultivation. Due to the scarcity of natural water sources, especially groundwater availability, it is challenging to maintain and grow existing irrigation infrastructure. A number of locations are experiencing a decline in groundwater levels, and several water bodies are drying up within a few months of the end of the monsoon season. With a population of more than 2 hundred million people, it is the most highly populated state in India and the most densely populated nation subdivision in the World. The state comprises 18 divisions and 75 districts, with Lucknow serving as the capital of the administrative portion while Prayagraj is the capital of the judicial portion. The State’s major industry is Agriculture as 80% of the population resides in rural regions, and 75% of total workforce are directly or indirectly envolved in agriculture or farming, contributing 27% of the state’s GDP. The most of families in the state rely on income from agriculture as their primary source of income. It has 11.56 million hectares of agricultural land, equivalent to 70 percent of the total geographical Area. Irrigation is used on more than 13.43 million hectares of land. Comparatively, 19.11 percent of agricultural households in Uttar Pradesh are made up of small and marginal farmers. This percentage is significantly higher in the eastern region. Rice, wheat, maize, sugarcane, chickpeas, Tur dal, mustard, lentils, black gram, and moong are some important crops grown. The majority of farmland is used for growing cereal grains like rice and wheat, which are considered to be the most essential crops. Rice is grown on 5.90 million hectares in Uttar Pradesh, making up about 13.5 percent of the country’s total rice production. Rice is the most essential crop in Uttar Pradesh. Uttar Pradesh is known for its pleasant weather, expansive tracts of fertile soil, abundant sunlight, and plentiful water supplies. The current level of cropping intensity is 153%. Rice is grown in this state at a rate that places it third in the nation. Rice cultivation in the state is especially susceptible to damage and peril due to the state’s complex ecological conditions, which are characterised by periodic floods, droughts, or both. Because of the unpredictability of the distribution of rainfall, which results in either excess water retention or drought over the years, the yield remained unchanged at 2.0 t q/ha from 2009 till 2010. In each of Uttar Pradesh’s 75 districts, rice is grown on farms ranging from very tiny to very large. It is included in almost every dish, and most farms in rural areas are dedicated to its Production. In comparison, just 35,000-40,000 hectares of rice are planted during the Zaid season. Most rice is farmed during the Kharif season on an area of approximately 5.90 million hectares. Only in extremely flooded regions of approximately 3,000 acres or more, particularly in the eastern districts of Uttar Pradesh, is Boro rice ever cultivated for human use. On average, about two tonnes of product are produced per hectare across the state. The growth of Agricultural productivity has remained a subject of intense debate in India’s scientific and policy making bodies. This debate has been going on for quite some time.1,2 The agricultural growth pattern throughout time at the national level has been the subject of a significant amount of research carried out all over the country in many separate studies. However, in order to develop strategic decentralized development strategies that will ensure inclusive growth in the country over the long term see,3-6 it is necessary to have an understanding of the pattern of agricultural growth and development at the regional level. States are the ideal administrative entities to investigate regional aspect of agricultural growth and development, hence this study aims to focused on Uttar Pradesh. The selection of the state was based on the fact that it has the biggest proportion (about 17%) in the total national food grain output and is, as a result, of apparent importance in ensuring the safety of the nation’s food supply. Agriculture is the primary contributor to the state’s economy. It is practised across a considerable section of the exceptionally fertile cultivated upper land and middle Gangetic plains and is responsible for employing approximately 59% of the workforce.7 Despite this, only a few studies conducted in recent years have considered Uttar Pradesh to be an crucial case see.8-11 Determinants of agricultural growth.12 Growth and instability was pulses production in Utter Pradesh and also Major food grain crops (wheat, rice, gram) was analysed12,13 This is because UP holds a prominent position in the agricultural development of the rest of the country. However, they have, for the most part, neglected to consider the factors driving productivity growth in the state. Knowledge of these factors is essential for accelerating agricultural growth through strategic measures. However, another study highlights increases in productivity as a key element for rural growth and development and alleviating economic hardship in Uttar Pradesh, Fertilizer and irrigation were acknowledged by14 as significant determinants of productivity growth. However, The social and institutional elements are not addresses by researcher that enhance a region’s productivity growth trend. Previous studies on assessing growth pattern of an area, Production, and productivity of crops were found to have assumed a linear relation of growth relationship with time.15-19 This was discovered through a survey of the relevant published literature on the topic. Because growth rarely occurs in a single direction, more accurate assessment of the rate of change in the growth rate across time more accurately represents any sudden increases or decreases in the growth rate.20 In light of this, we have endeavoured to examine the trends in growth of Area, yield, and productivity of food grains in Utter Pradesh, including their acceleration or deceleration over time. Furthermore, we have discovered the key drivers of food grain productivity at a more granular scale for the strategic planning purpose and prioritizing the resources allocation process to speed up productivity growth in the state. This study examined the agricultural output and productivity growth trend in Uttar Pradesh throughout time. Numerous studies and literature reviews have been conducted, but these areas have not been examined. Consequently, we are conducting an examination of these areas.
Material and Methods
This study employs secondary time series data spanning from 1990–91 to 2020–21 to examine the growth patterns in the area, production, and productivity of food grains. The data were various public resources.21 For a more detailed analysis, the dataset was divided into three distinct sub-periods: Sub-period I (1990–91 to 1999–00), Sub-period II (2000–01 to 2009–10), and Sub-period III (2010–11 to 2020–21). To evaluate trends in the area, productivity, and production of major food grains in Uttar Pradesh during these periods, a semi-log transformation model was applied, with a focus on estimating the Compound Annual Growth Rate (CAGR).
![]()
Equation 1,
parameters such as β₀ (intercept), g (growth rate), t (time), and u (error term)
![]()
The coefficient of variation (CV) was computed to accurately depict the variability and uncertainty in the area, productivity, and production of food grains in Uttar Pradesh.
![]()
Here, CV represents the Coefficient of Variation in percentage, while R² denotes the coefficient of determination derived from a time-trend regression, adjusted for degrees of freedom.
Results
Annual Growth Rate of Area, Productivity and Production in Uttar Pradesh
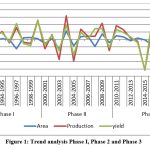 |
Figure 1: Trend analysis Phase I, Phase 2 and Phase 3 |
Figure 1 highlights the fluctuating trends in the area under foodgrain cultivation in Uttar Pradesh across different phases, indicating periods of both growth and decline. In Phase I, the area under foodgrain cultivation declined in specific years, including 1991–92, 1993–94, 1995–96, and 1996–97, with reductions of -3.02%, -0.48%, -0.21%, and -6.32%, respectively. Similarly, in Phase II, the area decreased during 2000–01, 2002–03, 2004–05, and 2009–10, with respective declines of -2.72%, -6.28%, -4.70%, and -2.20%. In Phase III, declines were observed in 2012–13, 2015–16, and 2017–18, with reductions of -0.86%, -3.60%, and -1.81%, respectively.
Phase I recorded the highest growth in foodgrain production in 1994–95 and 1996–97, with increases of 5.21% and 7.88%, respectively. However, negative growth was observed in 1991–92, 1995–96, 1997–98, and 1998–99, with declines of -3.02%, -2.34%, -1.94%, and -2.75%, respectively. In Phase II, the highest growth in foodgrain production occurred in 2003–04 and 2008–09, with increases of 16.01% and 11.01%, respectively. Conversely, negative growth was recorded in 2000–01, 2002–03, 2004–05, and 2009–10, with declines of -6.43%, -13.58%, -14.49%, and -7.56%, respectively. In Phase III, the highest growth was observed in 2010–11 and 2018–19, with increases of 9.38% and 6.37%, respectively. However, negative growth occurred in 2013–14 and 2014–15, with declines of -1.41% and -20.86%, respectively.
The reasons for the sharp decrease in food grain production and yield growth between the first and second phases remain largely unexplored. However, some studies suggest that this decline may be attributed to rainfall variability22 or possibly linked to a food grain-related scam that occurred during that period
Table 1: Campound Annual Growth rate of area productivity, and production in total Foodgrains Production.
| Periods | CAGR (Area) (%) |
CAGR Productivity (%) |
CAGR Production (%) |
| Sub-Period I | -0.44 | 2.32 | 2.19 |
| Sub-Period II | -0.49 | 0.61 | 0.11 |
| Sub-Period III | 0.06 | 2.02 | 2.09 |
| Overall | -0.30 | 1.74 | 3.32 |
Area in a million/hectares, Production in a million/tonne, Yield in Quintal/hectare
Source: Indiastat.com
Since the reform period, Uttar Pradesh has experienced notable growth in agricultural production and productivity. As presented in Table 1, the compound annual growth rate (CAGR) for the area under foodgrain cultivation declined from Sub-period I (1990–91 to 1999–2000) to Sub-period II (2000–01 to 2010–11), reflecting a negative trend that worsened from -0.44% in Sub-period I to -0.49% in Sub-period II. However, in Sub-period III (2010–11 to 2020–21), the CAGR for the area shifted to a positive growth rate of 0.06%.
In contrast, the CAGR for both the yield and production of food grains significantly declined between Sub-periods I and II. The yield’s growth rate dropped from 0.61% in Sub-period I to a minimal growth rate of 0.11% in Sub-period II. However, there was a remarkable improvement in Sub-period III, with the CAGR for yield and production rising substantially to 2.02% and 2.09%, respectively. Despite these observations, there is limited research on the causes behind the decline in the CAGR of yield and production during the transition from Sub-period I to Sub-period II. Some studies attribute the decline primarily to variations in rainfall during this period23Additionally, the decline may have been influenced by a food grain-related scam that occurred during the same timeframe.23
Trends analysis of total Food grains in Uttar Pradesh
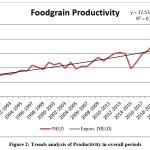 |
Figure 2: Trends analysis of Productivity in overall periods |
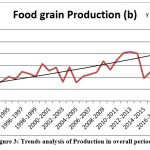 |
Figure 3: Trends analysis of Production in overall periods |
Figure 2 and figure 3 illustrates the productivity and production trends of total food grains. In 1990–91, total food grain production was recorded at 34.74 million tonnes (MT), with a productivity level of 12.30 quintals per hectare. During the post-reform period, both production and productivity of food grains exhibited consistent growth until 1997–98. However, a decline was observed over the following decade. Starting in 2017–18, a significant increase in total food grain production was recorded. Between 1990–91 and 2020–21, the compound annual growth rate (CAGR) for total food grain production was 3.32%, while productivity also exhibited growth consistent with other crops. The CAGR for productivity during the same period was 1.74%, indicating substantial improvements in agricultural practices. This growth can be attributed to the extensive use of machinery, fertilizers, and technological advancements in farming. The equations illustrated in Figures 1.1 and 1.2 further reveal that the CAGR for total food grain production and productivity during this period was approximately 1.1% and 1.3%, respectively. This underscores the steady advancement in Uttar Pradesh’s agricultural sector, driven by modernization and efficient resource utilization.
As presented in Table 2, the CDV Instability Index for the area under total foodgrains has shown a notable decline, dropping from 2.06 in Sub-period I to 1.35 in Sub-period III. In contrast, the CDV Instability Index for foodgrain productivity, which was 3.48% in Sub-period I, experienced a significant rise during Sub-period II, reaching 5.29%. This upward trend continued into Sub-period III, where the index further increased to 9.24%. Similarly, the CDV Instability Index for total foodgrain production in Uttar Pradesh displayed a sharp rise, increasing from 3.21% in Sub-period I to 6.78% in Sub-period II. This trend persisted with a slight further increase in Sub-period III, where the index was estimated at 9.83%. These trends highlight increasing variability in productivity and production over time, despite reduced instability in the area under cultivation.
Table 2: CDVI Index Average Area, Production, and Yield of Total Food grain.
| Periods | CDVI Index (Area)(%) | CDV I IndexProductivity
(%) |
CDV I IndexProduction
(%) |
| Sub–Periods I | 2.06 | 3.48 | 3.21 |
| Sub–Periods II | 2.4 | 5.29 | 6.78 |
| Sub–Periods III | 1.35 | 9.24 | 9.83 |
| Overall | 3.85 | 8.16 | 7.21 |
Area in million/hectares, Production in million/tonne, Yield in quintal/hectare
Source: Indiastat.com
Discussion
The annual growth rates of area, productivity, and production of food grains reveal significant trends and interconnections. As illustrated in Figure 1, the area under cultivation has fluctuated over the years, with some years recording increases and others experiencing declines. This variability is primarily attributed to factors such as urbanization and industrialization, which reduce the availability of agricultural land. The expansion of cities and industrial zones often encroaches upon fertile farmland, thereby limiting the area available for cultivation.24 Productivity, on the other hand, is influenced by advancements in agricultural technology and prevailing climatic conditions. Innovations such as the adoption of high-yield crop varieties, modern irrigation techniques, and improved farming practices play a pivotal role in boosting productivity. However, adverse weather events—such as droughts, floods, or erratic rainfall—can significantly impact productivity levels in specific years.25 The interaction between cultivated area and productivity directly affects overall production. Since production is determined by both the extent of agricultural land and the yield per unit area, fluctuations in either factor inevitably influence total output. For example, a reduction in cultivated area may lower production; however, this decline could be mitigated by improvements in productivity, potentially maintaining or even increasing output levels.26 Overall instability in the area, productivity, and total food grain production from Sub-period I to Sub-period II and Sub-period III was recorded at 3.85%, 8.16%, and 7.21%, respectively. Analysis of instability indicates that production and productivity exhibit greater variability compared to the area under total food grain cultivation. According to27 while agricultural growth and production have shown remarkable progress, the rising instability in production poses challenges. This instability affects price stability, impacts consumers, and increases the vulnerability of low-income populations to market fluctuations. Although new agricultural technologies enabled India to achieve significant growth in food production and approach self-sufficiency by the early 1980s, their impact on production stability remains a concern. Studies conducted 10 to 20 years after the adoption of these technologies suggest that instability in agricultural production has increased, as highlighted by earlier research see.28-30
Conclusion
This study analyzes growth and instability using the Compound Annual Growth Rate (CAGR) and the Cuddy-Della Valle index. It highlights fluctuations in the growth patterns of food grains, specifically in area, production, and productivity. Notably, the area devoted to food grains has been consistently declining, with the second analyzed period showing negative growth rates in both production and productivity. Additionally, trends in production and productivity displayed various fluctuations over time. The decline in food grain growth during the second period is primarily linked to changes in rainfall patterns. The Cuddy-Della Valle index indicated an increase in instability regarding the area under food grains during this sub-period. However, across the entire study period, instability in area showed a downward trend, while production instability increased. This rise in production instability is attributed to low productivity caused by inadequate rainfall and irrigation facilities, which hindered the adoption of modern agricultural inputs. Variability in productivity remains a significant concern, with substantial differences observed across districts within the state. To address this ongoing instability, large-scale implementation of stabilization measures, such as crop insurance, should be actively promoted. The study emphasizes the crucial role of modern inputs in enhancing agricultural productivity, identifying fertilizers as the most influential factor. Furthermore, improvements in irrigation infrastructure, access to irrigation sources, human resource development, and road connectivity are essential for strengthening the agricultural sector.
Acknowledgement:
The authors would like to thank AKI’s Poona College of Arts Science and Commerce Affiliated with Savitribai Phule Pune University Pune 411001, Maharashtra for necessary support.
Funding Sources
The author(s) received no financial support for the research, authorship, and/or publication of this article.
Conflict of Interest
The authors do not have any conflict of interest.
Data Availability Statement
This statement does not apply to this article.
Ethics Statement
This research did not involve human participants, animal subjects, or any material that requires ethical approval.
Author Contributions
Shakeel Akther: Conceptualization, Writing – Original Draft
Waseem Ahmad: Data Collections
Nargis Akhter Wani: Critical Review and Supervision
Shoaib Ansari: Supervision and Final Approval ; Writing – Original Draft
Reference
- Mahadevan, R (2003): “Productivity Growth in Indian Agriculture: The Role of Globalization and Economic Reform,” Asia-Pacifi c Development Journal, Vol 10, No 2, pp 57–72.
CrossRef - Tripathi, Amarnath and A R Prasad (2008): “Agricultural Productivity Growth in India,” Journal of Global Economy, Vol 4, No 4, pp 322–328, December.
CrossRef - Mathur, Archana S, S S Das and Surajit Das (2006): “Status of Agriculture in India: Trends and prospects,” Economic & Political Weekly, Vol 41, No 52, pp 5327–5336.
- Kumar, A., & Jain, R. (2013). Growth and Instability in Agricultural Productivity: A District Level Analysis §. Agricultural Economics Research Review, 26(conf), 31-42.
- Bhalla, G S and Gurmail Singh (2009): “Economic Liberalization and Indian Agriculture: A State Wise Analysis,” Economic & Political Weekly, Vol 44, No 52, pp 34–44.
- Singh, P., Goyal, M., & Choudhary, B. B. (2021). Drivers of foodgrain productivity in Uttar Pradesh. Economic & Political Weekly, 38, 40-45.
- Khan, A., Ansari, S. A., & hoaib Ansari, S. (2023). International Journal of Current Microbiology and Applied Sciences. J. Curr. Microbiol. App. Sci, 12(01), 196-202.
CrossRef - Singh, Gyanendra and H Chandra (2001): “Growth Trends in Area, Yield and Production of Foodgrains in Uttar Pradesh,” Agricultural Situation in India, Vol 58, pp 423–426.
- Zhou, X., Zhang, Y., Sheng, Z., Manevski, K., Andersen, M. N., Han, S., … & Yang, Y. (2021). Did water-saving irrigation protect water resources over the past 40 years? A global analysis based on water accounting framework. Agricultural Water Management, 249, 106793.
CrossRef - Sekhri, S. (2011). Public provision and protection of natural resources: Groundwater irrigation in rural India. American Economic Journal: Applied Economics, 3(4), 29-55.
CrossRef - Verma, S., Gulati, A., & Hussain, S. (2017). Doubling agricultural growth in Uttar Pradesh: sources and drivers of agricultural growth and policy lessons(No. 335). Working paper.
- Ansari, S., Ansari, S. A., & Rehmat, A. (2022). Determinants of instability in rice production: Empirical evidence from Uttar Pradesh. The Journal of Research ANGRAU, 50(3), 104-112.
- Ansari, S., Ali, N., & Rashid, M. (2022). Growth and instability of pulses production in Uttar Pradesh: A decomposition analysis. Asian Journal of Multidimensional Research, 11(1), 71-81.
CrossRef - Pandey, L., & Reddy, A. A. (2012). Farm productivity and rural poverty in Uttar Pradesh: A regional perspective. Agricultural Economics Research Review, 25(1), 25-35.
CrossRef - Reddy, A. A., & Bantilan, M. C. S. (2013). Regional disparities in Andhra Pradesh, India. Local Economy, 28(1), 123-135.
CrossRef - Sharma, V. P. (2012). India’s agricultural development under the new economic regime: Policy perspective and strategy for the 12th five year plan. Indian Journal of Agricultural Economics, 67(1).
- Sharma, V. P., De, S., & Jain, D. (2019). Managing agricultural commercialisation for inclusive growth in South Asia. Gates Open Res, 3(507), 507.
- Rao, C. H., Ray, S. K., & Subbarao, K. (1988). Unstable agriculture and droughts: implications for policy(No. 47, pp. vii+-192pp).
- Mishra, A. K., Mayorga, J., & Kumar, A. (2021). Technology and managerial gaps in contract farming: The case of specialty crop production. Journal of Agricultural and Resource Economics, 47(1), 77-96.
- Holt, J. K. (2008). Modeling growth using multilevel and alternative approaches. Multilevel modeling of educational data, 111-159.
- RBI (2025). Handbook of Statistics on Indian Economy; Indian state https://www.rbi.org.in/scripts/PublicationsView.aspx?id=22491
- Singh, R., Singh, H., & Raghubanshi, A. S. (2019). Challenges and opportunities for agricultural sustainability in changing climate scenarios: a perspective on Indian agriculture. Tropical Ecology, 60, 167-185.
CrossRef - Sharma, A. (2013). Trends of area, production and productivity of foodgrain in the north eastern states of India. Indian journal of agricultural research, 47(4), 341-346.
- Lata, S., & Lata, S. (2019). Sources of Irrigation: A Theoretical Framework. Irrigation Water Management for Agricultural Development in Uttar Pradesh, India, 49-80.
CrossRef - Kumar, S., Singh, V. K., Shekhawat, K., Upadhyay, P. K., Dwivedi, B. S., Rathore, S. S., … & Yadav, A. (2024). Enhancing productivity, economics and energy efficiency through precision nitrogen and water management in conservation agriculture-based maize (Zea mays) in the Indo-Gangetic Plains. The Indian Journal of Agricultural Sciences, 94(3), 333-336.
CrossRef - Kumar, S., Singh, V. K., Shekhawat, K., Upadhyay, P. K., Rathore, S. S., & Didawat, R. K. (2022). Real time nitrogen and irrigation management for enhanced productivity and nutrient use efficiency of maize under conservation agriculture. Annals of Agricultural Research, 43(2), 159-163.
- Sharma, B. R., Rao, K. V., Vittal, K. P. R., Ramakrishna, Y. S., & Amarasinghe, U. (2010). Estimating the potential of rainfed agriculture in India: Prospects for water productivity improvements. Agricultural Water Management, 97(1), 23-30.
CrossRef - Bahri, H., Annabi, M., M’hamed, H. C., & Frija, A. (2019). Assessing the long-term impact of conservation agriculture on wheat-based systems in Tunisia using APSIM simulations under a climate change context. Science of the Total Environment, 692, 1223-1233.
CrossRef - Hazell, P. B. (2010). An assessment of the impact of agricultural research in South Asia since the green revolution. Handbook of agricultural economics, 4, 3469-3530.
CrossRef - Chand, R., & Raju, S. S. (2009). Instability in Indian agriculture during different phases of technology and policy. Indian Journal of Agricultural Economics, 64(2).
Abbreviation
RBI: Researve Bank of India
CDVII: Cuddy-Della Valle Instability Index
Sub-period I: 1990-91 to 1999-2000
Sub- period II: 2000-01 to 2009-10
Sub-period III:2010-11 to 2020-21