
Introduction
Nigeria’s economy is largely dependent on export revenue that comes from various sectors of the economy. The petroleum sector is no doubt the chief export sector and major revenue earner of the Country. Since its discovery in the early 1930s, the sector has dominated the export market of the Country with a rapid increase in its contributions to gross domestic product (GDP) of the nation from 29% in 1980 to an approximate 52% in 2005.1 The oil sector succeeded the agricultural sector whose contribution to the economy fell from an initial 72% between 1955 and 1969 to 35% in the early 1970s.2 Accordingly, the price-water-house Cooper’s in 2016 reported that the petroleum sector accounted for about 91% of the total export of the Country while also generating about 85% of government foreign earnings. It further went on to say however that the contribution of the petroleum sector to total national employment was estimated to be only (4%), whereas about 75% of the people living in the country are directly or indirectly employed in agriculture; on-farm or off-farm. The foregoing has generated the necessity to diversify or shift the economic focus to agricultural development and enhanced commodity marketing and exportation.
The economy of the Country has continued to decline which is evident in the growing rate of unemployment in the country despite the contribution of petroleum sector in generating foreign earnings for the Country. It is pertinent therefore to move Nigeria away from operating a mono-product economy based on petroleum to a much more functional economy that effectively produces and exports a vast array of commodities. The survey of exportable agricultural commodities in the Okigwe agricultural zone in Imo State therefore seeks to show the abundant agricultural commodities that have export potentials and are cultivated in the zone. The study set to analyze the factors influencing the production and export of these commodities.
There is paucity of independent study on the availability of exportable commodities in the rural area.3,4 This has continued despite the relative abundance of these commodities in most rural communities. The need for such study has been identified by various scholars, institutions, and policymakers as sure mean of increasing the participation of small-scale rural farmers in main stream economic activities.5-7 They also argued that any pathway that can lift the large number of the rural poor farmers out of poverty would require some form of transformation of smallholder agriculture into a more commercial production and marketing system.8,9
There is therefore need to discover and bring these agricultural commodities with great economic potentials to become major players in the export sector of the economy. This research aims to enhance the marketing and exportation of these commodities.
The objectives of this study are to:
Describe the socio-economic attributes of people living in the study area.
Obtain the volume of selected exportable agricultural commodities in the study area.
Examine the factors affecting agricultural commodities exports in the study area.
Examine the price elasticity of demand for the selected Commodities in the study area.
Materials and Methods
This research work was carried out in Okigwe agricultural zone of Imo State. The zone has six (6) local government areas in it. They are Ehime Mbano, Isiala Mbano, Ihite Uboma, Obowo, Onuimo, and Okigwe Local Government Areas. The zone lies within longitude 6˚50E to 3˚35E and latitude 4˚30N to 6˚30N with an annual rainfall of 200mm. The rainy season begins from March to October. The Zone has an annual temperature range of between 25˚C to 28˚C.10
The primary occupation of the people living in the zone is agriculture and the zone is mostly occupied by rural dwellers living in the various parts of the rural communities found in all the six local government areas of the zone. The zone suffers the problem of rural to urban youth migration. Accordingly, the major crops produced include cash crops like cashew (Anacardium occidentials), Oil palm (Elaeis guineensis) and Cocoa (Theobroma cacao), and food crops including Yam (Dioscorea spp), cassava (Manihot spp) and Maize (Zea mays), to mention but a few.11 According to the consultative committee on agricultural exports commodities statistics, these commodities are cassava, cashew nut, and palm oil. Cassava and Palm oil are two of the major agricultural commodities that have production potentials in all the rural communities in the six local government areas of the zone.12,13
The selection of respondents and commodities involved many stages. First the commodities studied were purposively selected from the list of exportable agricultural commodities identified in the zone according to Consultative Committee on Agricultural Export Commodities Statistics (CCAECS 2010) studies, and they are palm oil, cassava and cashew nut.12
The secondly nine (9) markets were purposively selected from across the six (6) Local Government Areas of the Zone. The markets were selected to be able to capture the areas with greater quantities of the selected commodities and market activity, it was in such a way as to ensure that each commodity is present in at least two out of the nine (9) markets so selected. The study was market based because the interest is to identify the availability of the commodities in the area, examine the demand/supply responses to changes in prices which could be studied through the market behaviors and not on the productivity of the commodities. The supply and intermediary (retail and wholesale) market levels were considered.
The second selection was the selection of markets, for the purpose of this study, 9 markets were purposively selected across the six (6) local government areas of the zone. The markets were selected to be able to capture the areas with greater quantities of the selected commodities and market activity. It was also done in such a way as to ensure that each commodity is present in at least two out of the nine (9) markets so selected. The study was market based because the interest was to identify the availability of the commodities in the area and examine the demand/supply responses to changes in prices which could be studied through the market behaviors rather than the production of the commodities. The supply and intermediary (retail and wholesale) market levels were considered.
The last selection comprised of the marketers who were randomly selected from the market to get responses. For the purpose of this study, 15 respondents were selected from in each market, (5 respondents per commodity). However in the case where a particular commodity was not available in any of the market, the number of respondents selected for the available commodities was increased to make up for the shortfall and ensure that the target sample to be drawn from that market was maintained. However, a systematic random sampling was employed by taking a count of ten (10) marketers and selecting the 11th marketer, and this was repeated for each of the commodities in each market.
The sample size amounted to 15 ˟ 9 = 135
Data were collected with the aid of well-structured questionnaires, which were administered on the respondents. This was accompanied by the use of oral interviews to obtain necessary information from the respondent in the cases where the respondent could neither read nor write. The data collected through the questionnaires were on the socio-economic attributes of the respondents like; age distribution, sex, marital status, household size, income level, market price among others. Others included the volume of the commodities sold in the area, the price and other variables which affect the marketing of the commodities.
In this study, objectives (i) and (ii) were analyzed using the descriptive statistics tools like the frequencies, the percentages and mean distributions.
Objective (iii), was analyzed using the multiple regression model: the regression equation was explicitly specified thus.14
Y = β0 + β1X1 + β2X2 + β3X3 + β4X4 + β5X5 + β6X6 + e; where
Y = agricultural commodity export (quantity of the commodity (KG))
β0 = intercept
β (1 to 6) = slopes (regression coefficients)
X1 = number of years in business
X2 = price of the commodity (N)
X3 = Income (N)
X4 = Years spent in education (Yrs.)
X5 = Household size (Number of persons)
X6 = Marital status (1 = single, 2 = married, 3 = separated, 4 = divorced, 5 = widow/widower)
e = error term.
The choice of variables used was to capture factors at the microeconomic level, particularly the factors that directly affect the farmers as this would give a better understanding of how these factors affect agricultural commodity export.
Objective (iv) was analyzed using the price elasticity model given as the percentage change in quantity demanded, divided by the percentage change in price of the commodity.
Results and Discussion
Socioeconomic characteristics of the respondents
The result in Table 1 shows that generally greater number of the respondents (29.63%) were within the age bracket of 51-60 years, while (28.89%) were in the age bracket of 41-50 years which made it the second largest group. This implies that majority of the commodity marketers in the study area were made up of the middle age individuals within the ages of 41 to 60 years, where the mean age is 50. Thus this suggests that in Imo state generally, the youths do not invest time and energy into agricultural related activities, which was also explained by researcher15 who also reported that commodity marketers within the ages of 40-49, and 50-59 made up 24.07% and 33.33% of his sample size respectively in Imo state.
The study also found that majority (57.78%) of the respondents were females, while the remaining 42.22% were males. In general, this result showed that the number of those involved in the marketing of these selected commodities in the study area were dominated majorly by females. This implies that women plays more roles in marketing of agricultural commodities as well as in other post-harvest activities more than the men do. As Alexandra Peralta said in 2022, that women plays more role in postharvest activities more than men, but however, have limited influence in decisions about agricultural activities and use of income from crop sales.
Table 1 also revealed that 71.11% of the respondents were married and 12.60% were single. This implies that most individuals involved in commodity marketing in the study area are adults who were married. This results agrees with,11 who reported that 83.9% of the marketers of agricultural commodities were married. Thus agricultural marketing is seen as a business and means of livelihood by married men and women who sees it as the most available job opportunity.
The distribution of the respondents by household size shows that the average household size of commodity marketers in the study area is five persons. This is also the same with what was reported as average household size among marketers in Imo State.16 This illustrates that marketing of agricultural commodities could be lucrative enough to fend for an average household size of 5 persons, however, it is a tedious activity and requires the joint contribution of more hands, and hence, it is mostly carried out by married men and women with children. This result is consistent with,17 who suggested that larger family sizes can serve as a valuable source of farm labor, thereby reducing labor costs.
The data also explained that the mean of the respondents according to educational level was 12.2, which means that almost every respondent in the survey attained at least 12 years of formal education or more and this complements the result that 49.2% of the total sample size had spent at least 12 years in formal education.18 Thus, this means that a significant number of the respondents on average are literate and have the ability to make informed decisions about their marketing and farm operations. Basic education is expected to enhance farmers’ capabilities by providing essential numeracy and literacy skills, thereby facilitating informed decision-making in agricultural practices.19
It also revealed that the marketers in the study area earned an average monthly income of N59,680 which gave an average annual income of N716,160. This finding disagrees with a previous report that farmers in Imo State do not make up to N253,000 per annum.20 This disparity therefore suggests that commodity marketers potentially generate more income than those specializing in production solely.3,21,22
The results in Table 1 also showed that the average number of years spent in the business by the respondents was 13 years. This implies that the commodity marketers were very well experienced in their respective businesses having spent more than one decade in the business.
Table 1: Socioeconomic characteristics of the commodities marketers
| Variable | Frequency | Percentage |
| Age | ||
| 21-30 | 7 | 3.19 |
| 31-40 | 22 | 16.3 |
| 41-50 | 39 | 28.89 |
| 51-60 | 40 | 29.63 |
| 61-70 | 23 | 17.03 |
| 71-80 | 4 | 2.96 |
| Total | 135 | 100 |
| Mean | 50.1 | |
| Sex | ||
| Male | 57 | 42.22 |
| Female | 78 | 57.78 |
| Total | 135 | 100 |
| Education | ||
| 6 | 25 | |
| 12 | 81 | |
| 18 | 29 | |
| Total | 135 | |
| Mean | 12.5 | |
| Marital status | ||
| Single | 17 | 12.6 |
| Married | 96 | 76.11 |
| Separated | 6 | 4.44 |
| Divorced | 2 | 1.48 |
| Widow/Widower | 14 | 10.37 |
| Total | 135 | 100 |
| HH Size | ||
| 4 | 53 | 39 |
| 8 | 76 | 56 |
| 12 | 6 | 4 |
| Monthly income(N) | ||
| Below 50000 | 63 | 46.67 |
| 50,001 – 100000 | 54 | 40 |
| 100,001 – 150000 | 18 | 13.33 |
| Total | 135 | 100 |
| Mean | 59,680 | |
| Years in business | ||
| 9 | 51 | 37.78 |
| 19 | 45 | 33.33 |
| 29 | 30 | 22.22 |
| 39 | 9 | 6.67 |
| Total | 135 | 100 |
| Mean | 13.3 |
Volume of Selected Exportable Agricultural Commodities in the Study Area
The distribution of the selected commodities in the area according to quarterly quantities and prevailing prices in each selected market are presented in Table 2, Table 3, and Table 4.
The result in Table 2 presents the quantities and prevailing prices of the commodities in different market locations and quarters of the year in the study area. The Table focuses majorly on the total quantity and total price of each commodity in each market in each quarter of the year. The average quantity and average price of each commodity in each market in each quarter of the year and the average quantities and average prices in each market in each quarter of the year.
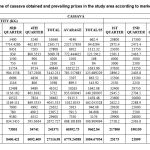 |
Table 2: Distribution of volume of cassava obtained and prevailing prices in the study area according to markets and quarter of the year. |
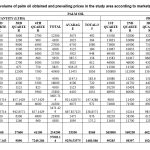 |
Table 3: Distribution of volume of palm oil obtained and prevailing prices in the study area according to markets and quarter of the year. |
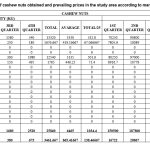 |
Table 4: Distribution of volume of cashew nuts obtained and prevailing prices in the study area according to markets and quarter of the year. |
Table 2 showed the data on the volume and prevailing prices of cassava in the study area expressed in quarterly period. The results showed that there is more abundance of cassava within the periods of April to September in the zone which corresponds to the second and third quarters of the year. This may be as a result of the usually high rainfall in the area within the period which softens the soil and allows for easier harvesting of the cassava roots. This is also the period when new areas are cultivated with the cassava stems gotten from harvested crops. Cassava roots are therefore relatively more abundant in the market during this period. The prevailing price in the period was determined to be lower than the price in the other two quarters of the year. However the price regime within the period does not reflect the relative abundance of cassava tubers. This may mean that sizeable quantities of cassava tubers and its products are usually available for exportation within the period.
The result in Table 3 shows the distribution of volume and prevailing price of Palm Oil in the study area according to the quarterly periods. The quarterly volume and prices obtained as shown revealed that the second and third quarters of the year have higher volume but lower price average relative to other quarters of the year. This means that palm oil is more abundant in the zone in the middle periods of the year than the periods from Oct. to March. This could be likened to the seasonal nature of the commodity and the weather condition dominant in the year. Its implication is that there is usually more abundance of palm oil to export in the second and third quarters of the year, however marketers can make huge profits in exporting palm oil during the first and last quarters of the year as the price will tend to increase appreciably. This can only be possible if the marketer stores enough of the commodity during the period of abundance.
Table 4 presents the volume and prevailing price of Cashew Nuts in the study area according to the quarterly periods. The results showed that cashew nuts is not generally available in the zone rather it is usually found in some specific places and markets in the zone. Also, it is usually not available all year round. This implies that cashew nut is not a common commodity in the zone. According to the quarterly volume, it was seen that cashew nuts were more abundant in the first quarter of the year unlike what was obtained in Tables 2 and 3. The reason here is that they are usually picked during the dry season when the plantation can be easily accessed and the nuts easily found, which also correlates with the maturity period of cashew nuts.
Factors affecting agricultural commodities exports in the study area
Table 5: Multiple regression on determinants of agricultural export in the study area.
| Variables | Linear (L) | Double Log | Exponential | Semi-Log |
| Constant | 61.360(5.073) | 1.618(2.252) | 3.998(22.811) | -90.475(-1.613) |
| X1(Yrs. in business) | -0.341(-1.091) | -0.163(-2.698)*** | -0.0115(-2.548)* | -5.537(-1.175) |
| X2 (price of commodity) | 0.002(13.256)*** | 0.438(10.585)*** | 1.865E-05(9.715)*** | 36.090(11.169)*** |
| X3(Income) | -0.00032(-3.428)*** | -0.084(-1.353) | -2.166E-06(-1.618)* | -12.105(-2.492)** |
| X4(Yrs. Spent in formal education) | -0.774(-1.058) | -0.076(-0.668) | 0.0007(-0.066)* | -12.445(1.406) |
| X5(H/H Size) | -1.807(-1.149) | -0.212(-1.895)* | -0.046(-2.029)** | -8.018(-0.919) |
| X6(marital status) | 11.756(1.655)*** | 0.390(3.797)*** | 0.175(4.602)*** | 22.978(2.862)*** |
| N | 135 | 135 | 135 | 135 |
| R2 | 0.601 | 0.512 | 0.482 | 0.518 |
| Standard Err | 29.955 | 0.422 | 0.424 | 32.928 |
| F-Value | 32.098*** | 22.346*** | 19.884*** | 22.885*** |
Source: Survey data
Note: the values in parenthesis are the t-ratios
* = t significant at 10%
** = t significant at 5%
*** = t significant at 1%
L = Lead Equation
Table 5 shows the regression result for the determinants of agricultural commodities exports in the study area. The linear functional form provided the best fit and hence was chosen as the lead equation. The linear functional form gave the highest coefficient of multiple determination (R2) which was observed to be 60.1%. It also accounted for the highest number of significant variables
The regression equation for this study based on the linear functional form is as follows:
Y = 61.360 – 1.341X1 + 0.002X2 – 0.0003X3 – 0.774X4 – 1.807X5 + 11.756X6
X2 (price of the commodity), was significant to the dependent variable at 1% and positively related. This implied that when the price of the commodity increases, there will be more volume of the commodity exported, as higher prices provide incentives for producers to increase production and exports.7, 23,24, However, this result supports the theory of supply, which states that the higher the price of a commodity, the more quantity of that commodity supplied.
So also X6 (Marital Status), was positively related and significant to the study at 1% significant level. This means that this variable has a direct positive effect on agricultural export trade. If a marketer or farmer is married, he will have more responsibilities that will require him/her to increase his/her income, thus boosting his/her willingness to export his products.25 Also, married couples have more hands to use as labour.17
Unlike X2 and X6; X3 (Income), was negatively related to the study but also significant at 1% significance level. The negative relation showed that as the income of the marketer increases, they tend to adjust to other types of business that is not having same level of risk and uncertainty as obtained in agricultural commodities marketing.24,26 This also means that people involved in agricultural commodity marketing are average income earners while others are low income earners, which agrees with3,22 who said that People involved in agricultural commodity marketing generally earn average to low incomes, with significant variations depending on factors like location, commodity type, and market access.
The F-value of the regression (32.098), which is statistically significant at 1% significance level also explains the goodness of fit of the model. In conclusion, Years in business (X1), Income (X3), Years in education (X4), and Household Size (X5), were the negative or inverse determinants of agricultural exports in the study area, while price of the commodity and marital status were positive determinants of agricultural exports in the study area.
Constraints to commodity marketing in the study area.
Table 6: Constraints to the marketing of these commodities in the study area.
| PROBLEMS | LIKERT RATING SCALE | MEAN = SUM OF F.X/ SUM OF F | REMARK | |||||||
| VS = 5 | S = 4 | U = 3 | LS = 2 | NS = 1 | ||||||
| PRICE INSTABILITY | 68 (50.37%) | 44 (32.59%) | 20 (14.81%) | 3 (2.22%) | 0 (0.00%) | 4.3 | SERIOUS | |||
| SEASONALITY | 23 (17.04%) | 77 (57.04%) | 23 (17.78%) | 9 (6.67%) | 3 (1.48%) | 3.8 | SERIOUS | |||
| PERISHABILITY | 13 (8.89%) | 38 (28.14%) | 26 (20.00%) | 48 (35.56%) | 10 (7.41%) | 3 | SERIOUS | |||
| DISTANCED MARKET LOCATION | 7 (5.19%) | 44 (32.60%) | 40 (28.89%) | 42 (31.85%) | 2 (1.48%) | 3.1 | SERIOUS | |||
| LOW OUTPUT | 17 (12.59%) | 24 (17.78%) | 58 (42.22%) | 31 (22.96%) | 5 (4.44%) | 3.1 | SERIOUS | |||
| UNSTANDARDISED QUALITY OF PRODUCTS | 9 (6.67%) | 31 (22.96%) | 39 (28.89%) | 50 (37.04%) | 6 (4.44%) | 2.9 | LESS SERIOUS | |||
| FUTURE SPECULATIONS | 7 (5.93%) | 12(8.89%) | 36 (26.67%) | 61 (44.44%) | 19 (14.07%) | 2.5 | LESS SERIOUS | |||
| LACK OF BUYERS | 8 (5.93%) | 15 (11.11%) | 19 (14.07%) | 61 (44.44%) | 32 (24.44%) | 2.3 | LESS SERIOUS | |||
| OVER POPULATION | 6 (4.44%) | 17 (12.59%) | 33 (24.44%) | 49 (36.30%) | 30 (22.22%) | 2.4 | LESS SERIOUS | |||
| NEED/NATURE OF THE COMMODITY | 10 (7.41%) | 39 (28.89%) | 24 (17.78%) | 43 (31.85%) | 19 (14.07%) | 2.9 | LESS SERIOUS | |||
| POOR SANITARY CONDITIONS OF THE MARKET | 10 (7.41%) | 21 (16.30%) | 25 (18.52%) | 49 (35.56%) | 30 (22.22%) | 2.5 | LESS SERIOUS | |||
| LACK OF MARKET INFORMATION | 8 (5.30%) | 27 (20.00%) | 29 (21.48%) | 43 (31.85%) | 28 (20.74%) | 2.6 | LESS SERIOUS | |||
Source: Survey data
The value in brackets are the percentages
The result in Table 6 shows the constraints to the marketing of these selected commodities in the study area. The results show that seasonality, perishability, distant market location, and low output were identified as major constraints to effective marketing of agricultural commodities in the study area, which agrees with.3 This inference is drawn from the mean value of the responses of the respondents to each problem. The mean value of each problem explained the magnitude of its effect and seriousness to the study.
An individual observation of the problems highlighted shows that price instability is the problem mostly affecting the marketing of these commodities, where more than 50% of the total respondents expressed this in their response. Instability in prices of agricultural commodities have been perceived as a common feature of a well-functioning agricultural commodity markets, however, when the margins are very large and unexpected, they will negatively affects the food security of both farmers, consumers and country at large; this crushes the purchasing power of buyers and disrupts the market.27
Accordingly, seasonal changes in agricultural production also affects the marketing of agricultural commodities. Seasonality is known to influence the decisions of the farmer on the time to plant and harvest.28 Thus deciding the success or failure of other agricultural activities like marketing.
On the contrary, lack of buyers, according the result has proven to have the least effect to agricultural marketing with a mean of 2.3. This suggests that there are always enough buyers of agricultural commodities in the study area. This is followed by overpopulation, which has a mean of 2.4.
Price elasticity of the commodities in the study area
The price elasticity of the selected commodities in the study is shown in the tables presented below.
Table 7: Price elasticity of cassava in the study area.
| PRICE ELASTICITY OF CASSAVA | ||||||||
| Quarters | Av price (N)/25kg | Av quantity/25kg unit | revenue | marginal revenue | % change quantity | %change price | elasticity | interpretation |
| 1 | 2,361 | 37.32 | 88,112.52 | n/a | n/a | n/a | _ | _ |
| 2 | 2,433 | 32.4 | 78,829.2 | 1886.85 | 3% | -14% | -0.21 | inelastic |
| 3 | 2,797 | 23.72 | 66,344.84 | 1438.29 | 14% | -31% | -0.45 | inelastic |
| 4 | 3,022 | 27.08 | 81,835.76 | 4610.39 | 8% | 13% | 0.58 | inelastic |
Source: Survey data
The result in Table 7 shows the price elasticity of cassava as obtained in the study area. If a commodity is price elastic, it implies that the demand and supply of the commodity tends to change relative to change in price. The absolute values of the elasticity showed that cassava is relatively inelastic to price changes as the volume does not change significantly with the change in price as we move down the four quarters of the year. This also means that there is a relatively constant supply and demand for cassava in the market all year round. However, several factors were also identified to be responsible for changes in the volume of the commodity in each quarter, such factors are variations in weather conditions, diseases and pest outbreak, low output and varying farming practices. This also validates a previous finding which showed that the demand for cassava in Ikwerre local government area of Rivers State is inelastic.29
Table 8 showed the price elasticity of palm oil in a year. The absolute values indicated that palm oil is price elastic in the study area, because when price goes up by 1%, the volume demanded will change also significantly by 1% or above.3,30 This is so because people in the area can always device an alternative source of satisfying the need for the commodity, e.g. they can resort to harvesting from the free growing palm trees on their lands or the ones they planted, and making a household processing of it and still have a good product to use. Again, the change in the volume of the commodity with respect to price changes do not follow regular patterns as other factors like time of the year and weather conditions can affect significantly the volume of the commodity available.23,31
Table 8: Price elasticity of Palm Oil in the study area.
| PRICE ELASTICITY OF PALM OIL | |||||||||
| Quarters | Av Price(N)/25ltrs | Av quantity/25ltrs unit | Revenue | Marginal revenue | % change price | % change quantity | Elasticity | Interpretation | |
| 1 | 10,933 | 52.56 | 574,638 | N/A | N/A | N/A | |||
| 2 | 11,032 | 35.72 | 394,063 | 10723.00 | 0.90 | -38 | -42.32 | ELASTIC | |
| 3 | 11,391 | 43.96 | 500,748 | 12947.25 | 3.20 | 21 | 6.46 | ELASTIC | |
| 4 | 11,847 | 32.2 | 381,473 | 10142.43 | 3.92 | -31 | -7.87 | ELASTIC | |
Source: Survey data.
Table 9: Price elasticity of cashew nuts in the study area.
| PRICE ELASTICITY OF CASHEW NUTS | ||||||||
| Quarters | Av price (N)/25kg | Av quantity/25kg unit | Revenue | Marginal revenue | % change price | % change quantity | Elasticity | Interpretation |
| 1 | 8,361 | 32 | 267,552 | N/A | N/A | N/A | ||
| 2 | 10,433 | 16.12 | 168,180 | 6257.69 | 22.05 | -66.00 | -2.99 | ELASTIC |
| 3 | 12,042 | 7.6 | 91,519.2 | 8997.74 | 14.32 | -71.84 | -5.02 | ELASTIC |
| 4 | 14,625 | 13.48 | 19,715 | 17963.57 | 19.37 | 55.79 | 2.88 | ELASTIC |
Source: Survey data
The result in Table 9 showed the price elasticity of cashew nuts as obtained in the study area. Taking the absolute values of the elasticity column, we interpret that cashew nuts are price elastic with respect to volume of the commodity and periods of the year. This implies that for a profitable marketing and exportation of the commodity, one has to be able to store up the product during the season and hence make sales during the off season. This is also stated by 28,32 who confirmed that in the short run, a 1% increase in the price of Cashew nuts will have a 1.49% effects on the volume.
Conclusion
Following the objectives and findings from the survey, this study was able to conclude that the study zone has abundance of agricultural commodities with export potentials present. However their volume and price changes with time, season and prevailing weather condition. This makes most of the commodities to be highly price elastic. Commodity like cashew nut are rarely available all year round and also not found in all parts of the study zone unlike palm oil which is usually found in all parts of the zone, however, the volume of cashew nuts change significantly between quarters of the year while cassava is the most popular and easily found commodity amongst the three studied commodities in the zone.
The socio-economic disposition of the people living in the zone revealed that the population are mostly the working population and focused mainly in farming. However they are also majorly low income earners. They face such problems like perishability, seasonality, price instability, low output and distanced market locations as the constraints to the marketing of the commodities in the zone.
Recommendation
Based on the findings from the survey and results thereof, the following recommendations were made.
The majority of people into commodity marketing are the females and are the middle to late aged bracket, the males and younger youths are encouraged to get into the business as the duties involved in marketing and exportation of agricultural commodities in general are very tedious and energy sapping, such that it drains the females and force them to carry out only a limited activities in marketing.
Cassava, unlike Cashew Nuts are always available in the area all year round and are relatively not price elastic, hence, there should be more focus on identifying more export destinations, and economic needs of the commodity and its products.
Since the commodities are perishable and most are not verily available all year round, standard storage and processing facilities should be provided or improvised by those concerned to help in maintaining stable supply of both quantity and quality throughout the year.
Price is seen to vary significantly from market to market and even from individual to individual in the same market, price regulatory committees and policy should be enforced to regulate price ceiling and price floor, and also to checkmate for defaulters in the area. This will help in curtailing price elasticity of the commodities and price variations.
Generally, Agricultural commodity exporters should be identified with the rural areas in the country like the study area to enable them extract the excess/gluts of the commodities with export potentials from the entire area and further aggregate them in the nation’s total export volume for improvement in the nation’s balance of payment.
Acknowledgement
The authors of this paper would like to extend their heartfelt gratitude to the Federal University of Technology, Owerri for granting the B.Agric.Tech. research work. The department of Agricultural Economics, School of Agriculture and Agricultural Technology, is greatly applauded for the allowed use of the econometrics lab in completing the analysis of the data of the research work.
Funding Sources
The author(s) did not receive any financial support for this research work, authorship, and/or publication of this work.
Conflict of Interest
The authors do not have any conflict of interests
Data Availability Statement
This statement does not apply to this article.
Ethics Statement
This research study has been designed and will be conducted in accordance with the principles of the Declaration of Helsinki
Author(s) contribution
Aloysius Ifeanyi Maduike: Supervisor
Bismack Okwudili Ibeagwa: project administrator
Paschal Chibuzo Nwadike: conceptualization, writing-original draft, data analysis, editing and inspection.
Nelson Obumneneme Ekwebelem Data Collection
References
- Daramola, A., Simeon Ehui, Emmanuel Ukeje and John McIntire, “Agricultural Export Potential in Nigeria” 2007. Courseheroes.
- Abiodun, O F. and Solomon, A O. “Determinants of agricultural exports in oil producing economy: Empirical evidence from Nigeria. Journal of economic Theory, 2010. 4(4).
CrossRef - Ogundele, O. O., & Okoruwa, V. O. (2011). Analysis of rural-urban marketing margin of selected agricultural commodities in Nigeria. Journal of Agricultural Economics and Development, 10(1), 1-14.
- Adebayo, E. F., & Okuneye, P. A. (2015). Marketing of agricultural products in rural Nigeria: Challenges and prospects. Journal of Agricultural Extension, 19(1), 1-13.
- Oluwande, J. and Mathenge, M, “Market participation among poor households in Kenya”, 2012 Conference, August 18-24-2012, Foz do Iguacu, Brazil 126711, International Association of Agricultural Economists.
- World Bank (2013). Agricultural Innovation Systems: An Investment Sourcebook. World Bank Publications.
- FAO (2017). The State of Food and Agriculture 2017: Leveraging Food Systems for Inclusive Rural Transformation. Food and Agriculture Organization of the United Nations.
- Hazell, P. B. R., & Diao, X. (2005). Achieving the Millennium Development Goals in Africa: What role for agricultural research? Journal of International Development, 17(5), 641-655.
- Reardon, T., & Timmer, C. P. (2014). Five interlinked transformations in the Asian agrifood economy: Food security implications. Global Food Security, 3(2), 115-125.
CrossRef - Chikaire, J. U., Nwakwasi, R. N., Godson-Ibeji, C. C., & Chikezie, N. P. An Analysis of the Perceived Effects of Climate Change on the health of Rural Farmers in Okigwe Agricultural Zone of Imo state, Nigeria Mayfair journal of Agriculture and Development in Emerging Economies 2016. Vol. 11, issue 2, pp 32-42.
- Njoku, J. I., & Ugboaja, C. I. Adoption of Agricultural Technologies Transferred Via Radio-farmer Programme Among Farmers in Imo state, Nigeria. Department of Rural Sociology and Extension, Michael Okpara University of Agriculture, Umudike. Journal of Sustainable agriculture and the Environment. 2019. Vol. 17, (2019) (1): 168-180.
- Consultative Committee on Agricultural Export Commodity Statistics, (2010), “Report on: National Survey of Exportable Agricultural Commodities in Nigeria” NBS/CBN/FMA&RD/FMC&I 2009/2010.
- National survey of exportable agricultural commodities in Nigeria, by consultative committee on agricultural export commodity statistics (CCAECS) (2009/2010) and (2018/2019)
- Nwauwa, L. O. E. Palm Oil marketing and Distribution pattern in Imo state, Nigeria: An Application of linear programming model. Department of Agricultural Economics, University of Ibadan, Ibadan, Nigeria. E3 journal of Agricultural Research and Development 2012. Vol. 2(1). Pp. 037-043.
- Nwaobiala, C. U. Farmers’ Adoption of Cassava Agronomic Practices and Intercrop Technologies in Abia and Imo states, Nigeria. Department of Rural Sociology and Extension, Michael Okpara University of Agriculture Umudike. Journal of Agricultural Extension, 2018. Vol. 22 (2).
CrossRef - Echetama, A., Ani, A. O., Opara, I. U., Ojo, O. U., & Oguegbuchulam, M. N. Constraints Perceived by Farmers’ Community Organizations Affecting Roles of Extension Agents in Okigwe Agricultural Zone of Imo state, Nigeria. Journal of Environmental Issues and Agriculture in Developing Countries, 2015. Volume 7, Number 3.
- Ezeibe, A.B., Edafiogho, D.O., Okonkwo, N.A., Okide, C.C. (2015). Gender differences and challenges in cassava production and processing in Abia State, Nigeria. Afr. J. Agric. Res., 10(22), 2259–2266.
CrossRef - Osuji, E. E., Ehirim N. C., Eze, E. U., & Osuji M. N. Analysis of Socio-Economic Variables on Agricultural Productivity of Some Selected Arable Crops in Imo state, Nigeria. Department of Agricultural economics, Michael Okpara University, Umudike, Department of Agricultural Economics, Federal University of Technology, Owerri, & department of Agricultural Engineering, Federal Polytechnic Nekede, Owerri. International journal of agriculture and rural development. 2013. Vol. 16, (1): 1385-1391.
- Okoye, A.C (2018). Gender Differential in Market Competitiveness among Small Holder Farmers in South-East Nigeria, An unpublished Dissertation submitted in the Department of Agribusiness and Management, Michael Okpara University of Agriculture, Umudike.
- Adesiyan, O. F, Adesiyan, A. T, & Abisoye, L. Determinants of farmers willingness to export yam in Ibarapa East and Ibarapa Central Local Government Areas of Oyo State, Nigeria. Department of Agricultural Economics, Obafemi Awolowo University, Ile-Ife. 2020. https://dx.doi.org/10.4314/gjas.v55il.6
CrossRef - Okuneye, P. A. (2002). Marketing of agricultural products in Nigeria: An empirical analysis. Journal of Agricultural Extension, 13(1), 1-11.
- Adeogun, M. O., & Aromolaran, A. B. (2015). Comparative analysis of income generated by farmers and marketers in the value chain of selected agricultural commodities in Nigeria. Journal of Agricultural and Food Economics, 3(1), 1-10.
- Tomek, W. G., & Robinson, K. L. (2003). Agricultural Product Prices. Cornell University Press.
- Kohls, R. L., & Uhl, J. N. (2002). Marketing of Agricultural Products. Prentice Hall.
- Food and Agricultural Organization of the United Nations. Price Volatility in Agricultural markets; Markets and Trade 2011.
- Baumol, W. J. (1993). Entrepreneurship, Management, and the Structure of Payoffs. MIT Press.
- De Beurs, K. M, & Brown, E. M. The effects of Agricultural growing season change on market prices in Africa. 2013 InTech. Doi: 10.5772/56459
CrossRef - Okidim, A, I, and Ellah, G. O. Responsiveness of cassava demand to vaiations in price and income in Ikwerre local government area of Rivers state, Nigeria (2000-2012). Journal of economics and sustainable development. ISSN 2222-1700 (Paper) ISSN 2222-2855 (Online), Vol. 4, No. 7, 2013
- Mfunu, G. R. Tanzanian Cashew Nut Supply Response Under Market Reforms. University of Nairoby Researcg Archive. Degree of Master of Arts in Economics. 2013. http://erepository.uonbi.ac.ke:8080/xmlui/handle/123456789/60430
- Onyema, J. O. (2012). Price Elasticity of Demand for Palm Oil in Nigeria. Journal of Agricultural Economics and Development, 11(1), 1-9.
- Bessler, D. A. (1984). An Analysis of the Demand for and Supply of Vegetable Oils in the United States. Journal of Agricultural Economics, 35(2), 147-155.
- Susan Li, “Price Elasticity of Demand, Statistical Modeling with Python” How to maximize profit: 2013. towards data science.