
Introduction
Maize (Zea mays L.) is an economically significant staple cereal crop that is consumed in a variety of forms throughout Africa.1 It is grown virtually in all agroecologies in Nigeria due to its critical importance as a food, feed, and industrial crop. The North Central region of Nigeria is the leading maize-producing region, recording a mean grain yield of 1.8 t ha-1 on the farmer’s field and a marginal annual increase of 2 – 3%. The productivity is due mainly to poor management practices, unimproved maize varieties, and the devastating impact of biotic and abiotic stresses.2 Low soil nitrogen (N) is one of the important abiotic stresses that reduces maize yield depending on its severity, plant growth stage, and genotype susceptibility level. It has been reported that maize is a heavy feeder on N with a high response to phosphorus (P); however, the most lacking nutrient in the soil is N, frequently limiting maize yield.3 The intensive cropping system being practiced across Nigerian agroecological zones necessitates the continuous application of organic and inorganic fertilizers for soil fertility sustainability and optimal plant growth. Nitrogen fertilization is critical to the physiological and metabolic functions of the maize plant, resulting in increased vegetative growth, kernel filling, and ultimately, enhanced productivity. Reduction in optimal N fertilization reduces photosynthesis, directly impacting the maize grain yield by diminishing the size and weight of the ears.4 Recently, farmers report abysmal grain yields as a result of little or no fertilizer application due to the exorbitant price increases year after year and the inability to obtain loans or credit facilities to finance their farm operations.5 As a result, maize hybrids that have been developed with genes for high productivity in low N conditions are highly desirable.
Weather variations are currently a source of concern in the derived Guinea Savanna agroecology. When rains are delayed or erratic, extra-early maturing maize hybrids with high levels of provitamin A, tryptophan, and lysine contents that mature in 85 to 90 days are suitable for planting. Farmers who planted maize varieties that belong to this maturity class benefited from early market access before the main season sales, filling a large gap after the dry season. Thus, breeding biofortified extra-early maturing maize hybrids that are tolerant to low soil N stress is a cost-effective, sustainable, and economically viable strategy for ensuring food security. Developing maize hybrids from biofortified inbred lines and testing them in both low and optimal N research conditions will improve the identification of superior hybrids with high grain yield potential in both soil environments.
Estimating stress tolerance in newly developed genetic materials will significantly improve genetic gain in a breeding programme.6 There are differential reactions of elite maize genotypes to diverse production stresses. High-yield performance is the primary indicator of stress tolerance in most crops, and genotypes with high yields in both stressed and non-stressed environments are considered tolerant.7 However, high-yielding genotypes may not necessarily be stress-tolerant and vice versa; hence, the use of stress-tolerant indices is a more effective technique than mere selection through high grain yield and associated traits. Previous studies by Badu-Apraku et al8, Obeng-Bio et al9, and Kolawole et al10 assessed N stress tolerance in maize by manually estimating multiple trait-based indices under low N research conditions. This approach is time-consuming and may be prone to human error. Hence, there is a need to employ the recently created user‐friendly abiotic stress calculator, which performs a huge variety of computations conveniently and rapidly. The Plant Abiotic Stress Index Calculator (iPASTIC), developed Pour‐Aboughadareh et al7 is a web-based application utilizing JavaScript and R to compute prevalent stress tolerance and susceptibility indices for diverse crop characteristics. These indices consist of two groups. The first group consist of geometric mean productivity (GMP), harmonic mean (HM), stress tolerance index (STI), and mean productivity (MP), which have the potential to identify stress-tolerant genotypes. The second group comprises stress susceptibility index (SSI) and yield stability index (YSI), which are useful for discriminating yield and stability performance of newly developed crop varieties. The other indices that iPASTIC software computes include: tolerance index (TOL), yield index (YI), and relative stress index (RSI).
These indices measure not only the yield but also the stability and adaptability, helping breeders select genotypes with both yield potential and resilience to stress. Using stress-tolerant indices allows breeders to account for complex physiological and genetic interactions influencing tolerance, beyond what yield alone can reveal. They also offer practical tools for screening large numbers of genotypes efficiently, correlating agronomic performance to stress tolerance. Thus, incorporating stress-tolerance indices in breeding programmes is scientifically justified to improve crop resilience and productivity under changing environmental conditions.
The suitability and effectiveness of this online toolkit (iPASTIC) have been documented in diverse crop improvement programmes that encompass the screening of drought-tolerant genotypes (good performance under stress and non-stress conditions) in various crops such as wheat,11-12 bush bean, 13 maize, 14-15 and sorghum.16 Notwithstanding the recognised application of these indices in agronomy and plant breeding programmes, limited studies have compared, identified, and selected promising N stress screening indices for maize grain yield. The objectives of this study were to (i) compare the grain yields of single-cross maize hybrids grown in optimum and low N environments, (ii) identify N stress-tolerant maize hybrids using the stress indices, and (iii) assess the relationship among the stress indices and their effectiveness for identifying N stress-tolerant maize hybrids.
Materials and Methods
Genetic materials
The inbred lines used to generate the hybrids evaluated in this study were selected from the tropical Zea extra-early provitamin A (PVA) quality protein maize (QPM) inbred lines (TZEEIORQ) developed by the maize improvement programme of the International Institute of Tropical Agriculture (IITA), Ibadan, Nigeria.17 The selected inbred lines were evaluated, and five inbreds with high grain yield potential, which possess genes for PVA, quality protein (tryptophan and lysine), as reported by Kolawole et al,18 were selected and crossed using Griffing’s diallel method IV to generate 10 single-cross extra-early maize hybrids without reciprocals.
Experimental site, design, and cultural practices
In the 2022 and 2023 main growing seasons, the 10 single-cross maize hybrids generated, viz. TZEEIORQ 53 × TZEEIORQ 52, TZEEIORQ 55 × TZEEIORQ 52, TZEEIORQ 57 × TZEEIORQ 52, TZEEIORQ 63 × TZEEIORQ 52, TZEEIORQ 55 × TZEEIORQ 53, TZEEIORQ 57 × TZEEIORQ 53, TZEEIORQ 63 × TZEEIORQ 53, TZEEIORQ 57 × TZEEIORQ 55, TZEEIORQ 63 × TZEEIORQ 55, TZEEIORQ 63 × TZEEIORQ 57 and a commercial maize hybrid planted by farmers used as local check were evaluated at the Ladoke Akintola University of Technology, Ogbomoso, Nigeria, Teaching and Research (LAUTECH T&R) Farm, (8⁰ 10’N, 4⁰ 10’E and altitude 341 m above sea level). The study site experiences an annual rainfall between 1,000 and 1,200 mm, with daily temperatures fluctuating from 28 to 30°C. The soils at the experimental location are classified as Alfisol,19, which are typically characterized by low nitrogen (N) content. Historically, the site has been continuously cultivated with maize over several years, with minimal or no nitrogen fertilizer application. Additionally, after each maize harvest, all plant residues were removed from the field to prepare for subsequent planting seasons. This practice has likely contributed to the depletion of soil nitrogen levels. Before establishing the trial, soil samples were collected and analyzed at the Department of Agronomy’s soil laboratory, University of Ibadan, Ibadan, Nigeria, to assess nutrient status. Land preparation involved mechanical tillage using a tractor-mounted plough, followed by the division of the field into two blocks representing distinct nitrogen application regimes: 30 kg N ha⁻¹ and 90 kg N ha⁻¹. These nitrogen environments were separated by a 3-meter alley, with a constructed gutter implemented to inhibit lateral nitrogen movement in the soil.
A split-plot arrangement in a randomized complete block design with four replications served as the experimental setup. The main plots consisted of the two nitrogen environments, while sub-plots comprised different maize hybrids. Each experimental unit was a single-row plot measuring 5 meters in length, with rows spaced 0.75 meters apart and intra-row spacing of 0.50 meters between hills. Three seeds were sown per hill, and thinning was conducted two weeks after planting to maintain two plants per stand, resulting in a final plant density of 53,333 plants per hectare.
Phosphorus and potassium were applied as basal fertilizers at rates of 60 kg ha⁻¹ each, using single superphosphate (SSP) and muriate of potash (MOP), respectively, within the 30 kg N ha⁻¹ treatments. For the 90 kg N ha⁻¹ treatments, nitrogen was supplied in two split applications: the first dose at two weeks post-sowing and the second dose two weeks thereafter. Weed control involved the application of a mixture of Gramoxone and Primextra herbicides at a rate of 5.0 liters per hectare at planting, followed by manual weeding to maintain weed-free plots. Fall armyworm (Spodoptera frugiperda) infestations were managed using Caterpillar Force, containing Emamectin benzoate at 10 g per 15 liters of water, applied at two-week intervals.
Data collection
Agronomic data were recorded at the plot level. Anthesis date was defined as the number of days from planting until 50% of plants shed pollen. Silking date was the number of days from sowing until 50% of the plants extruded silks. The anthesis-silking interval (ASI) was calculated as the difference between silking and anthesis dates. Plant height was measured from the base to the first tassel branch, while ear height was measured from the base to the ear-bearing node (or uppermost ear in prolific hybrids). Plant aspect was scored on a 1-9 scale assessing overall phenotypic appeal, where 1 indicated excellent and 9 poor appearance. Husk cover was rated from 1 (very tight husk extending beyond the ear tip) to 9 (exposed ear tip). Ear aspect was rated on a 1-9 scale, where 1 indicated clean, uniform, large, and well-filled ears, and 9 corresponded to rotten, poorly filled, and small ears. The number of ears per plant was calculated as the ratio of harvested ears to plants at harvest. Stay-green under low nitrogen conditions was evaluated 70 days after planting on a 1–9 scale, where 1 corresponded to <10% dead leaf area and 9 = >80% dead leaf area. Grain yield was estimated from ear weight.1 The ear weight (kg) was adjusted to 15% moisture content (MC) and an 80% shelling percentage for conversion to kilograms per hectare (kg ha-1) as follows:
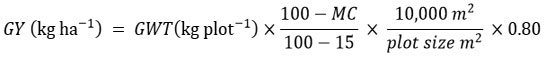
Where: GWT = grain weight of harvested plot, MC = moisture content of maize grain at harvest, moisture content for maize grain storage = 15 %, 1 hectare = 10,000 m².
Statistical analysis
The N research conditions (low and optimal) by year combinations constituted environments. All agronomic data collected under each N research condition and across environments were subjected to Analysis of variance (ANOVA) using the General Linear Model procedure (PROC GLM) in Statistical Analysis System (SAS) software release 9.4.20 The model was fitted with environments, replicates within environments, and hybrid × environment interaction as random factors, while the hybrids were fixed factors. The linear model for the split-plot, with main plots arranged as Randomized Complete Block Design (RCBD), is:
![]()
Where Yijk = the observed response variable for the ith level of the main plot factor, jth subplot levels, and kth block; μ = the overall mean of the response variable, i = indexes the main plot levels, j = indexes the subplot levels, k = indexes the blocks, and γk represents the effect of the kth block.
Provided that mean square values were significant, a mean comparison was done with Fisher’s least significant difference (LSD) test at a 0.05 probability level.21 In addition, low N-tolerant hybrids were identified using the iPASTIC created by Pour-Aboughadareh et al.7 The online toolkit, written in JavaScript, was used to calculate stress indices (Table 1) and the percentage of relative change. The software was also used to calculate the ranking patterns of the hybrids, based on each index. The average sum of ranks (ASR) and standard deviation (SD) were computed to ensure consistency in the indices’ ability to identify N stress-tolerant and susceptible maize hybrids.
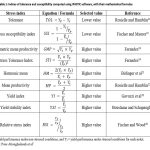 |
Table 1: Indices of tolerance and susceptibility computed using iPASTIC software, with their mathematical formulas |
Source: Pour‐Aboughadareh et al7
Maize hybrids exhibiting lower ASR values were identified as the most tolerant. Heat maps constructed using Pearson’s29 correlation coefficients were employed to assess the relationships among stress indices and grain yield under both experimental conditions. A three-dimensional plot based on the Stress Tolerance Index (STI) for maize grain yield under optimal and low nitrogen (N) environments facilitated the classification of hybrids into Fernandez’s 24 four groups (A, B, C, and D). Additionally, principal component analysis (PCA) was performed on nine stress tolerance indices along with grain yield data under both optimal and low N environments for the ten maize hybrids.
Results
Analysis of variance for grain yield and agronomic traits
For each and across N environments, the mean squares for the examined traits were significant (p < 0.001, 0.01, or 0.05) for the environment, hybrid, and their interactions (Table 2). Under low N environments, the mean squares of environment for ear aspect, ears per plant, grain yield, and the mean squares of hybrid for plant height and ears per plant showed no significant difference; the mean squares of hybrid × environment interaction were significant only for the number of days to silking, husk cover, and grain yield. Under the optimal N environments, the mean squares of the environment were significant for most of the traits measured, except for anthesis-silking interval, ear height, and grain yield. The mean squares of the hybrid showed significant differences for grain yield, husk cover, anthesis-silking interval, and numbers of days to anthesis and silking. The mean squares of hybrid × environment interaction showed significant differences for the number of days to silking, anthesis-silking interval, plant height, plant and ear aspects. Across the N environments, mean squares of environment, hybrid and their interactions (hybrid × environment) were significant for the measured traits except mean squares of environment for ear aspect and grain yield, mean squares of hybrid for plant height and ears per plant and mean squares of hybrid × environment interaction for numbers of days to anthesis, ear height and ears per plant.
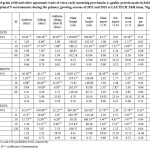 |
Table 2: Mean squares of grain yield and other agronomic traits of extra-early maturing provitamin A-quality protein maize hybrids assessed under low and optimal N environments during the primary growing seasons of 2022 and 2023 at LAUTECH T&R farm, Nigeria. |
Selection of maize hybrids based on stress indices and grain yield response
At the optimal N environment, maize grain yield (Yp) ranged from 594.9 to 2,022.0 kg ha-1. TZEEIORQ 63 × TZEEIORQ 53, followed by TZEEIORQ 63 × TZEEIORQ 52, had the highest mean grain yield performance. Under low N environment, grain yield (Ys) varied from 360.0 to 901.5 kg ha-1, and TZEEIORQ 63 × TZEEIORQ 53 followed by TZEEIORQ 53 × TZEEIORQ 52 showed the highest values under low N environment (Table 3). Comparison of the hybrids’ grain yield performance under low and optimal N conditions in the two years of evaluation revealed yield reductions ranging from 15% for TZEEIORQ 53 × TZEEIORQ 52 to 59% for TZEEIORQ 63 × TZEEIORQ 57, with a mean of 36%. TZEEIORQ 63 × TZEEIORQ 53, TZEEIORQ 63 × TZEEIORQ 52, and TZEEIORQ 53 × TZEEIORQ 52 had high values for STI, MP, GMP HM, and YI indices, which are indicators of good performance under low and optimum N environments. Our findings showed the selection of superior maize hybrids based on more than one indicator. The stability of the hybrids under both N conditions was further assessed with the YSI and RSI indices, TZEEIORQ 53 × TZEEIORQ 52, TZEEIORQ 57 × TZEEIORQ 53, and TZEEIORQ 55 × TZEEIORQ 53 had high values with a similar ranking pattern for these indices in the identification of N-tolerant and stable hybrids.
The maize hybrids with the lowest reduction percentage (<32%) in grain yield under low N environments were TZEEIORQ 53 × TZEEIORQ 52 (15%), TZEEIORQ 57 × TZEEIORQ 52 (30%), TZEEIORQ 55 × TZEEIORQ 53 (21%), and TZEEIORQ 57 × TZEEIORQ 53 (19%). The identified hybrids with lower percent relative change also had the low values for TOL with SSI < 1, emphasizing their tolerance to low N, whereas TZEEIORQ 63 × TZEEIORQ 57, with the highest percent yield reduction, was sensitive to low N conditions.
The results based on a single index may not be reliable, and hence, an average sum of rank (ASR) based on the combination of all nine indices was used to depict the hybrid’s N stress tolerance nature. The SR values of the hybrids were between 26 and 92, and the hybrid with the lowest ASR value indicates N stress tolerance. Thus, the top three N stress-tolerant hybrids identified were TZEEIORQ 53 × TZEEIORQ 52 (ASR = 2.4; SD = 1.2), TZEEIORQ 63 × TZEEIORQ 52 (ASR = 3.5; SD = 1.8), and TZEEIORQ 63 × TZEEIORQ 53 (ASR = 4.0; SD = 4.2).
 |
Table 3: Ranking of the 10 extra-early maize hybrids along with the relative change and tolerance indices |
Response of maize hybrids for agronomic traits under the low and optimal N environments
The mean days to anthesis and silking were 60 days under low N environments compared to 61 days in optimal N environments (Table S1). Under low N environments, TZEEIORQ 63 × TZEEIORQ 52 and TZEEIORQ 55 × TZEEIORQ 53 had the shortest anthesis-silking interval (0.1). The tallest hybrid (TZEEIORQ 63 × TZEEIORQ 53) had a height of 163.3 cm. TZEEIORQ 63 × TZEEIORQ 52 had the highest ear height (55.2 cm), and the lowest score for plant aspect (4.8) was found in TZEEIORQ 53 × TZEEIORQ 52 and TZEEIORQ 63 × TZEEIORQ 53. For the ear aspect rating, TZEEIORQ 63 × TZEEIORQ 55 had the lowest score (4.3). TZEEIORQ 63 × TZEEIORQ 57 had the best husk cover score (2.9). TZEEIORQ 63 × TZEEIORQ 53 had the best performance for number of ears per plant, stay green score (4.8), and grain yield (901.5 kg/ha). Under optimal N environments, TZEEIORQ 55 × TZEEIORQ 53 had the shortest anthesis-silking interval (0.3). The tallest hybrid (TZEEIORQ 55 × TZEEIORQ 52) had a height of 162.1 cm, while TZEEIORQ 63 × TZEEIORQ 53 had the highest ear height of 58.6 cm. This hybrid also had the best score for plant aspect (4.9), husk cover (3.5), and the highest grain yield (2022.0 kg/ha). TZEEIORQ 55 × TZEEIORQ 53 had the highest number of ears per plant. Under both research conditions, TZEEIORQ 63 × TZEEIORQ 53 had the highest grain yield, flowered late with a long anthesis-silking interval comparable to the local check.
Association of grain yield and stress indices
Based on the actual values of the indices and their ranking patterns across all hybrids, the correlation heat map showed that TOL, MP, GMP HM, STI, and YI had a strong and significant (p < 0.05) association with grain yield under optimal (Yp) and low (Ys) N environments (Figure 1). In contrast, RSI and YSI had a significantly negative association (p < 0.05) with Yp. The significant positive correlation coefficient (r = 0.81, p < 0.05) between Yp and Ys implies that high-yielding hybrids under an optimal N environment can perform well under a low N environment. Additionally, MP, GMP, HM, YI, and STI had high correlation coefficients with each other.
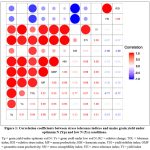 |
Figure 1: Correlation coefficients between stress tolerance indices and maize grain yield under optimum N (Yp) and low N (Ys) conditions. |
Multivariate analysis
The first two principal components (PC) with eigenvalues >1 explained 99.6% (PC1 = 71.2 and PC2 = 28.4) of the overall variation in yield performance, according to the PCA results based on the correlation matrix (Figure 2). Grain yield favourably influenced PC1 under both environments and all stress indices except RSI and YSI, as observed also on the biplot. Only TOL and STI had a negative association with PC2. Hence, selection based on high values of indices in these PCs could help to identify N-tolerant hybrids.
The biplot of PCA1 and PCA2 classified the 10 single-cross hybrids into four different quadrants based on their yield response under both low and optimal N environments, and only one hybrid (TZEEIORQ 63 × TZEEIORQ 53) was located near the tolerance indices, such as STI, MP, GMP, HM, and YI. On the other hand, the majority of hybrids were categorized as N stress-susceptible hybrids. The hybrid (TZEEIORQ 63 × TZEEIORQ 53) identified as superior by the PCA biplot was further backed up by the 3D plot’s findings. This hybrid has STI >1, and according to Fernandez’s 24 theory, it falls into the A group, which implies a comparatively consistent performance in both optimal and low N environments (Figure S1). Also, TZEEIORQ 53 × TZEEIORQ 52 was seen on the borderline of group C, which indicates high performance under low N conditions. Other hybrids were in group D, suggesting low performance under both N environments and the lowest STI.
In general, the biplot and 3D plot results showed that TZEEIORQ 63 × TZEEIORQ 53 performed best across both N environments. Thus, based on STI, plant breeders can select hybrids with yield potential under low N stress conditions.
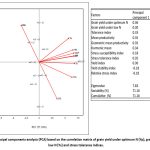 |
Figure 2: Principal components analysis (PCA) based on the correlation matrix of grain yield under optimum N (Yp), grain yield under low N (Ys) and stress tolerance indices. |
Discussion
The highly significant mean squares of hybrids observed for most traits, including grain yield under both research conditions and stay green characteristics under low N conditions, indicate substantial genetic variability among the extra-early maize hybrids. This variability suggests the potential for selecting hybrids that are tolerant to N stress.30 In line with the present results, Obeng-Bio et al9 found significant variation among early PVA-QPM maize hybrids for grain yield under low and optimal N conditions. Furthermore, Li et al31 reported significant differences in grain yields among maize cultivars grown under varying N research conditions. The distinct N environments effectively revealed genetic differences among the hybrids. Additionally, the significant mean squares of hybrid × environment interaction observed for grain yield and most traits under each and across N environments show that environmental variation influences trait expression. This highlights the importance of evaluating hybrids across multiple N environments to assess grain yield performance accurately.
It is important to mention that the inbred lines used to develop the hybrids evaluated in this study had grain yields ranging from 250 to 2372 kg/ha under diverse environments.17-18 However, the hybrids developed exhibited abysmally low yields despite their responsiveness to nutrients and heavy feeding on N. Plausible reasons for this could include deleterious alleles in the genetic background of the inbreds negatively affecting the hybrids’ performance, poor genetic compatibility, or poor general and specific combining abilities, resulting in hybrids with low yields. Ideally, extra-early maize varieties fit well into multiple cropping cycles due to their relatively short growing periods. Nevertheless, they often incur an undesirable yield penalty because the shorter time to accumulate and translocate sufficient photo-assimilate reserves results in low grain yields, as evidenced in this study and reported by Semahegn et al.11
Grain yield variation between hybrids grown under low and optimal N environments underscores the differential response of the hybrids to N application, in agreement with the report of Aga et al.34 This further emphasizes grain yield as a complex quantitative trait controlled by multiple genes and impacted by environmental factors.35 The result of maize hybrids with the lowest reduction percentage in this study corroborates the reports of Aga et al,28 who reported yield reduction of 22-32% in durum wheat genotype under low N inputs.
Among the 10 single-cross hybrids evaluated, TZEEIORQ 63 × TZEEIORQ 53 showed the highest values for MP, GMP, HM, STI, YI, and TOL. Anand et al32 observed a similar trend for these indices in the selection of high grain yield in rice under both water-stressed and non-stressed conditions, while Shahrokhi et al33 and Sánchez-Reinoso et al13 reported the usefulness of these indices in screening maize and bush bean for drought tolerance. The consistent identification of TZEEIORQ 63 × TZEEIORQ 53 and TZEEIORQ 63 × TZEEIORQ 52 as high-yielding and tolerant to N stress demonstrates the efficiency of ASR. This provides greater insight into the response of the evaluated hybrids, and this approach has been widely utilized to select superior genotypes in various breeding programmes.12,36
According to Horváth et al,37 indices that correlate with yield performance in both stress and non-stress research conditions are known as the best tolerance indicators because they can be used interchangeably to select low N-tolerant hybrids. Therefore, TOL, MP, GMP HM, STI, and YI, which had a strong and significant relationship with grain yield under optimal (Yp) and low (Ys) N environments, can identify maize hybrids with high yield potential and relatively uniform performance under both N conditions, corroborating the report of Bonea14 and Singamsetti et al38 who found similar strong positive correlation patterns between stress indices and grain yield under stress and optimal conditions in maize. Likewise, previous studies on other crops like canola39 and wheat40 confirm the same trend of association. Significant positive correlations between Yp and Ys have been reported by Grzesiak et al41, Sedri et al42 and Shojaei et al30 The perfect positive or negative correlation coefficient (r = 1or -1, p < 0.05) between Ys and YI, YSI and RSI, SSI with YSI and RSI, observed in this study, were similar to the reports of Mickky et al43 and Nazari et al.44
Furthermore, the biplot categorized the indices into two groups. The first group was those with high and positive values in PC1 (MP, GMP, HM, STI, and YI) and negative values in PC2 (TOL and SSI). The second group had an index with a negative value in PC1 (RSI and YSI), while the index in PC2 had positive values. According to Nazari et al, 38 indices whose vectors have been placed between the vectors of Yp and Ys are appropriate for the selection of stress-tolerant hybrids. Similar results have been reported in other crops. 45-46 The hybrid TZEEIORQ 63 × TZEEIORQ 53 was found to be superior for grain yield and tolerant to low N. Its performance under both low and optimal N conditions surpasses the average performance of all other hybrids under optimal conditions. Similar performance has been reported by Ivić et al40 and Choudhary et al16 in wheat and sorghum, respectively.
Conclusion
This study highlights the existence of considerable variability among the maize hybrids for grain yield and other agronomic traits, which can further be exploited for improvement. Superior low N-tolerant hybrids based on each index were identified. Among the nine indices, only four (MP, GMP, HM, STI, and YI) were similar in classifying TZEEIORQ 63 × TZEEIORQ 53, TZEEIORQ 63 × TZEEIORQ 52, and TZEEIORQ 53 × TZEEIORQ 52 as low N-tolerant hybrids. According to the YSI and RS1 indices, TZEEIORQ 53 × TZEEIORQ 52 and TZEEIORQ 57 × TZEEIORQ 53 were the most stable low N-tolerant hybrids. All the other indices, except TOL, SSI, YSI, and RSI, were consistent in identifying TZEEIORQ 63 × TZEEIORQ 53 as the superior low N-tolerant hybrid. In addition to the consistency of the indices for identifying low N-tolerant hybrids, the rank sum also emphasized TZEEIORQ 53 × TZEEIORQ 52, TZEEIORQ 63 × TZEEIORQ 52, and TZEEIORQ 63 × TZEEIORQ 53 as outstanding for grain yield under low N environments. Therefore, based on grain yield, the stress indices computed with the iPASTIC software were able to identify superior and stable hybrids under low and optimal N environments. The identified low N-tolerant hybrids may be useful for cultivation in areas where soil N stress is a challenge. They may also serve as potential donors in the development of N-efficient maize varieties.
Acknowledgement
The authors express their sincere gratitude to the project students of the first author from the Department of Crop Production and Soil Science, Faculty of Agricultural Sciences, Ladoke Akintola University of Technology, Ogbomoso, Nigeria, for their invaluable technical support.
Funding Source
The author(s) received no financial support for the research, authorship, and/or publication of this article.
Conflict of Interest
There is no conflict of interest.
Data Availability Statement
The manuscript incorporates all datasets produced or examined throughout this research study.
Ethics Statement
This research did not involve human participants, animal subjects, or any material that requires ethical approval.
Informed Consent Statement
This study did not involve human participants, and therefore, informed consent was not required.
Permission to reproduce material from other sources
Not Applicable
Author Contributions
Adesike Oladoyin Olayinka: Conceptualization, Methodology, Analysis, Writing – Original Draft.
Adesike Oladoyin Olayinka, Moses Adeolu Adebayo, Solomon Adeyemi Oyekale, Ibrahim Akintunde Raji: Data Collection, Writing – Review & Editing.
Adesike Oladoyin Olayinka, Moses Adeolu Adebayo: Visualization, Supervision, Project Administration.
Adesike Oladoyin Olayinka and Solomon Adeyemi Oyekale: Resources, Supervision.
References
- Kolawole AO, Olayinka AF. Phenotypic performance of new pro-vitamin A maize (Zea mays L.) hybrids using three selection indices. Agriculture (Pol’nohospodárstvo. 2022;68(1):1-12. doi:10.2478/agri-2022-0001
CrossRef - Afolabi S. Response of maize (Zea mays L.) to rates of nitrogen and zinc application in Minna, Southern Guinea Savanna of Nigeria. Journal of Agricultural Sciences, Belgrade. 2019;64(2):121-131. doi:10.2298/JAS1902121A
CrossRef - Amare T, Alemu E, Bazie Z, Woubet A, Kidanu S, Alemayehu B, Awoke A, Derebe A, Feyisa T, Tamene L, Kerebh B, Wale S, Mulualem A. Yield-limiting plant nutrients for maize production in northwest Ethiopia. Experimental Agriculture. 2022;58:e50. doi.org/10.1017/S0014479722000448
CrossRef - Abubakar AW, Manga AA, Kamara AY, Tofa AI. Physiological evaluations of maize hybrids under low nitrogen. Advances in Agriculture. 2019;2019:1-6. doi.org/10.1155/2019/2624707
CrossRef - Gul H, Rahman S, Shahzad A, et al. Maize productivity in response to nitrogen management in Pakistan. American Journal of Plant Sciences. 2021;12(08):1173-1179. doi:10.4236/ajps.2021.128081
CrossRef - Xu Y. Envirotyping for deciphering environmental impacts on crop plants. Theoretical and Applied Genetics. 2016;129(4):653-673. doi:10.1007/s00122-016-2691-5
CrossRef - Pour-Aboughadareh A, Yousefian M, Moradkhani H, Moghaddam Vahed M, Poczai P, Siddique KHM. iPASTIC: An online toolkit to estimate plant abiotic stress indices: iPASTIC to estimate plant abiotic stress indices. Applications in Plant Sciences. 2019;7(7):11278. doi.org/10.1002/aps3.11278
CrossRef - Badu-Apraku B, Fakorede MA, Oyekunle M, Akinwale RO. Selection of extra-early maize inbreds under low N and drought at flowering and grain-filling for hybrid production. Maydica. 2011;56(2):141.
- Obeng-Bio E, Badu-Apraku B, Ifie BE, et al. Genetic diversity among early pro-vitamin A quality protein maize inbred lines and the performance of derived hybrids under contrasting nitrogen environments. BMC genetics. 2020;21:1-13. doi:10.1186/s12863-020-00887-7
CrossRef - Kolawole AO, Raji IA, Oyekale SA. Assessment of maize (Zea mays L.) varieties for tolerance to contrasting soil-nitrogen environments in Ogbomoso, Nigeria. Journal of Agricultural Science and Environment. 2022;22(1):43-56.
- Semahegn Y, Shimelis H, Laing M, Mathew I. Evaluation of bread wheat (Triticum aestivum L.) genotypes for yield and related traits under drought stress conditions. Acta Agriculturae Scandinavica, Section B – Soil & Plant Science. 2020;70(6):474-484.
CrossRef - Belay GA, Zhang Z, Xu P. Physio-morphological and biochemical trait-based evaluation of Ethiopian and Chinese wheat germplasm for drought tolerance at the seedling stage. Sustainability. 2021;13(9):4605. doi:10.3390/su13094605
CrossRef - Sánchez-Reinoso AD, Ligarreto-Moreno GA, Restrepo-Díaz H. Evaluation of drought indices to identify tolerant genotypes in common bean bush (Phaseolus vulgaris L. Journal of Integrative Agriculture. 2020;19(1):99-107. doi:10.1016/S2095-3119(19)62620-1
CrossRef - Bonea D. Grain yield and drought tolerance indices of maize hybrids. Notulae Scientia Biologicae. 2020;12(2):376-386. doi:10.15835/nsb12210683
CrossRef - Khatibi A, Omrani S, Omrani A, et al. Response of maize hybrids in drought-stress using drought tolerance indices. Water. 2022;14:1012. doi:10.3390/w14071012
CrossRef - Choudhary R, Biradar D, Katageri I, Koti R. Assessment of sorghum near isogenic lines (NILs) for moisture stress tolerance by drought stress indices. Journal of Farm Sciences. 2022;35(1):40-45. doi:10.61475/jfm.v35i01.100
- Oyekale SA, Badu-Apraku B, Adetimirin VO, Unachukwu N, Gedil M. Development of extra-early provitamin a quality protein maize inbreds with resistance/tolerance to striga hermonthica and soil nitrogen stress. Agronomy. 2021;11(5):891. doi.org/10.3390/agronomy11050891
CrossRef - Kolawole AO, Oyekale SA, Raji IA. Per se performance of biofortified maize inbred lines under optimum environment in the derived Savanna agro-ecology of Nigeria. LAUTECH Crop and Environmental Reviews. 2021;2(1):33-38.
- U.S.D.A. United States Department of Agriculture, Natural Resources Conservation Service. In Soil Taxonomy: A Basic System of Soil Classification for Making and Interpreting Soil Surveys. In: Agriculture Handbook. 2nd ed. University of Wisconsin Press; 1999:754.
- Institute SAS. SAS system for windows. In: Release 9.4. SAS Institute Inc. ; 2011.
- Gomez KA, Gomez AA. Statistical Procedures for Agricultural Research. 2nd ed. Wiley; 1984.
- Rosielle AA, Hamblin J. Theoretical aspects of selection for yield in stress and non‐stress environment. Crop Science. 1981;21(6):943-946.
CrossRef - Fischer R, Maurer R. Drought resistance in spring wheat cultivars. I. Grain yield responses. Australian Journal of Agricultural Research. 1978;29(5). doi:10.1071/AR9780897
CrossRef - Fernandez GCJ. Effective selection criteria for assessing plant stress tolerance. In: Proceeding of the International Symposium on Adaptation of Vegetables and Other Food Crops in Temperature and Water Stress. 1992:257-270.
- Bidinger FR, Mahalakshmi V, Rao GDP. Assessment of drought resistance in pearl millet [Pennisetum americanum (L.) Leeke]. I. Factors affecting yields under stress. Australian Journal of Agricultural Research. 1987;38(1):37-48. doi:10.1071/AR9870037
CrossRef - Gavuzzi P, Rizza F, Palumbo M, Campanile RG, Ricciardi GL, Borghi B. Evaluation of field and laboratory predictors of drought and heat tolerance in winter cereals. Canadian Journal of Plant Science. 1997;77(4):523-531. doi:10.4141/P96-130
CrossRef - Bouslama M, Schapaugh WT. Stress tolerance in soybeans. I. Evaluation of three screening techniques for heat and drought tolerance. Crop Science. 1984;24(5):933-937.
doi.org/10.2135/cropsci1984.0011183X002400050026x
CrossRef - Fischer R, Wood J. Drought resistance in spring wheat cultivars. Yield associations with morpho-physiological traits. Australian Journal of Agricultural Research. 1979;30(6):1001. doi.org/10.1071/AR9791001
CrossRef - Pearson K. VII. Note on regression and inheritance in the case of two parents. Proceedings of the Royal Society of London. 1895;58(347-352):240-242.
CrossRef - Shojaei SH, Mostafavi K, Omrani A, Illés Á, Bojtor C, Omrani S, Mousavi SMN, Nagy J. Comparison of maize genotypes using drought-tolerance indices and graphical analysis under normal and humidity stress conditions. Plants. 2022;11(7):942. doi.org/10.3390/plants11070942
CrossRef - Li XL, Guo LG, Zhou B, ang X, Chen C, Zhang L, Zhang S, Li C, Xiao K, Dong W, Yin B, Zhang Y. Characterization of low-N responses in maize (Zea mays L.) cultivars with contrasting nitrogen use efficiency in the North China Plain. Journal of Integrative Agriculture. 2019;18(9):2141-2152. doi:10.1016/S2095-3119(19)62597-9
CrossRef - Anand S, Jayalekshmy VG, Reddy SB, Ankitha MO, Ashokan A. Water stress induced trait association studies on yield and drought selection indices in rice (Oryza sativa L.) Biological Forum – An International Journal. 2023;15(4):324-329.
- Shahrokhi M, Khorasani SK, Ebrahimi A. Evaluation of drought tolerance indices for screening some of super sweet maize (Zea mays L. var. Saccharata) inbred lines. AGRIVITA, Journal of Agricultural Science. 2020;42(3):435-448. doi:10.17503/agrivita.v42i3.2574
CrossRef - Aga TG, Abera FA, Tufa TB, Abebe KA, Abeyo BG, Ayana NG. Nitrogen deficiency tolerance and responsiveness of durum wheat genotypes in Ethiopia. International Journal of Agronomy. 2022;2022(1):9506078. doi:10.1155/2022/9506078
CrossRef - Khalili M, Pour-Aboughadareh A, Naghavi1 MR. Assessment of drought tolerance in barley: integrated selection criterion and drought tolerance indices. Environmental and Experimental Biology. 2016;14:33-41. doi:10.22364/eeb.14.06
CrossRef - Mourad AMI, Amin AEEAZ, Dawood MFA. Genetic variation in kernel traits under lead and tin stresses in spring wheat diverse collection. Environmental and Experimental Botany. 2021;192:104646. doi:10.1016/j.envexpbot.2021.104646
CrossRef - Horváth É, Gombos B, Széles A. Evaluation phenology, yield and quality of maize genotypes in drought stress and non-stress environments. Agronomy Research. 2021;19:408-422.
- Singamsetti A, Shahi JP, Zaidi PH, Seetharam K, Kumar M. Identification of waterlogging stress tolerant maize (Zea mays L.) hybrids using different selection indices. Agriculture Research Journal. 2023;60(1):126-134.
CrossRef - Malekshahi F, Dehghani H, Alizadeh B. A study of drought tolerance indices in canola (Brassica napus L.) genotypes. Journal of Science and Technology of Agriculture and Natural Resources. 2009;13(48):77-90. http://jstnar.iut.ac.ir/
- Ivić M, Grljušić S, Popović B, Andrić L, Plavšin I, Dvojković K, Novoselović D. Screening of wheat genotypes for nitrogen deficiency tolerance using stress screening indices. Agronomy. 2021;11(8).1544. doi:10.3390/agronomy11081544
CrossRef - Grzesiak S, Hordyńska N, Szczyrek P, Grzesiak MT, Noga A, Szechyńska-Hebda M. Variation among wheat (Triticum easativum L.) genotypes in response to the drought stress: I – selection approaches. Journal of Plant Interactions. 2019;14(1):30-44.
CrossRef - Sedri MH, Amini A, Golchin A. Evaluation of nitrogen effects on yield and drought tolerance of rainfed wheat using drought stress indices. Journal of Crop Science and Biotechnology. 2019;22(3):235-242. doi:10.1007/s12892-018-0037-0
CrossRef - Mickky B, Aldesuquy H, Elnajar M. Uni- and multi-variate assessment of drought response yield indices in 10 wheat cultivars. Journal of Crop Science and Biotechnology. 2019;22(1):21-29.
CrossRef - Nazari L, Dehghanian E, Estakhr A, Khazaei A, Sorkhilalehloo B, Abbasi MR. Introduction of the best criterion for evaluation of tolerance to drought stress in sorghum’s genotypes. Acta Agriculturae Slovenica. 2021;117(4):1-13.
CrossRef - Najaphy A, Geravandi M. Assessment of indices to identify wheat genotypes adapted to irrigated and rain-fed environments. Advances in Environmental Biology. 2011:3212-3219.
- Naghavi MR, Pour Aboughadareh A, Khalili M. Evaluation of drought tolerance indices for screening some of corn (Zea mays L.) cultivars under environmental conditions. Notulae Scientia Biologicae. 2013;5(3):388-393. doi:10.15835/nsb539049
CrossRef