
Introduction
Agriculture constitutes the backbone of the Indian economy and plays a crucial role in sustaining livelihoods, ensuring food security, and promoting rural development.1–4 Over the decades, the agricultural sector has witnessed profound changes influenced by technological innovations, demographic pressure, policy interventions, and environmental dynamics.2 Crop area, production and yield dynamics determine local food security, farmer incomes and the pace of rural development 5. Understanding both long-term growth trends and the degree of instability (i.e., variability) in these three indicators; area, production, and yield, is therefore crucial for policy design, risk management and targeted interventions in agro-ecosystems that are often vulnerable to climatic shocks and market fluctuations 6,7. Studying agricultural growth trends provides critical insights into the evolution of farming systems and helps identify both progress and constraints within the sector.7 Analyses of growth trends typically focus on three interrelated parameters-area, production, and yield, which together determine the trajectory and sustainability of agricultural performance.6
The area under cultivation indicates the extent of land devoted to specific crops, production reflects total output, and yield measures productivity per unit area, collectively serving as indicators of agricultural efficiency and technological progress.6,8 A change in area, production, or yield can result from shifts in resource availability, market demand, irrigation development, or government support programs.1 Spatial and temporal heterogeneity in area, production, and yield is a persistent feature of agricultural systems. Field and regional studies demonstrate that soil properties, water availability, topography, nutrient status, pest pressure, and local management practices produce pronounced spatial variability in crop performance 9,10. Climatic variability, especially monsoon fluctuations and temperature extremes, further contributes to temporal instability in production and yield, making long term monitoring essential for managing risk and sustaining productivity.11,12 Previous studies have highlighted that agricultural growth in India has been uneven across crops and regions due to diverse agro-ecological conditions and socio-economic factors.13 For example, wheat and rice have shown remarkable improvement in productivity due to technological advancements and irrigation facilities introduced during and after the Green Revolution.14 In contrast, coarse cereals, pulses, and oilseeds have often experienced stagnation or high instability in both yield and production.15 Such variations emphasize the need for region-specific analysis to understand localized agricultural dynamics and formulate targeted interventions.16
The two complementary concepts addressed in this study; growth and instability serve different analytical purposes. Growth analysis (commonly using compound annual growth rates and trend decomposition) highlights the direction and magnitude of change in cropped area, aggregate production and per hectare yields over time.17–19,39 It helps answer questions such as: which crops are expanding in area? Is production rising primarily due to area expansion or yield improvement? Instability analysis (often operationalized through coefficient of variation, instability indices or moving-window variance) reveals the reliability or volatility of production and yields, which has direct bearing on risk, income uncertainty and food availability 19,41,42,43. Literature from India and neighboring South Asian contexts shows that crops differ widely: cereals may show relative stability in production due to policy support and procurement, while oilseeds, pulses or certain horticultural crops often display higher area and production fluctuations tied to market signals and climate variability.20,21,43,44
Geographical analysis of agricultural growth allows for the assessment of spatial variations in crop performance and the identification of areas facing stagnation or decline.9,13 By integrating spatial and temporal data, such studies can uncover patterns linked to environmental constraints, resource management practices, and infrastructural disparities.14 Recent research has underscored that a balanced approach combining both area expansion and yield improvement is essential for achieving sustainable agricultural growth.22 Furthermore, examining growth instability and temporal fluctuations helps policymakers design adaptive strategies for risk management in agriculture.3 Assessing instability in agricultural indicators is critical for regions that depend heavily on monsoon rainfall and that face increasing climatic uncertainty. Empirical studies demonstrate that instability reduces effective productivity, undermines farmer incomes, and raises vulnerability to food insecurity.23,24 Hence measuring the magnitude and direction of temporal fluctuations in area, production, and yield is an important step toward designing adaptive policies for risk management, input subsidy targeting, and infrastructure investment.25,26 Aligarh district presents a valuable case for such a geographical inquiry because it lies within an agro-ecologically diverse and socio-economically dynamic part of Uttar Pradesh. District level analyses provide granularity missing from state or national studies and can uncover localized patterns of growth, stagnation, or fluctuation that are essential for district specific policy design.27,28 By combining long term time series with comparative crop analysis, researchers can determine which crops have driven production gains, which have suffered declines, and how area and yield dynamics have interacted over time.29
In this context, a detailed investigation of growth trends in area, production, and yield of major crops provides valuable insights into the dynamics of agricultural transformation. It helps identify whether increases in total production are driven more by expansion in cultivated area or by gains in productivity, thereby reflecting the underlying nature of agricultural progress 7,30. Such an understanding is indispensable for formulating policies that promote regional agricultural sustainability and ensure food security in the face of climatic and economic challenges 1,11,22. The present study aims to examine the growth trends and instability in area, production, and yield of major agricultural crops in Aligarh district for the period 1994–95 to 2022–23. It further aims to evaluate the comparative performance of different crops over time and to identify the direction and magnitude of changes in their area, production, and yield during the study period. These analyses will contribute to a better understanding of the agricultural dynamics of the region and provide a foundation for future planning, policy formulation, and sustainable agricultural development.
Material and Methods
Study Area
Aligarh District is located in the north-western part of Uttar Pradesh, India. The district covers an area of 3,650 km2 with a population of 3,673,889 as per the Census 2011, comprising 1,951,996 males and 1,721,893 females, resulting in a population density of 1,007 persons per square kilometer. Administratively, the district is divided into five tehsils and 12 development blocks. Geographically, Aligarh forms part of the upper Ganga-Yamuna Doab, bounded by the Ganga River in the northeast and Yamuna River in the northwest. The district experiences a hot semi-arid climate with average annual rainfall of approximately 713-816 millimeters, concentrated during the monsoon months (July to September). The mean maximum and minimum temperatures are 26.7°C and 15.5°C respectively, with summer temperatures reaching up to 45°C and winter temperatures dropping to 2°C. The terrain comprises flat alluvial plains with loamy, sandy, clayey, and silty soils that are highly fertile and suitable for diverse agricultural activities. Agriculture dominates the district’s economy, with approximately 80.54% of the total land under net sown area. The major crops cultivated include wheat, rice, millet, potato, maize, pulses, oilseeds, sugarcane, and barley. The district’s strategic location, fertile soils, well-developed irrigation infrastructure, and favorable agro-climatic conditions make it an important agricultural region in Uttar Pradesh.
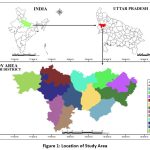 |
Figure 1: Location of Study Area |
Data Sources
The present study is based entirely on secondary data collected from various published sources and official statistical databases such as Directorate of Economics and Statistics (DES), Govt. of India and Zila Sankhyikiya Patrika (SPIDER) database of Uttar Pradesh DES. Data on the area (A), production (P), and yield (Y) of nine major agricultural crops, namely Wheat, Rice, Pearl Millet, Maize, Barley, Potato, Sugarcane, Mustard, and Arhar, are compiled for the period 1994-95 to 2022-23. These crops are selected on the basis of the area under cultivation, as they occupy the largest share of the gross cropped area and represent the dominant cropping pattern of the study area. To supplement the official statistics, relevant published research papers and reports are also reviewed to ensure methodological accuracy and provide comparative perspectives.
Methodology
To assess the growth trends, temporal variations, and instability in area, production, and yield of major agricultural crops, various analytical techniques have been applied:
Compound Annual Growth Rate (CAGR)
The CAGR is used to measure the average annual rate of growth in area, production, and yield during the study period. It provides a consistent measure of long-term growth and helps reduce the effect of short-term fluctuations 7. It indicates the constant rate at which a variable grows on a compounded basis and is expressed as:
Where,
Yn = A/P/Y of crops in the year 2022-23
Yi = A/P/Y of crops in the initial year i.e., 1994-95
N = Number of years in the study period
Net Change in Area, Yield, and Production
Net Change is calculated to determine the absolute difference in area, production, and yield between the base year and the terminal year. This measure identifies whether the variable has increased or decreased over time and quantifies the total change during the study period 30. It is given by:

Trend Analysis
Trend Analysis is used to examine the direction and pattern of change in area, production, and yield over time. A linear trend equation is fitted to the time series data of each crop, represented as:
Where,
![]()
Y = Variables (Area, Production, or Yield)
t = time in years
a = intercept
b = slope of the trend line
A positive value of b indicates an increasing trend, while a negative value indicates a decreasing trend.
Instability Analysis
Instability in the area, production, and yield of major crops is measured to understand the consistency of agricultural performance over time. Two statistical measures are used to examine instability: the Coefficient of Variation (CV) and the Coppock’s Instability Index (CII).
The Coefficient of Variation is computed as:
It indicates the extent of variability around the mean value. A higher CV denotes greater instability in agricultural performance 31.
The Coppock’s Instability Index is calculated as:
Where,
Yt = A/P/Y of crops in the current year
Yt-1 = A/P/Y of crops in the previous year
N = Number of Observations
The Coppock’s Instability Index provides a refined measure of instability by accounting for year-to-year fluctuations in logarithmic form, which minimizes the influence of extreme values and is widely used in agricultural time-series analysis.31
Results
Growth in Area, Yield, and Production
Table 1 summarizes the changes in cultivated area, yield, and production of major crops during the study period. Wheat, pearl millet, maize, barley, sugarcane, and arhar show a decline in cultivated area, while rice, potato, and mustard exhibit substantial expansion. Yield levels increased for most crops except arhar, which recorded a decline. Production increased notably for rice, pearl millet, potato, and mustard, whereas maize, barley, sugarcane, and arhar showed marked reductions.
Table 1: Growth in Area, Yield, and Production of Crops in Aligarh District
| Crops | Area (ha) | Net Change | Yield (q/ha) | Net Change | Production (MT) | Net Change | |||
| 1994-95 | 2022-23 | 1994-95 | 2022-23 | 1994-95 | 2022-23 | ||||
| Wheat | 241363 | 182135 | -24.54% | 30.6 | 42.0 | 37.30% | 738250 | 764238 | 3.52% |
| Rice | 15185 | 88695 | 484.10% | 20.1 | 25.0 | 24.32% | 30542 | 221383 | 624.85% |
| Pearl Millet | 95599 | 78850 | -17.52% | 12.9 | 26.2 | 102.63% | 123590 | 206193 | 66.84% |
| Maize | 55827 | 21125 | -62.16% | 13.3 | 24.1 | 81.48% | 74199 | 50806 | -31.53% |
| Barley | 38315 | 9650 | -74.81% | 31.9 | 35.0 | 9.79% | 122133 | 33785 | -72.34% |
| Potato | 5959 | 30272 | 408.00% | 195.8 | 366.0 | 86.96% | 116653 | 1107972 | 849.80% |
| Sugarcane | 10559 | 4461 | -57.75% | 562.1 | 829.4 | 47.56% | 593500 | 370000 | -37.66% |
| Mustard | 60008 | 88525 | 47.52% | 10.3 | 19.6 | 89.56% | 62063 | 173598 | 179.71% |
| Arhar | 26052 | 9124 | -64.98% | 9.6 | 6.3 | -34.24% | 24958 | 5703 | -77.15% |
Source: Compiled and Calculated by Authors from DES, Govt. of India & UPDES, Uttar Pradesh.
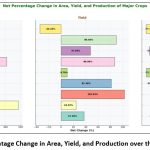 |
Figure 2: Percentage Change in Area, Yield, and Production over the Study Period. |
Figure 2 presents the percentage change in area, yield, and production for each crop. The figure clearly shows that rice and potato achieved the highest positive growth across all parameters, while barley and arhar experienced the steepest declines.
Compound Annual Growth Rate (CAGR)
Table 2 provides the compound annual growth rate of area, yield, and production for each crop. Rice, potato, and mustard recorded positive growth in all components. Wheat showed negative area growth but positive yield and marginal production growth. Maize, barley, sugarcane, and arhar recorded negative growth in both area and production. Yield growth remained positive for most crops except arhar.
Table 2: Compound Annual Growth Rate in Area, Yield, and Production of Crops in Aligarh District from 1994-95 to 2022-23
| Crops | Compound Annual Growth Rate (in %age) | ||
| Area | Yield | Production | |
| Wheat | -1.00% | 1.14% | 0.12% |
| Rice | 6.51% | 0.78% | 7.33% |
| Pearl Millet | -0.69% | 2.55% | 1.84% |
| Maize | -3.41% | 2.15% | -1.34% |
| Barley | -4.81% | 0.33% | -4.49% |
| Potato | 5.98% | 2.26% | 8.37% |
| Sugarcane | -3.03% | 1.40% | -1.67% |
| Mustard | 1.40% | 2.31% | 3.74% |
| Arhar | -3.68% | -1.49% | -5.14% |
Source: Calculated by Authors
Trend in Growth of Area, Yield, and Production
Figure 3 shows the long-term trend in cultivated area for each crop. Rice, potato, and pearl millet show upward linear trends, while maize, barley, sugarcane, and arhar reflect consistent decline. Wheat displays minimal fluctuation over time.
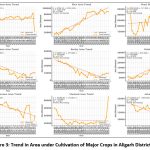 |
Figure 3: Trend in Area under Cultivation of Major Crops in Aligarh District |
Figure 4 illustrates the long-term yield trends of major crops from 1994-95 to 2022-23, showing both observed values and linear trend lines. Almost all crops including wheat, rice, maize, pearl millet, potato, mustard, and sugarcane exhibit an overall increase in yield over time. Even crops with declining area show rising productivity, highlighting improvements in agricultural technology and practices.
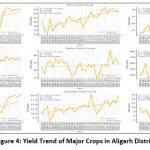 |
Figure 4: Yield Trend of Major Crops in Aligarh District |
Figure 5 shows the long-term production trends of major crops from 1994-95 to 2022-23, based on observed values and linear trend lines. Crops like wheat, rice, pearl millet, potato, and mustard show a clear upward production trend, driven largely by yield improvements. In contrast, maize, barley, sugarcane, and arhar exhibit declining production over time due to reduced cultivation area and fluctuating output.
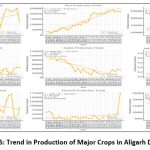 |
Figure 5: Trend in Production of Major Crops in Aligarh District |
Table 3: Instability in Area, Yield, and Production of Crops in Aligarh District
| Crops | CV | CII | ||||
| Area | Yield | Production | Area | Yield | Production | |
| Wheat | 6.51 | 14.15 | 15.64 | 7.14 | 11.37 | 12.69 |
| Rice | 50.39 | 15.74 | 59.51 | 17 | 14.06 | 23.63 |
| Pearl Millet | 7.40 | 22.71 | 24.90 | 8.08 | 17.36 | 18.94 |
| Maize | 45.42 | 24.33 | 36.64 | 18.64 | 28.42 | 37.04 |
| Barley | 67.43 | 11.58 | 66.82 | 34.24 | 13.12 | 35.67 |
| Potato | 52.85 | 19.64 | 63.75 | 26.26 | 19.28 | 22.87 |
| Sugarcane | 32.34 | 14.65 | 30.69 | 39.95 | 8.21 | 42.64 |
| Mustard | 56.10 | 22.82 | 76.23 | 53.1 | 25.75 | 37.04 |
| Arhar | 40.16 | 27.84 | 46.78 | 27.97 | 33.65 | 44.66 |
Source: Calculated by Authors
Table 3 presents the variability in area, yield, and production of major crops using the Coefficient of Variation (CV) and Cumulative Instability Index (CII). Higher values indicate greater fluctuations over time. Crops like barley, mustard, potato, and maize show high instability, while wheat and pearl millet exhibit relatively stable trends in all three parameters.
Discussion
Growth in Area, Yield, and Production
The analysis of area, yield, and production of major agricultural crops in Aligarh District during the period 1994-95 to 2022-23 reveals distinct patterns of change and variability (Table 1; Figure 2-5). The results indicate moderate fluctuations in cultivated area and production for most crops, while yield has shown gradual improvement over time. These variations appear to reflect the combined influence of climatic conditions, technological development, irrigation expansion, and changes in farmers’ cropping preferences 11,32. Wheat has remained the most extensively cultivated crop throughout the study period, though its area declined from 241,363 hectares in 1994-95 to 182,135 hectares in 2022-23, showing a decrease of 24.54 percent. Despite this decline, yield increased from 30.6 quintals per hectare to 42.0 quintals per hectare, an improvement of 37.30 percent, while production increased slightly from 738,250 tonnes to 764,238 tonnes, a rise of 3.52 percent. These trends suggest relatively stable performance with gradual yield improvement, possibly linked to improved varieties and agronomic practices 8 (Table 1 & Figure 2).
Rice showed notable changes in all three parameters. The area under rice cultivation expanded considerably from 15,185 hectares to 88,695 hectares, an increase of 484.10 percent. Production increased from 30,542 tonnes to 221,383 tonnes, an increase of 624.85 percent, while yield improved from 20.1 quintals per hectare to 25.0 quintals per hectare, an increase of 24.32 percent. These trends may indicate a growing preference for rice cultivation in irrigated areas and increasing adoption of high-yielding varieties. Two proximate, evidence-based drivers explain this expansion. First, institutional price signals and procurement policies in Uttar Pradesh and the wider Indo-Gangetic region increased incentives for paddy cultivation where irrigation was available 1,6. Second, the spread of tube wells and local irrigation improvements converted marginal or fallow plots into rice-suitable land, allowing farmers to switch from coarse cereals to transplanted paddy 7,14,31. Pearl millet recorded a decline in area from 95,599 hectares in 1994–95 to 78,850 hectares in 2022-23, a reduction of 17.52 percent. However, yield improved substantially from 12.9 quintals per hectare to 26.2 quintals per hectare, an increase of 102.63 percent, resulting in a rise in production from 123,590 tonnes to 206,193 tonnes, an increase of 66.84 percent (Table 1 & Figure 2). This reflects targeted varietal adoption and improved input use under semi-arid management regimes; similar patterns are reported in semi-arid zones where farmers intensify production on remaining parcels 3,33,34.
Maize and barley both showed a contraction in area. The area under maize declined from 55,827 hectares to 21,125 hectares, a reduction of 62.16 percent, while barley decreased from 38,315 hectares to 9,650 hectares, a reduction of 74.81 percent. Maize yield increased from 13.3 quintals per hectare to 24.1 quintals per hectare, an increase of 81.48 percent, and barley yield rose slightly from 31.9 quintals per hectare to 35.0 quintals per hectare, an increase of 9.79 percent. Despite the improvements in yield, maize production decreased from 74,199 tonnes to 50,806 tonnes, a decline of 31.53 percent, and barley production fell from 122,133 tonnes to 33,785 tonnes, a decline of 72.34 percent. These trends suggest a gradual reduction in the importance of coarse cereals, possibly influenced by changes in irrigation patterns and profitability. Potato showed a marked increase in all parameters. The area under potato cultivation expanded from 5,959 hectares in 1994–95 to 30,272 hectares in 2022–23, an increase of 408 percent. Yield improved from 195.8 quintals per hectare to 366.0 quintals per hectare, an increase of 86.96 percent, while production rose from 116,653 tonnes to 1,107,972 tonnes, an increase of 849.80 percent (Table 1 & Figure 2). This significant increase points to the growing role of potato as a commercial crop in the district.
Mustard also exhibited a positive trend, with area increasing from 60,008 hectares to 88,525 hectares, a rise of 47.52 percent. Yield improved from 10.3 quintals per hectare to 19.6 quintals per hectare, an increase of 89.56 percent, and production rose from 62,063 tonnes to 173,598 tonnes, an increase of 179.71 percent. Mustard’s positive trajectory reflects growing oilseed demand and profitable rotation options in the district; its rise follows state-level diversification toward oilseeds 30. In contrast, sugarcane showed a reduction in cultivated area from 10,559 hectares to 4,461 hectares, a decrease of 57.75 percent, while production declined from 593,500 tonnes to 370,000 tonnes, a fall of 37.66 percent. However, yield improved from 562.1 quintals per hectare to 829.4 quintals per hectare, indicating better productivity even with reduced acreage. Sugarcane presents a mixed picture; higher yields but large area and production declines. Local and regional evidence indicates two specific drivers: groundwater depletion (raising irrigation costs and reducing area cropped to sugarcane) and institutional problems in the sugar value chain, including delayed mill payments and occasional shutdowns that weaken farmer confidence 15,18,26,27. Arhar recorded a substantial decline in all three parameters. The cultivated area decreased from 26,052 hectares to 9,124 hectares, a decline of 64.98 percent, while yield dropped from 9.6 quintals per hectare to 6.3 quintals per hectare, a decline of 34.24 percent. Consequently, production declined from 24,958 tonnes to 5,703 tonnes, a reduction of 77.15 percent. This trend may reflect limited irrigation availability and comparatively lower returns from pulse crops.
Analysis of Compound Annual Growth Rate (CAGR)
The compound annual growth rate analysis provides an accurate measure of the pace and direction of change in area, yield, and production of major crops in Aligarh District over the study period. The results reveal considerable variation among crops, indicating that agricultural growth has been uneven and largely determined by crop-specific conditions. The area under wheat showed a slight decline, recording a negative annual growth rate of 1.00 percent. This suggests a gradual contraction in the extent of land devoted to wheat, although the crop continues to remain dominant in the district. Rice recorded a strong and consistent expansion in area with an annual growth rate of 6.51 percent, which represents the highest among all crops. Pearl millet showed a marginal decline in area with a negative growth rate of 0.69 percent. The area under maize and barley decreased at relatively faster rates of 3.41 and 4.81 percent per annum respectively, reflecting a steady reduction in their sown area over time. Potato exhibited a marked expansion in its cultivated area with an annual growth rate of 5.98 percent, while mustard recorded a moderate increase of 1.40 percent per annum. Sugarcane and arhar both showed negative growth in area, declining annually by 3.03 and 3.68 percent respectively, indicating a gradual reduction in their cultivation (Table 2).
The yield performance of most crops displayed a positive direction during the period of study. Wheat yield grew annually at a rate of 1.14 percent, while rice yield increased by 0.78 percent. Pearl millet and maize recorded higher yield growth rates of 2.55 and 2.15 percent respectively, signifying improvement in their productivity levels despite reductions in cultivated area. Barley yield improved marginally at 0.33 percent per annum. The yield of commercial crops such as potato, sugarcane, and mustard increased at annual rates of 2.26, 1.40, and 2.31 percent respectively (Table 2). In contrast, arhar yield declined at a rate of 1.49 percent per annum, showing stagnation in its productivity over the years.
The combined effect of area and yield changes is reflected in the production growth of each crop. Rice recorded the highest production growth with an annual rate of 7.33 percent, indicating continuous improvement in both its area and yield. Potato followed with an impressive growth rate of 8.37 percent per annum, emerging as the fastest growing crop in the district. Mustard recorded a production growth rate of 3.74 percent per annum, while pearl millet and wheat registered moderate gains of 1.84 and 0.12 percent respectively. On the other hand, maize, barley, sugarcane, and arhar exhibited negative growth in production, declining annually by 1.34, 4.49, 1.67, and 5.14 percent respectively (Table 2). Overall, the compound annual growth rate analysis suggests that the agricultural growth pattern in Aligarh District has been largely yield-oriented rather than area-driven 17,19. Crops such as rice, potato, and mustard achieved substantial progress in both area and production, supported by steady yield improvement. Wheat maintained relative stability, while maize, barley, sugarcane, and arhar registered declining trends in both area and output. The observed pattern reflects a gradual reorientation of the district’s agriculture toward irrigated and high-value crops, with slower growth or contraction in traditional rainfed and low-profit crops.24
Trend in Growth of Area, Yield, and Production
The trend analysis of major agricultural crops in Aligarh District from 1994-95 to 2022-23 reveals distinct variations in the direction and magnitude of change in area, yield, and production. The regression equations, coefficients of determination, and linear trend lines shown in the graphs provide quantitative evidence of long-term patterns and consistency of agricultural growth. The area trends indicate that wheat, rice, pearl millet, and potato display positive tendencies, while maize, barley, sugarcane, mustard, and arhar exhibit declining or fluctuating patterns. The area under wheat remained generally stable with minor fluctuations, showing an almost horizontal trend line and a low coefficient of determination (R² = 0.0166), which indicates that the cultivated area of wheat did not change substantially over time. Rice recorded a strong positive linear trend with a high coefficient of determination (R² = 0.9309), signifying a consistent and significant increase in its cultivated area throughout the period. Pearl millet showed a weakly positive slope with a relatively low R² value (0.2062), indicating slight expansion in area but with noticeable fluctuations. In contrast, maize exhibited a clear downward trend with a slope value of -1,294.89 and R² = 0.4774, suggesting a steady decline in its cultivated area. Barley also followed a distinctly negative linear trend with R² = 0.7333, representing a continuous decrease in acreage. The area under potato recorded a strongly increasing trend with R² = 0.8779, confirming its steady and substantial expansion as a major commercial crop (Figure 3).
Sugarcane showed a gradual decline with R² = 0.6692, indicating contraction in its cultivation. Mustard displayed an overall negative slope with R² = 0.0027, showing little consistency in area change, while arhar revealed a strong declining trend with R² = 0.7133, signifying a long-term reduction in its cultivated area (Figure 3).
The yield trends demonstrate a generally positive direction for most crops, reflecting technological improvement and better management practices. Wheat yield showed a steady upward movement with R² = 0.4095, indicating gradual but consistent gains in productivity. Rice exhibited a similar increasing pattern with R² = 0.7201, showing notable progress in yield levels. Pearl millet displayed a distinctly rising yield trend with R² = 0.6880, suggesting significant improvement over time. Maize yield also increased consistently, with R² = 0.5000, indicating a moderate but stable upward trajectory (Figure 4).
Barley yield showed only a slight upward trend with R² = 0.0145, suggesting near-stagnant productivity throughout the period. Potato yield followed a strong positive trend (R² = 0.4006), reflecting a gradual increase in tuber productivity. Sugarcane yield exhibited a steady upward pattern with R² = 0.4747, while mustard yield showed a moderate increase with R² = 0.3428. Arhar yield remained almost static with a very low R² value of 0.0002, suggesting that its productivity levels have not improved appreciably during the study period (Figure 4).
Production trends, representing the combined effect of area and yield, reveal a mixed pattern across the crops. Wheat production shows a moderately increasing trend with R² = 0.4799, indicating gradual growth supported primarily by yield improvement rather than area expansion. Rice displays a strong upward trend with R² = 0.934, representing a continuous and consistent increase in production throughout the study period. Pearl millet also shows a positive production trend with R² = 0.6649, implying moderate growth driven largely by yield gains. Maize production, however, follows a declining trend with R² = 0.3863, indicating a reduction over time as a result of shrinking cultivated area. Barley shows a clear downward slope with R² = 0.7029, representing a persistent decline in total output. Potato production demonstrates a highly significant increasing trend with R² = 0.9194, confirming its emergence as the most rapidly growing crop in terms of output. Sugarcane production shows a downward trend (R² = 0.4364), while mustard production displays a modestly increasing trend with R² = 0.5057. Arhar production shows a distinctly negative trend with R² = 0.5379, reflecting a continuous decline in total output over time (Figure 5). Arhar’s persistently low R² for yield and strongly negative area trend reveal chronic underinvestment and climatic/pest pressures 35,36. Overall, the trend analysis highlights that the district’s agriculture has become increasingly differentiated by crop type. Crops such as rice, potato, and to a lesser extent mustard, show strong and consistent growth trends in both area and production, while wheat remains relatively stable. The yield patterns confirm a steady but moderate improvement for most crops, indicating gradual technological progress.32,37
Instability in Area, Yield, and Production of Major Crops
The Coppock Instability Index (CII) and coefficient of variation (CV) were used to assess the degree of instability in the area, yield, and production of major crops in Aligarh District from 1994-95 to 2022-23 (Table 3). These indicators measure the extent of year-to-year fluctuations in agricultural performance. Higher values of CII and CV indicate greater instability and lower consistency, while lower values suggest greater stability in crop performance. The sources of instability are crop specific: rice’s area instability reflects rapid expansion with occasional localized withdrawal due to water constraints and planting decisions; potato’s instability is strongly linked to seasonal price swings, storage cost variations and market access; sugarcane variability is tied to groundwater dynamics and mill institutional performance; arhar’s instability stems from rainfall sensitivity, pest incidence and volatile prices 21,31,35,38. The results presented in the Table 3 show notable differences in the stability levels of various crops across the three parameters. The instability in area indicates that wheat recorded the lowest variation, with a CV of 6.51 percent and a CII of 7.14 percent, suggesting that its cultivated area remained largely stable throughout the period. Pearl millet also showed a low level of area instability with a CV of 7.40 percent and a CII of 8.08 percent. In contrast, rice, maize, barley, potato, mustard, and arhar exhibited higher instability in their cultivated area. Rice showed a CV of 50.39 percent and a CII of 17.00 percent, reflecting a rapid expansion accompanied by fluctuations. Maize and barley had relatively high area instability, with CIIs of 18.64 and 34.24 percent respectively, indicating uneven patterns in their cultivation. Potato and mustard recorded even higher area variability, with CIIs of 26.26 and 53.10 percent respectively, while arhar and sugarcane also showed noticeable fluctuations, with CIIs of 27.97 and 39.95 percent respectively.
Instability in yield, as measured by CII, remained moderate for most crops. Wheat recorded a CII of 11.37 percent, showing consistent productivity over the years. Rice also exhibited moderate stability with a CII of 14.06 percent. Pearl millet, maize, and mustard showed comparatively higher yield variability, with CIIs of 17.36, 28.42, and 25.75 percent respectively, indicating moderate instability in their productivity. Barley and sugarcane recorded low yield instability, with CIIs of 13.12 and 8.21 percent respectively, suggesting relative steadiness in yield levels. Several scholars have analyzed the subject to explore patterns of similarity 2,18. Potato displayed a CII of 19.28 percent, indicating moderate fluctuation in its yield, while arhar exhibited the highest yield instability among all crops, with a CII of 33.65 percent, showing considerable inconsistency in its productivity performance.
Production instability, influenced jointly by variations in area and yield, was relatively high for most crops. Wheat showed a low CII of 12.69 percent, reflecting stable production over time. Rice recorded a CII of 23.63 percent, suggesting moderate fluctuations despite overall growth. Pearl millet exhibited a CII of 18.94 percent, while maize and barley recorded high production instability, with CIIs of 37.04 and 35.67 percent respectively. Potato and mustard showed considerable instability in production, with CIIs of 22.87 and 37.04 percent, indicating irregularities in output levels. Sugarcane production also displayed variability with a CII of 42.64 percent, while arhar showed the highest production instability, with a CII of 44.66 percent, indicating marked inconsistency in its total output across the years. Overall, the Coppock Instability Index analysis reveals that wheat was the most stable crop in terms of area, yield, and production, followed by rice and pearl millet, which also maintained moderate stability. Crops such as maize, barley, mustard, potato, sugarcane, and arhar exhibited relatively higher instability, reflecting irregular performance and greater sensitivity to changing conditions. Many researchers have analysed the similarities.
Limitations and Future Prospects
Although the study provides a comprehensive assessment of growth trends and instability in the area, yield, and production of major crops in Aligarh District, certain limitations must be acknowledged. The analysis is based solely on secondary data, and its accuracy depends on the reliability of official records. The study covers only nine major crops, thereby excluding minor and emerging crops that may also contribute to the district’s agricultural dynamics. In addition, the absence of block-level or spatially disaggregated analysis limits the understanding of intra-district variations in crop performance. Environmental and socio-economic factors such as rainfall variability, soil fertility, input costs, and policy influences were not quantitatively incorporated, though they play an important role in agricultural outcomes. Future studies should adopt an integrated approach combining climatic, soil, and socio-economic variables with geospatial tools like GIS and remote sensing to capture spatial heterogeneity more effectively. Expanding the scope to include technological adoption, irrigation efficiency, and policy impacts would further enhance understanding of the district’s agricultural transformation and support the formulation of strategies for sustainable growth.
Conclusion
The analysis of growth trends and instability in the area, production, and yield of major agricultural crops in Aligarh District from 1994–95 to 2022–23 reveals a complex picture of gradual progress alongside persistent challenges. The findings indicate that agricultural growth in the district has been largely yield-oriented, suggesting moderate technological advancement rather than extensive expansion of cultivated area. Wheat continues to dominate the cropping pattern, exhibiting stability in production and consistent though moderate improvements in yield. Crops such as rice, potato, mustard, and pearl millet have shown relatively stronger gains in both productivity and production, likely influenced by improved irrigation facilities, input accessibility, and farmers’ preference for more remunerative crops In contrast, maize, barley, sugarcane, and arhar recorded declining trends in both area and output, reflecting shifts in cropping choices, reduced profitability, and greater sensitivity to environmental and market fluctuations. The instability analysis further highlights that while wheat, rice, and pearl millet maintain relatively stable performance, crops like arhar, maize, and sugarcane experience high variability, indicating vulnerability to climatic and economic uncertainties. These results suggest that although agricultural development in Aligarh District shows signs of modernization and partial diversification, it remains uneven and constrained by structural and environmental factors.
Acknowledgment
The author gratefully acknowledges the Department of Geography, Aligarh Muslim University, for academic guidance and support throughout this research. Sincere thanks are also extended to the Directorate of Economics and Statistics, Government of India and Uttar Pradesh, for providing the necessary data for this study.
Funding Sources
The author(s) received no financial support for the research, authorship, and/or publication of this article.
Conflict of Interest
The authors do not have any conflict of interest.
Ethics Statement
This research did not involve human participants, animal subjects, or any material that requires ethical approval.
Informed Consent Statement
This study did not involve human participants, and therefore, informed consent was not required.
Permission to reproduce material from other sources
Not Applicable
Authors’ Contribution
Mohd Sajid Rayeen: Introduction, Results, Discussion and Conclusion.
Tariq Mahmood Usmani and Mohd Sajid Rayeen: Conceptualization, Methodology & Analysis, Final Review.
References
- Erenstein O, Jaleta M, Sonder K, Mottaleb K, Prasanna BM. Global maize production, consumption and trade: trends and R&D implications. Food Secur. 2022;14(5):1295-1319. doi:10.1007/s12571-022-01288-7
CrossRef - Sadiku MNO, Kotteti CMM, Sadiku JO. Agriculture in India. Int J Adv Sci Res Eng. 2024;10(2):1-11. doi:10.31695/IJASRE.2024.2.1
CrossRef - Hasan R, Khan DN. Temporal analysis of agricultural production and its performance in Uttar Pradesh, India. Int J Curr Microbiol Appl Sci. 2018;7(6):3503-3508. doi:10.20546/ijcmas.2018.706.410
CrossRef - Amin R, Kachroo J, Bhat A, Kachroo D, Singh SP, Isher AK. Status of growth in area, production and productivity of major crops in Jammu province of J&K state. Indian J Agric Res. 2017;51(4):333-338.
CrossRef - Hafner S. Trends in maize, rice, and wheat yields for 188 nations over the past 40 years: a prevalence of linear growth. Agric Ecosyst Environ. 2003;97(1-3):275-283. doi:10.1016/S0167-8809(03)00019-7
CrossRef - Kannan E, Sundaram S. Analysis of trends in India’s agricultural growth. Working Paper No. 276. Institute for Social and Economic Change; 2014.
- Panwar S, Dimri AK. Trend analysis of production and productivity of major crops and its sustainability: a case study of Haryana. Indian J Agric Res. 2018;52(5):571-575. doi:10.18805/IJARe.A-5019
CrossRef - Liliane TN, Charles MS. Factors affecting yield of crops. In: Amanullah, ed. Agronomy–Climate Change and Food Security. IntechOpen; 2020. doi:10.5772/intechopen.90672
CrossRef - Sarkar G. Changing patterns of agricultural productivity in Uttar Dinajpur district, West Bengal. Res Rev Int J Multidiscip. 2018;3(11):162-168.
- Sunita, Sanjay, Kavita, Bhatia JK, Mehta VP. Changing pattern of area, production and productivity of principal crops in Haryana, India. Int J Curr Microbiol Appl Sci. 2017;6(12):1654-1661. doi:10.20546/ijcmas.2017.612.186
CrossRef - Joshi GR, Joshi B, Joshi KR. Climate and yield variability of major cereal crops in Marsyangdi River Basin, Nepal. Acad Environ Sci Sustain. 2025;2(2). doi:10.20935/AcadEnvSci7772
CrossRef - Priyanka V, Achoth L, Vedamurthy KB, Siddayya, Gowda MNT. Crop diversity and trend patterns in Chikkaballapur: a comparative study of major crops. Mysore J Agric Sci. 2025;59(2):274-283.
- Machado S, Bynum ED, Archer TL, et al. Spatial and temporal variability of corn growth and grain yield: implications for site‐specific farming. Crop Sci. 2002;42(5):1564-1576. doi:10.2135/cropsci2002.1564
CrossRef - Li X, Liu N, You L, et al. Patterns of cereal yield growth across China from 1980 to 2010 and their implications for food production and food security. PLoS One. 2016;11(7):e0159061. doi:10.1371/journal.pone.0159061
CrossRef - Choudhari S, Kumbhar JS, Amale AJ, Shinde HR. Study of growth analysis and trend of area, production and yield of selected crops grown in Western Maharashtra. Int Res J Agric Econ Stat. 2013;4(1):10-17.
- Handral AR, Singh A, Singh DR, Suresh A, Jha GK. Scenario of changing dynamics in production and productivity of major cereals in India. Indian J Agric Sci. 2017;87(10):1371-1376. doi:10.56093/ijas.v87i10.75025
CrossRef - Akther S, Ahmad W, Wani NA, Ansari S. Growth and instability of foodgrain production in Uttar Pradesh: an economic analysis. Curr Agric Res J. 2025;13(1):338-346. doi:10.12944/CARJ.13.1.34
CrossRef - Ansari S, Ansari SA, Khan A. Does agricultural credit mitigate the effect of climate change on sugarcane production? Evidence from Uttar Pradesh, India. Curr Agric Res J. 2023;11(1):326-336. doi:10.12944/CARJ.11.1.29
CrossRef - Khan A, Ansari SA, Ansari S, et al. Growth and trend in area, production, and yield of wheat crops in Uttar Pradesh: a Johansen co-integration approach. Asian J Agric Ext Econ Sociol. 2023;41(2):74-82. doi:10.9734/ajaees/2023/v41i21850
CrossRef - Anjum S, Madhulika. Growth and instability analysis in Indian agriculture. Int J Multidiscip Res Dev. 2018;5(11):119-125.
- Khan N, Rehman A, Salman MS, Asif K. Trends and perspectives of sustainable potato production in Aligarh district, India. J Glob Resour. 2020;6(2):29-36. doi:10.46587/JGR.2020.v06i02.005
CrossRef - Sapkota BD. Trend and pattern of cereal crops: production, productivity and area coverage in Nepal. Patan Pragya. 2019;5(1):188-195. doi:10.3126/pragya.v5i1.30474
CrossRef - Aniruddhakayet, Dolai RK, Debasishmondal. Trends and patterns of yield rate of principal crops in West Bengal: an empirical analysis. Zenith Int J Bus Econ Manag Res. 2017;7(10):24-35.
- Debasis M, Kumarjit M, Lakshmikanta D. Trend, pattern and determinants of crop diversification of smallholders in West Bengal: a district-wise panel data analysis. J Dev Agric Econ. 2018;10(4):110-119. doi:10.5897/JDAE2018.0921
CrossRef - Kumar V. A study of India’s agriculture sector: issues, prospects and performance. Int Res J Manag Sci Technol. 2014;5(9):68-77.
- Samantaray LL. A study on the current trend of agricultural productivity in India and its future prospects. Int J Humanit Soc Sci Educ. 2015;2(4):16-21.
- Narwade DSS. Agricultural growth analysis: a study of Maharashtra state. Res J Econ Bus Stud. 2014;3(8):91-95.
- Singh U. Agricultural sector in Jharkhand: an overview of the performance. Int J Soc Sci Econ Res. 2020;5(12):4033-4043. doi:10.46609/IJSSER.2020.v05i12.023
CrossRef - Singh S. Agriculture development in India: a state level analysis. South Asian J Soc Stud Econ. 2020;6(2):17-34. doi:10.9734/sajsse/2020/v6i230162
CrossRef - Suman J, Singh H, Verma DK, Ahmad S. Effects of area, yield and their interactions on change in production of major crops in Rajasthan. Int Res J Agric Econ Stat. 2019;10(2):246-251. doi:10.15740/HAS/IRJAES/10.2/246-251
CrossRef - Kakar JS, Lodhi AS, Nazir A, Akhtar S, Iqbal MA. Cereal crops production in Pakistan: trends, instability and growth. Int J Agric Ext. 2023;11(2):201-207. doi:10.33687/ijae.011.002.4821
CrossRef - Tiwari GK, Kumar SS, Singh A, Babulal. A statistical study of trends of rice-wheat production in districts of Western U.P., India. Int J Curr Microbiol Appl Sci. 2019;8(6):2430-2443. doi:10.20546/ijcmas.2019.806.290
- Basa SR, Sahu KK. Trend of growth and productivity of horticultural products in India and Odisha. EPRA Int J Res Dev. 2021;6(5):313-323. doi:10.36713/epra6948
CrossRef - Olayiwola OO, Awasthi PK, Raghuwanshi NK. Growth and total factor productivity of principal crops in Madhya Pradesh. Indo-Am J Agric Vet Sci. 2013;1(2).
- Nisha, Baishali, Nain M, Aneja DR, Sanjeev. Trend and instability in area, production and productivity of food grains in Haryana vis-à-vis India. Adv Res. 2019;20(3):1-8. doi:10.9734/air/2019/v20i330159.
CrossRef - Ramadevi T, Reddy NRVR. Analyzing growth trends and instability in agricultural productivity: a study of Guntur district. Int J Sci Res Eng Manag. 2025.
- Bandyopadhyay S, Deshmukh K. Analytical study on spatio-temporal changes in crop combination of Nadia district, West Bengal. Int J Res Econ Soc Sci. 2017;7(11):16-28.
- Sahu A, Lakhera ML, Pandey KK. Predictive models for the area, production and productivity of the major pulse crops in different districts of northern hills of Chhattisgarh. Int J Appl Math Stat Sci. 2015;4(6):45-52.
- Ansari S, Ali N, Rashid M. Growth and instability of pulses production in Uttar Pradesh: a decomposition analysis. Asian J Multidiscip Res. 2022;11(1):71-81.
CrossRef - Ansari S, Ansari SA. Growth and instability of area, production, and yield under rice cultivation in Uttar Pradesh since 1991: a statistical analysis. Agric Ext J. 2023;7(2):1-7.
- Swain M. Sources of growth and instability in agricultural production in Western Odisha, India. Asian J Agric Dev. 2014;11(2):51-70.
CrossRef - Sihmar R. Growth and instability in agricultural production in Haryana: a district level analysis. Int J Sci Res Publ. 2014;4(7):1-12.
- Kumar A, Jain R. Growth and instability in agricultural productivity: a district level analysis. Agric Econ Res Rev. 2013;26:31-42.
- Ansari S, Ansari SA, Khan I. Foodgrain production in Uttar Pradesh since 1950: a study for growth and instability during period. Int J Adv Eng Manag. 2022;4(1):700-706.