
Introduction
Approximately 23.97 million hectares of Türkiye’s land area are suitable for agriculture. Field crops occupy 69.9% (16.75 million hectares) of the agricultural land, excluding fallow areas. Cereals cover about 71% of this area (11.89 million hectares). Among the cereal crops, wheat has the largest share at 57%, followed by barley with 27%, and corn with 8.1%.1
The demand for agricultural products is rising quickly as the world’s population grows. This demand is closely tied to seed quality; therefore, strengthening seed quality testing during planting, production, transportation, and sales is crucial. Currently, seed quality is manually assessed through measures like seed purity, moisture and lipid content, and seed viability, which is time-consuming and inefficient, making it inadequate for modern agricultural needs. Applying modern science and technology for seed quality control is vital for agricultural development and increasing grain production. To make quality control of agricultural products more automated and intelligent, a method combining spectral image processing and artificial intelligence is emerging. Among these, infrared spectroscopy and hyperspectral imaging are widely adopted by scientists because of their real-time and effective capabilities.2
The vitreousness of the grain in durum wheat serves as a crucial quality criterion, indicating its hardness and protein content. According to the TS 2974 Wheat Standard, the limits for vitreous grains in first, second, and third class wheats are 0-27, 28-35, and 36-50, respectively. If the vitreous grain content is 50% or more, the product is classified as Low-Quality Durum Wheat. As cereal experts know, detecting vitreous grains in durum wheat is a specialized task. In a 2010 study on determining the vitreousness of durum wheat using artificial neural networks and image processing techniques, two different neural network technologies were compared. The results showed an average test success rate of 97.5% for one technology and 100% for the other.2
In a 2017 study on differentiating common and durum wheat using Artificial Neural Network (ANN) technology, the measurement accuracy was determined to be 97.89%.3
In a study conducted in 2011, an artificial intelligence technology that separates objects into two classes was applied to the classification of wheat and barley samples, and successful results were obtained.4
In their 2015 study, Abdullah and Quteishat found they could classify wheat seeds with about 95% test accuracy by using a multilayer artificial neural network to differentiate between various wheat varieties.5
In a study conducted by Taner and colleagues in 2015, an ANN model was developed to classify durum wheat varieties. Input parameters included data such as thousand kernel weight, geometric mean diameter, sphericity, grain volume, surface area, bulk density, specific gravity, porosity, and color output parameter. The average relative error was found to be 0.009%, indicating that all results aligned with the true data.6
In another study, researchers took photographs of 13,611 dried legumes and worked to categorize them into seven different groups using four different machine learning methods. The most successful method was Support Vector Machines (SVM), which achieved 93% accuracy. The study predicts that classification accuracy could be improved by using Convolutional Neural Network (CNN) techniques that automatically extract features.7
In the literature, there are also examples of cereal classification using CNN techniques. Researchers achieved an accuracy of 97.47% in a study using a CNN architecture called SeedNet to classify seed images from a 1988 seed dataset into 23 different seed types.8 Similarly, in a study that used CNN-based techniques to classify rice grains by damage types, the goal was to categorize 8048 rice grains into 7 different damage categories. The study achieved an accuracy of 98.32%.9 These studies demonstrate that CNN models are an effective method for grain classification.
In the besatz analysis of cereals, efforts to reduce human intervention and produce rapid results are ongoing worldwide. In our study, data from classical method analysis results conducted by analysts according to the national standards10,11 were evaluated using the “Cgrain Value™ Instrument,” developed by the Sweden-based Cgrain Company. The instrument detects sound grains and besatz in common wheat, durum wheat, and barley products using imaging and artificial neural network technology.
This study differs from other studies that use imaging and artificial intelligence for grain analysis, as it includes a long-term field study with a large number of samples from various regions, each with distinct characteristics.
Material and Method
Material
In this study, samples of red and white wheat (Triticum aestivum), durum wheat (Triticum durum), and barley (Hordeum vulgare L.) of different varieties and qualities, grown in various regions of Türkiye, were used.
Physical Analysis Instrument
The Cgrain Value™ physical analysis instrument (Figure 1), developed by the Cgrain Company, Sweden. The instrument uses imaging and artificial neural network technology. It has a separate calibration model for each grain species that is to be analyzed. These calibration models were developed using image libraries containing samples from different countries. It is based on single kernel analysis. The Cgrain Value ™ Instrument’s patented 3D mirror design allows for 98% visualization of each grain’s surface, reducing error margins. In addition to sound grain and besatz analysis, physical data measurements of the sample, such as thousand kernel weight, volume, length, width, and color can also be performed with Cgrain Value™. Results are obtained using the calibration models loaded on the instrument without the need for an internet connection, and if desired, the analysis results can be exported.
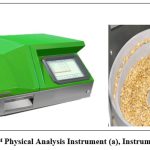 |
Figure 1: Cgrain Value™ Physical Analysis Instrument (a), Instrument sample chamber (b). |
Method
Two methods have been used to determine the besatz. One method involves expert analysts assessing the product’s group and quality through a visual inspection of the physical characteristics of the grains, which are extracted according to national and international standards. In the other method, the Cgrain Value™ physical analysis instrument is used.
Besatz is ‘all matter of a sample of grain other than the sound basic cereal’. In this study fractions defined after the pre-sieving (dockage) process are described as besatz. These are; Broken grains, grains damaged by sunn pest and aelia, germinated sprouted grains, grain impurities [weak and shrivelled grains (includes unripe-green grains and frost damaged grains), other cereals, grains damaged by pests, grains with blackened germ, mottled grain (only in durum wheat), grains overheated during drying] and miscellaneous impurities [extraneous seeds (includes other weed seeds and noxious seeds), extraneous matter (includes organic extraneous matter and inorganic extraneous matter), unsound grains (includes grains damaged by spontaneous heat generation or too extreme heating during drying, rotten grains, grains affected with fusariosis and other damaged grains), bunted-smutty grains, ergot, husks, impurities of animal origin], contrasting colored wheat in the common wheat and no vitreous grains in the durum wheat.
Sampling is not evaluated in this study. But used truly representative samples (ideally 1 kg or more) that were undamaged or unchanged during transport and storage.
According to TS 2974 Wheat and TS 4078 Barley Standards, the analysis process for determining the besatz can be briefly summarized as follows:
When the cereal sample arrives at the laboratory, a representative sample of around 1000 g is prepared by dividing and weighing to the nearest 0.1 g.
After the pre-sieving (dockage) process, the sample is divided into 50 g and 100 g portions through a sample divider to obtain a partial sample and weighed to the nearest 0.1.
A partial sample is spread on the analysis table and using tweezers, besatz are extracted.
Extracted besatz are weighed to the nearest 0.01 g and results are reported in weight (g) and percentage weight (% g).
The analysis process to determine the besatz in cereals with Cgrain Value™ can be briefly summarized as follows:
The pre-sieved sample is divided into 50 g and 100 g portions through a sample divider to obtain a partial sample and weighed to the nearest 0.1 g.
The desired calibration model is selected by pressing the “Models” button until the correct model is selected according to the species of the sample to be analyzed.
The partial sample is poured into the funnel on the top of the instrument.
The sample’s ID, quantity and any relevant comments about the sample are entered using the touch screen. The analysis process starts by pressing the “Start” button.
The analysis of the sample is completed within 3.5-5 minutes. When the analysis is completed, the result is presented on the built-in touch screen. Analysis results are reported in number, weight (g), and percentage weight (%g).
The Turkish Grain Board Product Technology Laboratory has categorized the data collected from nearly four years of studies using the Cgrain Value™ physical analysis instrument since June 2021 into two groups: laboratory and field studies.
Laboratory Studies
To develop calibration models, samples of red wheat, white wheat, durum wheat, and barley of various varieties and qualities were collected from all regions of Türkiye. Besatz were separated from these samples according to TS Standards. The sound grains and besatz components were then imaged in 3D using the Cgrain Value ™ Instrument. These images, along with the image libraries obtained from different countries by the manufacturing company, were used to build calibration models for red wheat, white wheat, durum wheat, and barley.
In the laboratory studies conducted to evaluate the performance of the calibration models, samples were analyzed according to TS Standards by two different analysts from the Turkish Grain Board Product Technology Laboratory. After the same samples were analyzed with the Cgrain Value™ Instrument, comparison charts were created. The repeatability and reproducibility values of the Instrument and analysts were determined.
The TMO Product Technology Laboratory is accredited according to the TS EN ISO/IEC 17025 general requirements for the competence of testing and calibration laboratories. The analysts assigned for physical analyses have been selected from qualified individuals who have conducted measurement uncertainty studies.
Field Studies
The Cgrain Value ™ Instrument has been installed at 14 different Turkish Grain Board purchasing points and used to analyze cereal products obtained from farmers. At each purchasing point, a different Turkish Grain Board expert analyst was assigned, with a total of 14 analysts participating in the study.
During the research period, the instrument’s 3D mirror was cleaned daily, and the recommended whole cleaning procedure by the Distributor Company Technical Service was carried out after each relocation. Working documents for the analysts have been prepared.
After turning on the instrument, control samples were analyzed. Pre-sieved sample is divided into 50 grams and analyzed with the selected calibration model.
After the instrument analysis process was completed, the same sample was analyzed by the expert analyst according to TS Standards, and the results were recorded in result form.
Instrument and analyst’s analysis results have been uploaded to the web-based portal. During the research, 2143 samples of red wheat, 776 samples of white wheat, 841 samples of durum wheat, and 364 samples of barley were analyzed with the instrument, and the results were transferred to the web portal. Of these, 606 red wheat, 206 white wheat, 280 durum wheat, and 148 barley samples were also analyzed by the analysts, and the results were transferred to the web portal.
Table 1: Number of samples analyzed by analysts according to purchasing points
|
Project Period |
Purchasing Point |
Instrument Serial Number |
Number of Red Wheat Samples |
Number of White Wheat Samples |
Number of Durum Wheat Samples |
Number of Barley Samples |
Number of Total Samples |
|
1.Period (03-14 June) |
İzmir/Işıklar |
875 |
120 |
22 |
2 |
0 |
144 |
|
Hatay/Reyhanlı |
872 |
60 |
35 |
19 |
1 |
115 |
|
|
2.Period (24 June-5 July) |
Denizli/Merkez |
875 |
52 |
76 |
129 |
62 |
319 |
|
Şanlıurfa/Merkez |
872 |
0 |
5 |
333 |
4 |
342 |
|
|
Mardin/Merkez |
864 |
7 |
11 |
65 |
4 |
87 |
|
|
3.Period (8 July-19 July) |
Konya/Merkez |
875 |
90 |
37 |
65 |
18 |
210 |
|
Tekirdağ/Süleymanpaşa |
872 |
500 |
0 |
0 |
0 |
500 |
|
|
Kırıkkale/Keskin |
864 |
147 |
45 |
0 |
20 |
212 |
|
|
4.Period (22 July-2 August) |
Kayseri/Tomarza |
875 |
72 |
168 |
72 |
56 |
368 |
|
Eskişehir/Çifteler |
872 |
427 |
61 |
4 |
13 |
505 |
|
|
Yozgat/Yerköy |
864 |
124 |
1 |
70 |
37 |
232 |
|
|
5.Period (5-16 August) |
Sivas/Ulaş |
875 |
21 |
77 |
82 |
75 |
250 |
|
Erzurum/Horasan |
872 |
262 |
219 |
0 |
74 |
555 |
|
|
Muş/Ahlat |
864 |
261 |
19 |
0 |
0 |
280 |
|
|
TOTAL |
2143 |
776 |
841 |
364 |
4119 |
After completing the analysis process at 14 different purchasing points, expert analysts individually reviewed images of all samples that ran in the instrument, put them in the correct groups, and obtained the true analysis results of the samples (corrected results).
New calibration models were created by Cgrain Company and uploaded to the instruments. Throughout the research period, all samples run in the instruments were re-analyzed using the new calibration models.
For comparing the analyst results and the true analysis results with the instrument results, deviation limits were established using the standard deviations from the Turkish Grain Board proficiency test reports and the standard deviations specified in the TS EN 15587 Standard.12 These values are shown in Table 2.
Table 2: Recommended Deviations According to EN 15587 And Turkish Grain Board Results
|
Grains damaged by sunn pest and aelia |
Grains with blackened germ |
Pest damaged grains |
|||
|
Ratio(%) |
Tolerance (±) |
Ratio(%) |
Tolerance (±) |
Ratio(%) |
Tolerance (±) |
|
0 – 1 |
0.5 |
0 – 2 |
2 |
0 – 1 |
0.8 |
|
1.01 – 2 |
0.8 |
2.01 – 4 |
3 |
1.01 – 2 |
1 |
|
2.01 – 3.5 |
1 |
4.01 – 8 |
4 |
2.01 – 3.5 |
1.2 |
|
3.51 and above |
1.5 |
8.01 and above |
6 |
3.51 and above |
1.5 |
|
Germinated sprouted grains |
Extreneous Seeds |
Extreneous Matter |
|||
|
Ratio(%) |
Tolerance (±) |
Ratio(%) |
Tolerance (±) |
Ratio(%) |
Tolerance (±) |
|
0 – 1 |
0.5 |
0 – 1 |
0.5 |
0 – 1 |
0,5 |
|
1.01 – 2 |
0.8 |
1.01 – 2 |
1 |
1.01 – 2 |
1 |
|
2.01 – 3.9 |
1 |
2.01 – 3.0 |
1.2 |
2.01-3.0 |
1.2 |
|
3.91 and above |
1.5 |
3.01 and above |
1.5 |
3.01 and above |
1.5 |
|
Broken grains |
Weak and Shrivelled grains |
Other Cereals |
|||
|
Ratio(%) |
Tolerance (±) |
Ratio(%) |
Tolerance (±) |
Ratio(%) |
Tolerance (±) |
|
0 – 2.0 |
0.8 |
0 – 2.0 |
0.8 |
0 – 2 |
0.8 |
|
2.0 – 5.0 |
1.2 |
2.0 – 5.0 |
1.2 |
2.01 – 3 |
1.2 |
|
5.01 – 7.0 |
1.5 |
5.01 – 7.0 |
1.5 |
3.01 – 5.0 |
1.5 |
|
7.01 and above |
1.8 |
7.01 and above |
1.8 |
5.01 and above |
1.8 |
|
Unsound Grains |
Husk |
Ergot |
|||
|
Ratio(%) |
Tolerance (±) |
Ratio(%) |
Tolerance (±) |
Ratio(%) |
Tolerance (±) |
|
0 – 0.5 |
0.3 |
0 – 0.1 |
0.2 |
0 – 0.05 |
0.2 |
|
0.51 – 1.5 |
0.6 |
0.11 – 0.3 |
0.3 |
0.06 – 0.2 |
0.3 |
|
1.51 – 2.90 |
1 |
0.31 – 3.0 |
0.7 |
0.21 – 1.0 |
0.5 |
|
2.91 and above |
1.5 |
3.01 and above |
1 |
1.01 and above |
0.8 |
|
Mottled (stained) grains |
Nonvitreuos grains |
Contrasting color wheat |
|||
|
Ratio(%) |
Tolerance (±) |
Ratio(%) |
Tolerance (±) |
Ratio(%) |
Tolerance (±) |
|
0 – 2 |
0.8 |
0 -10 |
2 |
0 -10 |
1.2 |
|
2.01 – 5.0 |
1.2 |
10.1 -20.0 |
3.5 |
10.01 -20.0 |
3.2 |
|
5.01 – 7.0 |
1.5 |
20.1 -30.0 |
5 |
20.01 -30.0 |
5.2 |
|
7.01 and above |
1.8 |
30.1 -40.0 |
6.5 |
30.01 -40.0 |
7.2 |
|
40.1 -50.0 |
8 |
40.01 -50.0 |
9.2 |
||
|
50.1 -60,0 |
9.5 |
||||
|
60.1 -70.0 |
11 |
||||
|
70.1 -80.0 |
12.5 |
||||
|
80.1 -100.0 |
14 |
||||
Repeatability values between true analysis results and instrument results were calculated and evaluated for red wheat, white wheat, durum wheat, and barley samples. IBM SPSS Statistics 23 software was used to calculate repeatability values, and the gplots13 and heatmap14,15 packages in RStudio software were used to plot heatmap graphs of these values.
Results
According to the analysis results repeatability values and the reproducibility values which are calculated from the differences between the results determined by the analysts and the Cgrain Value™ Instrument results, are in accordance with the TS EN 15587 Standard.12
Examining the repeatability and reproducibility values of red wheat, the repeatability value is 0.2 determined for other cereals, which is lower than the repeatability limit of 1.34 defined in the TS EN 15587 Standard.12 The reproducibility value of red wheat samples is 0.2, which is lower than the reproducibility limit of 1.95 defined in the TS EN 15587 Standard.12
For white wheat samples, the repeatability value determined as 0.5 the percentage of grains with blackened germs is lower than the repeatability limit of 1.48 defined in the TS EN 15587 Standard12. The reproducibility value of white wheat samples is 0.62, lower than the reproducibility limit of 2.0 defined in the TS EN 15587 Standard.12
The repeatability value of durum wheat is 0.3 determined for the broken grains, which is lower than the repeatability limit of 0.75 defined in the TS EN 15587 Standard.12 The reproducibility value of durum wheat samples is 0.28, which is lower than the reproducibility limit of 1.06 defined in the TS EN 15587 Standard.12
For the barley samples, the repeatability value is 0.3 determined for the germinated sprouted grains, which is lower than the repeatability limit of 0.58 defined in the TS EN 15587 Standard.12 The reproducibility value of barley samples is 0.64, which is lower than the reproducibility limit of 0.78 defined in the TS EN 15587 Standard.12
When evaluating the instrument results, the distance between the instrument analysis results obtained from re-analysis and the true analysis results (corrected results) obtained by expert analysts after the image correction process was calculated. In this calculation, the deviation limits provided in Table 2 were used. The analysis results obtained from the instrument are summarized in Table 3, which displays the number of samples within the deviation limits for each fragment, both in count and percentage.
Table 3: Comparison of true analysis results with instrument analysis results
|
Parametre |
Red Wheat Sample Remaining Within Deviation Limits |
White Wheat Sample Remaining Within Deviation Limits (707 Samples) |
Durum Sample Remaining Within Deviation Limits (841 Samples) |
|||
|
Count |
% |
Count |
% |
Count |
% |
|
|
Grains damaged by sunn pest and aelia |
1360 |
96.9 |
692 |
97.9 |
821 |
97.6 |
|
Weak, shrivelled grains |
1394 |
99.4 |
686 |
97.0 |
831 |
98.8 |
|
Broken grains |
1394 |
99.4 |
705 |
99.7 |
822 |
97.7 |
|
Other cereals |
1391 |
99.1 |
702 |
99.3 |
832 |
98.9 |
|
Grains with blackened germ |
1392 |
99.2 |
705 |
99.7 |
833 |
99.0 |
|
Pest damaged grains |
1401 |
99,9 |
702 |
99.3 |
834 |
99.2 |
|
Contrasting color wheat |
1310 |
93.4 |
649 |
91.8 |
– |
– |
|
Nonvitreous grains in durum wheat |
768 |
91.3 |
||||
When the results in the table are examined, it is seen that the lowest success rate of the instrument’s analysis is 91.3% for the nonvitreous grains in the durum wheat sample, and the highest success rate is 99.9% for the pest-damaged grains in the red wheat sample. It is realized that all the besatz results were close to the true values and were obtained with a high degree of accuracy.
The repeatability coefficients (intraclass correlation coefficients) between the true analysis results and the instrument analysis results for the following fragments in red wheat, white wheat, and durum wheat; broken grains, sunn pest and aelia damaged grains, other cereals, grains with blackened germs, weak and shrivelled grains, pest-damaged grains, contrasting colored wheat (in common wheat), and nonvitreous grains (in durum wheat) were calculated in Table 4.
Table 4: Repeatability coefficients between true analysis results and instrument analysis results (intraclass correlation coefficients).
|
Red wheat |
White wheat |
Durum wheat |
|
|
Broken grains |
0.987 |
0.986 |
0.969 |
|
Grains damaged by sunn pest and aelia |
0.891 |
0.948 |
0.959 |
|
Weak, shrivelled grains |
0.972 |
0.948 |
0.921 |
|
Other cereals |
0.997 |
0.994 |
0.998 |
|
Pest damaged grains |
0.921 |
0.827 |
0.926 |
|
Grains with blackened germ |
0.968 |
0.933 |
0.907 |
|
Contrasting color wheat |
0.965 |
0.886 |
* |
|
Nonvitreous grains |
* |
* |
0.972 |
All the repeatability coefficients given in Table 4 were found to be statistically significant (p<0.001). These coefficients give us a measure of the agreement between the instrument results and the true analysis results. Looking at the overall results, the highest repeatability coefficient was calculated in the durum wheat and other cereals category with 99.8% (p<0.001), and the lowest repeatability coefficient was calculated in the white wheat pest-damaged grains category with 82.7% (p<0.001). For all the fragments given in the table, the agreement between the true analysis results and the instrument analysis results in wheat varieties was found to be near perfect and statistically significant (p<0.001). Therefore, the accuracy obtained when these analyses are performed with an instrument instead of classical methods will be the same as the true analysis results.
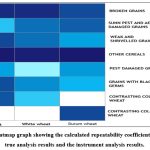 |
Figure 2: Heatmap graph showing the calculated repeatability coefficient between the true analysis results and the instrument analysis results. |
When examining Figure 2, the data shown entirely in white represents data where no measurements were taken, and therefore repeatability coefficients were not calculated for these areas. Looking at the graph as a whole, the repeatability coefficients are almost entirely 90% or higher, indicating that the instrument analysis results are quite close in accuracy to the true analysis results.
Discussion
The physical analysis performed to determine the quality of the product takes longer due to the high number of parameters, which sometimes leads to increased congestion at grain purchasing points. Physical analysis of grains is a subjective type of analysis that requires long-term training and experience. Analysis results vary between parallels and between laboratories depending on factors such as the analyst’s experience and education level, physical and mental state, laboratory environmental conditions, etc. Analyzing a sample and generating the analysis report takes approximately 15-30 minutes at grain purchasing points and 30-45 minutes in laboratories. These times are negatively impacted by an increase in the proportion of elements other than sound grains within the sample. In physical analysis determination, it is as important for the analysts to be experts as it is for them to see each particle in the analyzed sample from 360 degrees, as their expertise also affects the analysis result. Literature studies often emphasize the success rates in evaluating photographs of grains to be classified using different machine learning methods.3-10 The Cgrain Value™ physical analysis device used in this study takes photographs of the grains present in the prepared samples at a specific material flow rate and captures 95% of the grain projection surface. While images of the samples in the device’s chamber are being obtained, the components within the samples are also being classified. From this perspective, the Cgrain Value™ physical analysis device is a final product that can classify grains according to relevant TSE Standards10-12 using patented software and hardware components. In this study, the device’s performance under real working conditions at grain purchasing points was evaluated, and the device’s analysis results were found to be statistically consistent with the analyses performed by experts. It was also stated that the duration of the analysis performed by the analysts during the study varied depending on the sample content but lasted 15-30 minutes, while the analyses performed with the Cgrain Value™ physical analysis device were completed in 3-5 minutes.
Conclusion
In this study, two different methods used to determine the besatz fragments of red wheat, white wheat, durum wheat, and barley samples were compared. When examining the data obtained from the laboratory and field studies conducted for this purpose, it was observed that the repeatability and reproducibility values of the instrument results remained within the deviation limits defined in the standards.
Analyses performed with the Cgrain Value™ Instrument were completed in a shorter time and with a success rate of over 90%, as shown in Table 3. The findings of the research indicate that the Cgrain Value™ Instrument can be effectively used for analyzing cereals with its current calibration models.
Artificial intelligence technology has emerged recently as a groundbreaking tool across various industries, including food processing. Its use can reduce costs over time, enhance yields, and produce reliable results in cereal physical analysis. As the instrument becomes more widely used, each fragment displayed will contribute to improving its calibration library, increasing the success rate from over 90% toward 100%.
Acknowledgment
The authors would like to express their gratitude to the aforementioned institutions for providing the data obtained as a result of the studies conducted based on the protocols signed between the Turkish Grain Board Product Technology Laboratory and ABP Ölçü Kontrol Sistemleri İthalat Pazarlama Ltd. Şti. on 22/09/2021 and 22/05/2024, respectively, which enabled them to prepare this article.
Funding Sources
The authors received financial support from ABP Ölçü Kontrol Sistemleri İthalat Pazarlama Ltd. Şti. for publication of this article GRANT no: 2772.
Conflict of Interest
The authors do not have any conflict of interest.
Data Availability Statement
The manuscript incorporates all datasets produced or examined throughout this research study.
Ethics Statement
This research did not involve human participants, animal subjects, or any material that requires ethical approval.
Informed Consent Statement
This study did not involve human participants, and therefore, informed consent was not required.
Author Contributions
Sibel MARAŞ: Data Collection, Analysis, Methodology, Writing – Original Draft.
Rukiye ŞAHİN: Data Collection, Analysis, Methodology, Writing – Original Draft.
Maksut Barış EMİNOĞLU: Conceptualization, Writing – Review & Editing.
Ufuk TÜRKER: Supervision, Writing – Review & Editing.
References
- TUİK (2024). Plant Production Statistics. https://data.tuik.gov.tr/Bulten/Index?p=Bitkisel-Uretim-Istatistikleri-2024-53447 (Access date: 04.05.2025)
- Long, W, Jin, S, Lu, Y, et al. A Review of Artificial Intelligence Methods for Seed Quality Inspection based on Spectral Imaging and Analysis. 5th International Conference on Computer Science and Information Engineering (ICCSIE 2020) 23-25 October 2020, Dalian, China. DOI: 10.1088/1742-6596/1769/1/012013
CrossRef - Babalık, A, Botsali, FM. Yapay Sinir Ağı ve Görüntü İşleme Teknikleri Kullanarak Durum Buğdayının Camsılığının Belirlenmesi. Selçuk-Teknik Dergisi, 2010; Vol. 9, No 2, 163- 174.
- Sabanci, K, Kayabasi, A and Toktas, A. Computer vision-based method for classification of wheat grains using artificial neural network. Sci. Food Agric., 2017; 97: 2588-2593.
CrossRef - Guevara-Hernandez, F, Gomez-Gil, J. A machine vision system for classification of wheat and barley grain kernels. Spanish Journal of Agricultural Research, 2011; 9 (3) 672-680. DOI: https://doi.org/10.5424/sjar/20110903-140-10
CrossRef - Abdullah, NA and Quteishat, AM. Wheat Seeds Classification using Multi- Layer Perceptron Artificial Neural Network. International Journal of Electronics Communication and Computer Engineering, 2015; 6 (2) 306-309
- Taner, A Tekgüler, A, Sauk, H. Classification of durum wheat varieties by artificial neural networks. Anadolu Tarım Bilimleri Dergisi, 2015; 30 (1) 51-59
CrossRef - Koklu, M, Ozkan, İA. Multiclass classification of dry beans using computer vision and machine learning techniques, Computers and Electronics in Agriculture, 174 (2020): 1-11.
CrossRef - Loddo, A, Loddo, M, Di Ruberto, C. A novel deep learning based approach for seed image classification and retrieval, Computers and Electronics in Agriculture, 187 (2021): 1-11.
CrossRef - Bhupendra, Moses, K, Miglani, A, Kankar, P K. Deep CNN-based damage classification of milled rice grains using a high-magnification image dataset, Computers and Electronics in Agriculture, 2022; Volume 195. https://doi.org/10.1016/j.compag.2022.106811.
CrossRef - Anonymous (2018). TSE 2974, Buğday, Mart 2018.
- Anonymous (2018). TSE 4078, Arpa, Mart 2018.
- Anonymous (2019). EN 15587 Cereals and cereal products – Determination of Besatz in wheat (Triticum aestivum L.), durum wheat (Triticum durum Desf.), rye (Secale cereale L.), triticale (Triticosecale Wittmack spp) and feed barley (Hordeum vulgare L.) January 2019.
- Warnes, GR, Bolker, B, Bonebakker, L, et al. gplots: Various R Programming Tools for Plotting Data. R package version 3.1.1. 2020. https://CRAN.R-project.org/package=gplots
- Kolde, R. pheatmap: Pretty Heatmaps. R package version 1.0.12. 2019. https://CRAN.R-project.org/package=pheatmap