

Introduction
Achieving proper integration of smallholder agricultural households into three levels namely; local, national, and international agricultural markets has overtime been advocated as a viable strategy towards achieving the sustainable development goal.1,2, 6 Arguably, market participation of smallholders is opined to contribute towards agricultural growth and development, thereby bringing about the much-anticipated structural transformation in the agricultural sector and a shift towards the mitigation of poverty and staggering food insecurity of agricultural households in the Sub-Saharan Africa (SSA).2
It has been reported that about two-thirds of the developing world’s 3 billion rural people live in about 475 million small farm households, working on land plots smaller than 2 hectares.3,21 Many are poor and food insecure and have limited access to markets and services.
Smallholder farmers as farmers with a low asset base and operating less than two hectares of cropland.4, 10 It was define as farmers with small landholdings and associated characteristics including dependence mostly on household labour for production and low use of technology.5
Considering markets as an all-important aspect in market participation, markets are referred to as prerequisites for enhancing agriculture-based economic growth and increasing rural incomes in the medium term particularly for the rural poor farming households.6 It is evident that subsistence food crop production cannot improve rural incomes substantially without market-oriented production systems. These require the intensification of agricultural production systems, increased agricultural commercialisation and specialisation in higher-value crops (not only cash crops but some food crops like cassava etc). These must be built upon the establishment of efficient and well-functioning markets and trade systems–ones that keep transaction costs low, minimise risk, extend information to all players and that do not either exclude or work contrary to the interests of the poor–especially those living in areas of marginal productivity and weak infrastructure.6
In most developing countries, agriculture is an important part in the livelihoods of rural people. In recent years, producers in general and especially smallholder farmers have faced considerable difficulties in practice and agricultural services. Market access is a real limit to the promotion of agricultural products. The markets are important in the subsistence strategy of most rural households. Not only because most of the production resources come from the market but mostly it the only way for producers to sell their product. It is also on the same market that they spend income earned from their production. Market access also gives players the opportunity to specialise according to comparative advantages of ownership and therefore enjoy the trade earnings.7, 40
It is therefore imperative to find a way of improving market participation both in food crops and livestock and its value chain actors with high value for food and nutrition security. Since investments in services meant to encourage people to remain in rural areas have often recorded, at best, partial success, the identification of ways to increase the returns to agriculture through market participation, is a research challenge of critical importance.7 As the agricultural sector in developing countries is witnessing a gradual transformation towards commercialisation, smallholder farmers are encouraged to embrace systems that are responsive to their needs: access to markets, market information, market intelligence and effective farmer organisation.8, 9, 20
Moreover, advancement in market orientation and participation is therefore needed to link smallholder farmers to markets so as to have suitable market for agricultural produce as well as to receiving boost for income generation. It is therefore, expedient to explain the scope of various market participation methods or options available to smallholder farmers from the farm to the end users.
The objective of this paper is to critically review the concepts, theories, empirical studies and methodological approaches used in Smallholder market participation Analysis with special focus on smallholder farmers in Sub-Saharan Africa (SSA). Therefore, this paper also revealed the strengths and limitations of the major methodological approaches commonly used in SSA. This review heavily relied on sources such as; selected peer-reviewed journal papers (mostly from SSA), textbooks, handbooks, conference proceedings, bulletins, magazines, online materials that are relevant to this study were carefully consulted.
Basic Concepts of Smallholder Market Participation
Market Orientation
Market orientation is the organisation-wide generation of market intelligence pertaining to current and future customer needs, dissemination of the intelligence across departments, and organisation-wide responsiveness to it.11 The concept of market orientation has been used more widely in the manufacturing sector (e.g. the food industry) to refer to the extent to which a producer uses knowledge about the market (especially customers and prices), as a basis to make decisions on the three basic economic questions of what to produce, how to produce and how to market.10
Market orientation in agriculture is fundamentally a production decision issue as influenced by production conditions and market signals.10, 11 Market orientation in agriculture was defined as the degree of allocation of resources (land, labour and capital) to the production of agricultural produce that are meant for exchange or sale.7, 11
Arguably, the earliest study of behaviour as an obstacle to market orientation is that of 12 and later by.7 In a detailed investigation of potential impediments,12 identifies and discusses four potential pitfalls to market orientation, namely: lack of inter-functional integration; political manoeuvring; weak management skills; and executive inexperience.12 It has also been argued that such behavioural obstacles can severely restrict market orientation development and thus organisational performance.12 There are uncovering seven main barriers to developing market orientation at the shop floor level which include: instrumentalism; short-termism and weak management support.13 While focus on shop floor workers, he also suggests that management attitudes and actions are of paramount importance.13
Smallholder Market Participation and Transactions Costs
Transactions costs reflects a lot of impediments to market participation by smallholder farmers and have been used as a definitional characteristic of smallholders and as factors responsible for significant market failures in developing countries.14, 15, 77 Transaction costs, occasionally referred to as “hidden costs”, are the observable and non-observable costs associated with exchange of goods and services.2,9,77 These costs arise due to the frictions involved in the exchange process as it entails transfer and enforcement of property rights. Transactions costs can explain why some farmers participate in markets while others are simply self-sufficient. Differences in transactions costs as well as differential access to assets and services to mitigate these transactions costs are possible factors underlying heterogeneous market participation among smallholders.2, 16
Transactions costs are mainly categorized into fixed and proportional (or variable) transactions costs.17, 77
Fixed Transaction Costs (FTCs) are invariant to the volume of output traded and affect smallholder farmers’ market participation decisions. They include the costs of:
(a) Searching for a trading partner,
(b)Negotiating and bargaining, particularly when there is imperfect information about prices, and
(c) enforcement of contracts and supervision, particularly when credit sales are involved, as the sellers have to screen the buyers for reliability and lower the likelihood of defaults.18, 77
Variable or Proportional Transaction Costs (PTCs), on the other hand, are per unit costs of accessing markets that vary with the volumes traded and may affect the decision to participate in the market as well as the quantity traded. They include costs associated with transferring the output being traded, such as transport costs and time spent delivering the product to the market. These costs are largely infrastructure, lack of market transport, lack of market information, insufficient expertise on use of grades and standards, inability to conclude on contractual agreements, and poor organizational support, have led to inefficient use of different markets.26
Market Participation and Market channels
Market participation is one of the key concepts in agribusiness management and has been defined differently by various authors. It is regarded as participation in any market related activity which encourages the sale of produce, as the individual farming household’s economic transactions with others in cash or kind or commercialization.6, 19 Market participation is also viewed as the integration of subsistence or semi-subsistence farmers into the inputs and output markets of agricultural products, with the aim of boosting their income level resulting in poverty reduction.9, 20 The concept of market orientation, commercialisation or participation refers to the percentage of marketed output from total farm production. Farmers’ market access is a vital component of market participation. A smallholder farmer can access the market either by selling to a buyer at the farm gate or physically transporting the produce to the market place using available means.21, 24
A market channel is simply the pathway through which a commodity moves from its raw state or form to the finished product or the pathway of a product as it moves from the producers to the final consumers.13,22 Marketing channels are important in evaluating marketing system because they indicate how the various market participants are organised to complete the movement of the product from the producer to the final consumer.13 Marketing channel23 is categorized as centralised and decentralised channels.23 Following the above definition and categorisation, a centralised marketing channel is one in which the farmer’s produce are brought together in larger central and terminal markets. There, they are purchased by the processor or wholesalers from commission men and brokers who act as the farmers’ selling agents. A decentralized channel on the other hand is one that does not use such established large market facilities, rather wholesalers and processors purchase directly from the farmers. Marketing channel is the sequence of intermediaries or middlemen and the marketers through which goods pass from producers to consumers.13 Thus, marketing channels are more valuable because it shows at a glance various agencies and ways the product moves. It also helps in assessing performance of a market. If the route is too long, this shows that there are too many middlemen in the marketing system and the cost is likely to be high. In the another study, it reported that four marketing options are available to the farmers, these are: (i) farm gate (ii) local market/ village market (iii) contract sales (iv) family and friends.6 It was revealed from the findings of another studies6, 24 that marketing channels preferred by more than half of the farmers was selling their produce at the farm gate although, the price offered is often not competitive, the farmers opt for this due to lack of storage facilities and high transaction cost.6
Markets and improved market access play an important role in improving the incomes of smallholder farmers in the developing countries.12, 25 Despite this, participation of smallholder farmers in markets in most sub-Saharan African countries remains low due to a range of constraints. One of these constraints is poor market access.26, 77 Many farmers lack sufficient means to overcome the costs of entering the market due to high transaction costs8, 12 while poor infrastructure and weak institutions raise transaction costs that invariably affect production and market participation decisions. Large numbers of smallholder farmers are located in far distant rural areas with pitiable transport channels and devastating market infrastructures.77 In addition, they did not have access to dependable market information as well as information.25, 77 Furthermore, in many instances, the smallholder farmers do not possess the level of assets required to protect themselves from market, natural, political and social shocks. The private asset accumulation, public infrastructure and services are the prerequisites for smallholders to escape from subsistence production and produce marketable surplus.8, 77 Commercialisation of the agricultural sector in SSA requires improving the ability of smallholder farmers to produce marketable surplus and participate actively in both input and output markets. In order to boost market participation and rural households’ incomes will require better understanding the factors influencing smallholder market participation and level of participation.77
Theoretical Framework
Theory of Utility
Utility is referred to a measure of relative human satisfaction. It is often modeled to be affected by consumption of various goods and services, possession of wealth and spending of leisure time.1 Farmers cultivate land so as to satisfy his physiological needs of feeding, and/or to acquire more wealth by commercialising his activities on the farm.6 Utility functions measure producer’s preferences for wealth and the amount of risk they are willing to take in the hope of reaching greater wealth.1 Smallholder farming households make certain decisions about what type of crop(s) to cultivate, how much to be cultivated, when and where to actually sell or market the produce which would result into maximum satisfaction from their labour in term of returns.6
The household is assumed to maximize utility (U) by choosing how much of each product or service to consume ci, produce qi, buy bi, and sell si, subject to a standard set of constraints: cash constraint, resources availability, and the production function. The cash constraint shows that the total value of purchases of the household must be equal to or less than its income earned by selling staple or cash crops it produces and the revenue it generates by supplying labor and other services.2 This effectively assumes away the possibility of borrowing or lending, but the endowment can technically incorporate household savings from previous years or seasons. Given market determined prices (pi*), the household maximizes the utility function subject to Eqs.2 (i)-(iv)2
Max U (ci; zu) … (1)
![]()
ci ≤qi – si + bi + ei,i= 1, ………., N … (3)
f(qi; zq) ≥ 0. … (4)
Where zu and zq, respectively, are exogenously determined consumption and production shifters and f is the production technology. Transactions costs can influence the household decision on whether or not to participate in markets for goods or services. Three possibilities can be identified as below recognising that smallholder farming households face different prices when they are sellers or buyers, which can be represented by2
pi*= pi– τi(Z, A, G, Y) if si> bi(net seller) … (5)
pi*= pi+τi (Z, A, G, Y) if si< bi(net buyer) … (6)
pi*= pia if si = bi = 0 (self-sufficient/autarkic) … (7)
Where pi are market prices; τi are commodity-specific transaction costs, determined by: (i) household characteristics (e.g., distance to markets, household size, age and education of household head among others) Z; (ii) assets owned by the household (land, family labour, capital) A; (iii) infrastructure provided by the government (e.g., good road network, irrigation facilities and extension services), G; and (iv) liquidity position of the household Y.2, 10
Transaction Cost Theory
The transaction cost theory hinged on the fundamental study of Coase who gave a distinction between the firm and a market.28,29 The theory opined that smallholder farmers would not be encouraged to participate actively in the market if the transaction costs are not kept at the barest minimum level. According to the ‘New Institutional Economics’ approach which revealed that institutions possess transaction cost minimising arrangements which may change and evolve with changes in the nature and sources of transaction costs.8,30
Transaction costs may be referred to as ‘hidden costs’ which may be observable and/or non-observable costs linked with the exchange of goods and services.93
It was reiterated that market exchange is not without cost.28.93 Costs are incurred due to bottlenecks encounter in the exchange process, as it involves the transfer and enforcement of property rights.
Considering past works that are germane to this theory such as7, 17, 31 (as cited in 9,32) who categorised these costs into fixed and variable transaction costs which have been discussed earlier. Fixed Transactions Costs (FTCs) are not varying (constant) to the volume of output marketed and capable of influencing smallholder farmers’ market participation decisions6. These include the costs of (a) searching for a trading partner, (b) negotiating and bargaining, especially in the situation of imperfect information about prices, and (c) enforcement of contracts and supervision, mostly when credit sales may not be avoided, as the sellers have to screen the buyers for reliability and lower the likelihood of defaults. Variable or Proportional Transaction Costs (PTCs), on the other hand, are per unit costs of accessing markets that vary with the volumes traded and are capable of influencing the decision to participate in the market as well as the quantity marketed.2 They include costs associated with transferring the output being marketed, such as transport costs and time spent delivering the produce/products to the market. These costs are always unobservable or cannot be easily penned down in a survey. Conversely, the PTCs raise the real price of the commodity purchased and lower the real price received for commodity sold.6
Agricultural Household Models (AHMs)
Agriculture remains a major source of income for the majority of the population in most developing countries.4 It is also an important earner of foreign exchange and a focal point of government policy. Efforts to predict the consequences of agricultural policies, however, are often confounded by the complex, behavioural interactions characteristic of semi-commercialized rural economies.94 Most households in agricultural areas produce partly for sale and partly for own consumption.94 They also purchase some of their inputs (for instance fertilizer and labour) and provide some inputs from their own resources (for instance family labour).16 Any change in agricultural policy will therefore affect, not only production, but also consumption and labour supply.29
There are two basic types of AHMs. They are:
- Separable (Complete Markets) AHMs
- Non-separable (Missing Markets) AHMs
AHMs are best used when: (1) the rule of separability holds (2) we are interested in the consumption side of the model, and: (a) we expect the profit effect to be large (b) farm profits are a large share of full income, and/or (c) the income elasticity of the commodity of interest is high (3) there are multiple, important market failures (missing or imperfect markets).5, 62
Separable (Complete Markets) AHMs
Under certain circumstances, the only interdependence between the household and firm activities of an agricultural household is income. In this case, the production activities of the household can be analysed separately from the consumption activities, the model being split into profit maximising and utility maximising components, thus making the model separable. This splitting makes the empirical analysis much more tractable. The two major assumptions of separable AHMs are:
(i)Households can trade on a complete set of perfectly competitive markets, including insurance and credit markets. This implies that the household is a price-taker for all goods produced and consumed; including family labour and that the goods should be homogenous
(ii)The household is the appropriate unit of analysis (not the individual or a group of households) that is the household is treated as a single decision maker.
A basic separable AHM is given below
Notations:F = Food, C = Consumption, NF = Non-food, CF = Food Consumption, CNF = Non-food Consumption, ℓ = Leisure, QF = Output, L = Labor used in production (both household labor and hired labor), X = other input used, T* = Total time available to the household, W = Wage Rate, H=Household Labour, Pi=Price of commodity i (i = F, NF, X), p* = Farm Profit, MaxU (CF, CNF, ℓ), subject to three constraints14:
- Production: Q = f(L, X)
- Time: T* = H + l
- Full Income: PF (QF – CF) + W (H – L) = PXX + PNF CNF
Where PF (QF – CF) is marketed surplus (+ if net seller, -if net buyer)
W (H – L) Is marketed labour (+ if net seller, -if net buyer)
These three constraints can be combined into one “full income” constraint
(PFf (L, X) – PXX – WL) + W x T* = p* + W x T* = PFCF + PNF CNF + Wℓ
(Farm profit) (Full value of Time)
Non-separable (Missing Markets) AHMs
Household production and consumption decisions are non-separable whenever the household shadow price of at least one production-consumption good is not given exogenously by the market but instead is determined endogenously by the interaction between household demand and supply.33 This implies that there are multiple, important market failures (missing or imperfect markets). A market fails when the cost of a transaction through market exchange creates disutility greater than the utility gain that it produces, with the result that the market is not used for the transaction. Either a surrogate institution will emerge to allow the transaction to take place or the transaction simply does not occur. The nonexistence of a market is the extreme case of market failure.14, 62 Sources of non-separability include14,34: (1) Transactions costs(i)distance to market (ii) high transport costs (iii) excessive marketing margins (e.g., traders with monopoly power) (2) Thin markets (i) covariate production (ii) isolated or remote markets (ii) Fewer buyers and sellers(3)Risk and risk aversion e.g. risk/uncertainty and no insurance market (4) Participation constraints – e.g., in credit, labor, land, other input markets, and/or product markets.
A basic non-separable AHM as stated in2 and34 is presented below.
Assume an agricultural household maximising utility (U) by choosing levels of goods consumed (c), produced (q > 0), bought (b), and sold (s), applying inputs (q < 0) in production technology F, and paying transaction costs for goods traded on market at prices. The following equations summarise the household’s decision77:
Max U(c,z) … (1)
c,q,b,s
Subject to
Si [pici+ tibi] £ Si [pi(qi + ei) – tisi] … (2)
ci £ qi + bi – si + ei … (3)
F(q,z) ≥ 0 … (4)
Pi and ti given … (5)
Where c, q, b, and s are vectors defined over i goods – the set i covering all produced, consumed, and traded goods – z is a vector of household characteristics, e are endowments, and F represents the household’s production technology. The household thus maximises utility from consumption (1) subject to full-income (2), quantity balances on all inputs and outputs (3), and production technology (4), taking as given market prices and transaction costs.77
The Price Band
The Price band is connected to the sources of non-separability. The price band width of commodities like food and labour depends on transportation costs to and from the market, mark-ups by merchants, the opportunity cost of time involved in selling (search costs) and buying (recruitment and supervision costs), risk associated with uncertain prices and availabilities that determine perceived certainty equivalent prices that are lower than farm-gate prices for items sold and higher for items bought, and a variety of other transactions costs that are largely household specific.14,62 The poorer the infrastructure, the less competitive the marketing systems, the less information is available, and the more risky the transactions, the greater the size of this band. Figure 1 shows the market participation behavior of households.
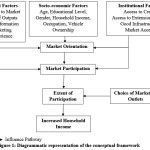 |
Figure 1: Market Participation behaviour of Households Click here to View Figure |
Source: https://ag-econ.ncsu.edu>05_household
Points to note from the Price band
(i) PBUY and PSELL are the boundaries of the household’s price band(depicted by the thick lines)
(ii) P* is market-determined prices
(iii) If the households marginal cost (supply) curve crosses its demand curve within the price band, then the household does not participate in the market (autarkic)
(iv) If the households marginal cost (supply) curve crosses its demand curve above the price band, then the household is a net purchaser (net buyer)
(v) If the households marginal cost (supply) curve crosses its demand curve below the price band, then the household is a net seller
(vi) Net Buyer Household is more likely to stay above the price band as supply fluctuates, the more elastic its demand
(vii) Net Seller Household is more likely to stay below the price band as demand fluctuates, the more elastic its supply.7
Conceptual Framework
The conceptual framework (Fig. 1) illustrates the interrelationships among the key variables. Socioeconomic characteristics are the background factors like (age, education level, gender, household income, occupation and vehicle ownership), institutional factors like (group marketing, access to extension service, market access, and road infrastructure) and market factors like (prices of output, price information, marketing experience, and distance to the market) have influence on market orientation and this leads to actual market participation (either input or output and may be both).62 Actual market participation leads to the extent of participation and choice of marketing outlets (like farm gate, local/village market, contract sales etc.).62 The extent of participation in turn leads to increased household income.
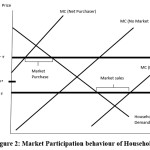 |
Figure 2: Diagrammatic representation of the conceptual framework Click here to View Figure |
Source: Adapted from.10, 27
Methodological Framework
Some methodologies used in Smallholder Market Participation Analysis
Empirical studies have to contend with the issue of possible selection bias in estimating the determinants of farm households’ market participation. The problem may generate when smallholder farmers have to make two important decisions. Generally, the first is a discrete choice of whether or not to participate in a given output market as seller or buyer; and secondly to decide on the quantity of the produce to be offered for sale conditional on the first decision. This section considers some commonly used methodological approaches in smallholder market participation in developing countries. These are given below;
Heckman’s Model
Heckman’s model is a two-stage econometric model where Probit model is employed in the first stage while Ordinary Least Square model is used in the second stage. Heckman’s model employs a Probit analysis to estimate the probability of smallholder farmers’ market participation. The Inverse Mills Ratio computed from the Probit regression is used with other explanatory variables to explain variation in the continuous, non-zero outcome variable (example sales volumes). Heckman model corrects for the fact that the non-selling group is not a random sub-sample of the population. The basic assumption of the Heckman model is that a certain value of the dependent variable is observed provided that it is higher than a certain threshold.6,35 Variables affecting the ‘quantity decision’ may affect the discrete participation decision while some factors (such as costs of market participation due to transport costs, display fees, license fee) that affect the discrete participation decision will in theory not affect the continuous outcome variable. The Heckman model consists of a linear equation for quantity sold:
yi* = bo + X1ib1 + e1i … (1)
6The first step of the model is the standard Probit model and it describes the probability of market participation hi;
hi* = X2ib2 + e2i … (2)
hi = 1 if hi* > 0
0 if hi* ≤ 0 … (3)
Where hi is the household’s participation in the output market. The sign and the magnitude of the coefficients for the same variable may be very different across the two scenarios as depicted in equations 1 and 2. The conditional expected quantity sold given that the household is participating in the output market is6:
![]()
Where s12 is the covariance between the two error terms, the term ![]() is the inverse mill’s ratio called the Heckman’s lambda. The second step of the model as developed by Heckman (1979) is the OLS estimation corrected by the inclusion of Heckman’s lambda among the regressors and is indicated as follows6, 35:
is the inverse mill’s ratio called the Heckman’s lambda. The second step of the model as developed by Heckman (1979) is the OLS estimation corrected by the inclusion of Heckman’s lambda among the regressors and is indicated as follows6, 35:
![]()
Advantages of Heckman’s model
The following are the advantages of Heckman’s model: (i) helps in dealing with problem of selection bias (ii) It employs the use of Probit model in the first stage to estimate the probability of market participation and the inverse Mills ratio computed from the probit regression is used with other explanatory variables to explain variation in continuous, non-zero outcome variable (e.g. sales volumes) and OLS in the second stage of the analysis, (iii) It corrects for the fact that the non-selling group is not a random sub-sample of the population.6, 36, 37, 83
Limitations of Heckman’s model
Limitations of Heckman’s model employed in market participation analysis include; (i) when there is a high degree of multicollinearity between the independent variables and the inverse Mills ratio which results in high standard errors on the coefficient estimates and parameter instability (ii) When OLS is used in the second stage of the Heckman model, the sample selection process may introduce bias. An insignificant lambda may not indicate an absence of sample selection bias.36 If a sample is small and/ or exclusion restrictions are weak, Heckman models are likely to produce significant lambdas- even in the presence of selection bias,36 (iii) it is inappropriate for exclusively non-negative data.
Gragg’s Double-Hurdle model (DHM)
The double-hurdle model was originally proposed by.38 The model does not require the assumption that the participation and the intensity of participation be determined by the same process as it is the case in Tobit model.39 The model therefore provides an important framework to investigate separately the effects of some variables on participation and the quantity of produce sold. It employs the Probit model in the first stage of the analysis and then the Tobit model in the second stage. Some previous studies that have employed this model as cited in40 include;20, 83 used a Bayesian estimation of double hurdle model to in investigate smallholder farmers’ participation in milk market in Ethiopia, applied the DHM to fertiliser use in Ethiopia41 also the crowding out effect of fertiliser subsidies in Malawi has been analysed with this model.42
It is worthy to note that Gragg’s Double Hurdle Model and Heckman Model are similar in that both are two-stage econometric regression models. Heckman employs the Probit and Ordinary Least Square (OLS) models in the first and second stages, respectively while Gragg’s Double-Hurdle model employs the Probit, and then Tobit models in the first and second stages respectively.37 The Probit model employed in Heckman’s model is not different from the one used in Double Hurdle Model.
Tobit Model
Tobin (1956)43 devised what became known as the Tobit model or censored normal regression model for situations in which y is observed for values greater than 0 but is not observed (i.e. It’s censored) for values of zero or less. The standard Tobit model is defined as6:
yi* = bo + Xib + ei
Where ei ~ N(0,s2), yi* is a latent variable that is observed for values greater than 0 and censored otherwise. The observed y is defined by the following measurement equations6:
yi = 0 if yi* = bo + Xib + ei ≤ 0 … (6)
yi = Xib + ei + ei if yi* = bo + Xib + ei > 0 … (7)
This can however be written as shown below if the data is censored at zero.6
yi = y* if y* > 0 … (8)
0 if y* ≤ 0 … (9)
Theyi represents the volume of sales while theXi represents the explanatory variables.
Marginal Effect for Tobit Model:
![]()
This indicates how a one unit change in an independent variable Xi affects observations.
Advantages of Tobit model
Tobit model uses Maximum Likelihood regression (MLE) Estimation as well as the marginal effects and also answers questions relating to factors influencing the probability of selling certain produce in the output market and how to determine the levels or magnitude of sales.
Limitations of Tobit model
Some of the limitations of the model include; (i) even though the dependent variable (value of sales) can, in principle take on negative values, they are not observed because of censoring, (ii) Part of the information in the sample is lost because negative values of sales are ignored, (iii) the observed zero values may not necessarily be due to censoring, but rather to the underlying sales decision- making process of individuals, (iv) In the model specification, the decision to sell and quantity to sell, depend on one and the same set of coefficient estimates while it has been shown that these decisions may be separate decisions that depend on different sets of variables or on the same variables but with different parameter estimates. However, in theory, the estimation procedure could be improved by modelling the decisions that produce the zero observation, rather than by using the Tobit mechanically.44
Measuring the Levels of Farm Households’ Agricultural Commercialisation
One of the most commonly used method of measuring levels smallholder farmers commercialisation in literature is the proportion of value of crop sold with respect to the value of crop harvested.45,46,47,48,49,50,51,52 This index referred to as Household Crop Commercialisation Index (CCI) measures the intensity of farm households’ participation in output markets. It can be expressed as follow:
![]()
Where hhi is the ith household in year j
Advantages of CCI
With this measure, the process of agricultural commercialisation can be represented by a continuum ranging from pure subsistence (CCIi = 0) to a completely commercialized production
system (CCIi = 100).51 Its main advantage is that it permits more than the traditional dichotomies of sellers versus non-sellers, or between staple and cash crop producers. It also permits discussion on how much of their harvest households choose to sell – while still being relatively easy to compute.51,52
Limitations of CCI
However, this index has its limitations in that it makes no justifiable distinction between a farmer who produces just one bag of sorghum and sells that one bag in the market, and one who grows 5 bags of sorghum and sells 3 of them. On the basis of this index the first farmer, with a CCI of 100, would appear to be more commercialised than the second, who has a CCI of 60. In practice, smallholder households who grow more will often also sell more, bearing in mind variation according to household size and dependency ratios.53, 54 Moreover, it is worthy of note that there is still possibility of using it in practice especially in the context of developing countries where it is less likely to see a situation where smallholder farmers sell all their output in the market and very large farms selling none of their farm output.53
Review of some Empirical Studies on Market Participation among Smallholder Farmers
Several studies have been carried out on Smallholder farmers’ market participation in Sub-Saharan Africa (SSA) and other parts of the world. Few of these studies are empirically reviewed while studies in SSA are given in the table 1 below. For instance, a study in Ethiopia on determination of poultry market participation decision employed Probit model and found out that out of thirteen explanatory variables considered in the model, decision to participation in poultry market was influenced by six variables, which include; household size, distance to nearest market, number of poultry owned, type of breed owned and educational level of household head55. They found out that only distance to nearest market negatively in their study on market participation and value chain of cassava farmers in Abia state, Nigeria employed multinomial logit model, which showed that marital status, years spent in school, distance to market and transaction cost significantly affected participation in cassava market while age, marital status, household size, year of education, distance to market, market information, farm size, transaction cost and quantity of cassava produced significantly affected participation in gari market.56
Similarly, a study in Bangladesh on market participation decision of smallholder farmers and its determinants employed probit regression and revealed that explanatory variables such as farm size, household labour and farm income positively and significantly influenced the farmers’ decision to participate in the market with crop sales.24 They also found out that the market participation for the household head was computed to be 0.57, which indicated that typical household sold 57% of his total crop production ranging from selling 0 to 95%.
According to a study in Ghana on market participation of smallholder maize farmers in the upper west region of Ghana affirmed that farmers’ characteristics, private asset characteristics and transaction cost variables are the major determinants of the probability and intensity of market participation of smallholder farm households.57 In the study on market participation and rural poverty among farmers in Northern part of Taraba State, Nigeria discovered that high transportation cost, poor infrastructure, high dependency ratio, distance, cooperative membership, and output size (output commercialization ratio) were important variables affecting effective market participation.58 Similarly, a study in South Africa and Nigeria on strategies to unlock market access to smallholders revealed that factors, such as poor infrastructure, lack of market transport, lack of market information, insufficient expertise on use of grades and standards, inability to conclude on contractual agreements, and poor organizational support, have led to inefficient use of different markets.59,92 However, some literatures report conflicting findings on the relationship between infrastructure and market participation decisions, while some studies report infrastructure as an influential factor in market participation.7, 17, 60, 61, 62, 92 However, in some other studies, correlation between infrastructure and market participation was found to differ among sellers and buyers.17, 60
In the study on the determinants of market participation in the food market in Ogun state, factors such as marital status, family size, years of experience, and farm size were found to be the major factors explaining participation in the food market.63 Specifically, a year increase in the age of the farmers as well as a higher level of education led to a decrease in market participation.
However, in another study on cassava market participation decisions of producing households in Africa, it was found that as the farmers get older, the higher the probability of their participation in the market.64 Several approaches were used by investigators to examine the level of market participation among farmers. For instance, a Logistic Regression Model was employed to examine the determinants of the level of fish farmers’ participation in the market.65 The implicit form of the model was used to find the rate of change in a level of participation in fish marketing while chi-square values were used to indicate the variations in the probabilities of participating in fish marketing.
On the other hand, in the study on the determinants of cereal market participation in sub-Saharan Africa, used an ordinary least square (OLS) regression model to identify the factors influencing farmers’ level of participation in the cereal output market.66 In addition, market participation has been conceptualized based on different assumptions. For example, market participation was viewed as both a cause and a consequence of economic development.7 According to them, markets offer households the opportunity to specialize according to comparative advantage and thereby enjoy welfare gains from trade. It was opined that as the market share of agricultural output increases, input utilization decisions and output combinations are progressively guided by profit maximization objectives.67
Methodological Approaches in Analysing Smallholder Farmers’ Market Participation in Sub-Saharan Africa
Several methodologies have been employed in studies relating to smallholder market participation in both input and output markets involving both cash and food crops and also livestock production. According to this review, several previous empirical papers (mainly original research articles) were consulted for the purpose of investigating the methods used in analysing the data in these studies. Table 1 below gives a brief description of the methodological approaches employed by the authors that have carried out studies relating to market participation of smallholder farmers in SSA alone. We consider previous studies in SSA mainly because majority of market participation studies till date are carried out in the developing countries owing to the fact that agricultural practices in this region are still on the subsistence or semi-subsistence level.
Table 1: Methodological Approaches in Analysing Smallholder Farmers’ Market Participation in Sub-Saharan Africa (2010-2019)
| Reference | Location | Crops/Livestock | Methodological Approach |
| 25Ouma et al. 2010 | RwandaBurundi | Banana | Supply and demand function; Probit regression |
| 9Jagwe et al. 2010 | Burundi, Rwanda, Democratic Republic of Congo | Banana | Heckman’s two-stage regression Model |
| 68Fischer and Qaim 2011 | Kenya | Banana | Gragg’s Double Hurdle Model |
| 69Siziba et al. 2011 | Niger, Uganda, Nigeria, Democratic Republic of Congo (DRC), Rwanda, Mozambique and Zimbabwe | Cereals | Heckman switching regression |
| 58Gani and Adeoti 2011 | Nigeria | Food crops | Gragg’s Double Hurdle Model; Total Market Participation Index (TMPI) |
| 70Zamasiya et al. 2012 | Zimbabwe | Soybean | Heckman’s two-stage regression Model |
| 71Reyes et al. 2012 | Angola | Potato | Gragg’s Double Hurdle Model |
| 72Zanello 2012 | Ghana | Grains | Triple Hurdle Model |
| 73Ohen et al. 2013 | Nigeria | Rice | Probit regression |
| 74Mather et al. 2013 | Maize | Gragg’s Double Hurdle Model | |
| 75Bwalya et al. 2013 | Zambia | Maize | Heckman’s two-stage regression model |
| 6Adeoti et al. 2014 | Nigeria | Maize | Gragg’s Double Hurdle Model |
| 76Tadesse and Bahiigwa2014 | Ethiopia | Teff, Wheat, Maize, Barley, Pulses, Vegetables and eggs | Probit regression; Ordered Probit regression; OLS regression |
| 57Musah 2014 | Ghana | Maize | Household Commercialisation Index (HCI); Gragg’s Double Hurdle Model |
| 77Mmbando et al. 2015 | Tanzania | Pigeon pea | Propensity Score Matching (PSM); Endogenous switching regression |
| 39Burke et al. 2015 | Kenya | Dairy | Triple Hurdle Model |
| 32Ismail et al. 2015 | Tanzania | Maize | Binary Logistic regression |
| 78Okoye et al. 2016 | Madagascar | Cassava | Triple Hurdle Model |
| 79Willy and Gemechu 2016 | Ethiopia | Dairy | Gragg’s Double Hurdle Model |
| 80Ahmed et al. 2016 | Ethiopia | Potato | Probit regression |
| 81Camara 2017 | Guinea | Cereals | Endogenous switching regression |
| 82Nakazi et al. 2017 | Uganda | Beans | Pairwise t-test; Tobit regression |
| 83Honja et al. 2017 | Nigeria | Cassava | Multinomial Logit regression; Principal Component Analysis (PCA) |
| 84Mbitsemunda and Karangwa 2017 | Rwanda | Beans | Gragg’s Double Hurdle Model |
| 85Adeoye and Adegbite 2018 | Nigeria | Plantain | Probit regression; Household Commercialisation Index (HCI) |
| 86Akidi et al. 2018 | Uganda | Chicken | Heckman’s two-stage regression model |
| 87Maponya et al. 2018 | South Africa | Horticultural crops | Binomial Logistic regression |
| 88Yemeogo et al. 2018 | Burkina Faso | Rice | Probit regression |
| 89Balirwa and Waholi 2019 | Uganda | Dairy | Heckman’s two-stage regression model |
| 90Dlamini-Mazibuko et al. 2019 | Swaziland | Vegetables | Probit regression |
| 91Kondo 2019 | Ghana | Cowpea | Instrumental Variable (IV) approach using Two-Stage Least Square (2SLS) |
Source: Authors’ Compilation, 2019
Conclusion and Recommendations
Transformation of subsistence agriculture to commercial status is an indispensable pathway towards economic growth and development for many developing countries. This review provides an overview of previous and recent studies on smallholder farmers’ market participation mainly in Sub-Saharan Africa and other part of the continents. It x-rayed the concepts, theoretical approaches and empirical studies on smallholder farmers’ market participation. It was opined that market participation of smallholders contribute toward agricultural growth and development, thereby bringing about the much-anticipated structural transformation in the agricultural sector and a shift towards the mitigation of poverty and staggering food insecurity of agricultural households in the Sub-Saharan Africa.
Through this review, it is evident that participation of smallholder farmers in markets in most sub-Saharan African countries remains low due to a range of constraints. These include; poor market access,26,97 farmers’ lack of sufficient means to overcome the costs of entering the market due to high transaction costs,8 poor infrastructure and weak institutions, which raise transaction costs that considerably alter production and market participation decisions. In addition, they lack reliable market information as well as information on potential exchange partners.25 The various methodological approaches employed so far on market participation of smallholder farmers include; Gragg’s Double Hurdle model, Triple Hurdle Model, Heckman’s two-stage regression model, Household Crop Commercialisation Index (CCI), Total Market Participation Index (TMPI) among others as presented in table 1 above. In another vein, the empirical review also provides the advantages and limitations of these methodological approaches as revealed in the literature. The study recommends that Policies or strategies enhancing smallholders farmers’ participation in agricultural commodities both in crop and livestock markets should focus on optimum production and marketing of both commodities so as to enhance smallholder farmers’ participation drive in the SSA region.
Also, government in the SSA region should intensify technology promotion drive which is capable of lifting the smallholder farmers from subsistence to commercial farming status and creating an enabling environment for effective participation for both public and private sectors for sustainable input delivery and supply.
Acknowledgement
This paper is part of the author’s (Olutosin A. Otekunrin) PhD Non- Thesis seminar presented on 22 November, 2017 in the Department of Agricultural Economics and Farm Management, Federal University of Agriculture, Abeokuta (FUNAAB), Nigeria.
References
- United Nations (UN). Report of the United Nations Conference on sustainable development- Rio de Janeiro, Brazil, 20_22 June, New York (A/CONF.216/16) 2012.
- Wickramasinghe, U. ‘Production Specialization and Market Participation of Smallholder Agricultural Households in Developing Countries’ 2015. Chapter 20. 349-367
CrossRef - Rapsomanikis, G. The economic lives of smallholder farmers: An analysis based on household data from nine countries. FAO, Rome 2015.
- World Bank. Reaching the rural poor: A renewed strategy for rural development. Washington, DC 2003: Retrieved from: http://documents.worldbank.org/curated/en/2003/08/7036682/ reaching-rural-poor-renewed-strategy-rural-development.
- International Fund for Agricultural Development (IFAD). Rural Poverty Report 2011: New Realities, New Challenges: New Opportunities for Tomorrow’s Generation. IFAD, Rome 2011.
- Adeoti, A.I, I. B Oluwatayo and Raheem O.S: Determinants of Market Participation among Maize Producers in Oyo State, Nigeria. Journal Economics British Journal of Economics, Management & Trade 2014, 4(7): 1115-1127
CrossRef - Boughton, D., Mather D., Barrett, C. B., Benfica, R., Abdula, D., Tschirley and Cunguara, B. Market participation by rural households in a low-income country: An Asset-Based Approach Applied to Mozambique. Faith and Economics 2007. 50 (Fall):64-101.
- Barrett, C.B. Smallholder market participation: Concepts and Evidence from Eastern and Southern Africa. Food Policy 2008. 33(4), 299–317
CrossRef - Jagwe, J., Machethe, C. and Ouma, E. Transaction costs and smallholder farmers’ participation in banana markets in the Great Lakes Region of Burundi, Rwanda and the Democratic Republic of Congo. AfJARE 2010. 6(1):302–317.
- Gebremedhin, B. and Jaleta, M. Commercialization of Smallholders: Does market orientation Translate into Market Participation? Working Paper No. 22, 2010.
- Moti, J., Berhanu G., and Hoekstra, D. Smallholder commercialization: Processes, determinants and impact. Discussion Paper No. 18. Improving Productivity and Market Success (IPMS) of Ethiopian Farmers Project, ILRI (International Livestock Research Institute), Nairobi, Kenya 2009.
- Felton, A.P. Making the Marketing Concept work. Harvard Business Review 1959, 37, 55-65.
- Harriss, B. There is method in my madness: or it is vice-versa? Measuring agricultural market performance. Food Research Institute Studies 1979. 16, 97-218.
- de Janvry, A., Fafchamps, M. and Sadoulet, E. Peasant household Behavior with Missing Markets: Some paradoxes explained. The Economic Journal 1991. 110(409):1400–1417. Doi: 10.2307/2234892
CrossRef - Sadoulet, E. and De Janvry, A. Quantitative development policy analysis. Baltimore: The Johns Hopkins University Press 1995.
- Alene, A. D., Manyong, V. M., Omanya, G., Migrouna, H.D., Bokanga, M and Odhieambo, G. Smallholder market participation under transaction costs: Maize supply and fertilizer demand in Kenya. Food Policy 2008. 33(4), 318-328. Doi: 10.1016/j.foodpol.2007.12.001
CrossRef - Key, N., Sadoulet, E., and De Janvry, A. Transactions costs and agricultural household supply response. American Journal of Agricultural Economics 2000, 82(2), 245–259. Doi: 10.1111/0002-9092.00022
CrossRef - Fafchamps, M. Market institutions in sub-Saharan Africa: Theory and evidence. Cambridge: MIT Press 2004.
CrossRef - Holloway, G. and Barrett, C. B. Bayesian Estimation of the Double Hurdle Model in the Presence of Fixed Costs. Journal of International Agricultural Trade and Development 2005, 1(1), 17–28
CrossRef - Holloway, G. J., and Ehui, S. Expanding market participation among smallholder livestock producers: A collection of studies employing Gibbs sampling and data from the Ethiopian highlands, 1998-2001 (2002). Vol. 48. ILRI (ILCA and ILRAD).
- Sebatta, C., Mugisha, J., Katungi, E., Kashaara, A and Kyomugisha, H. Smallholder Farmers’ Decision and Level of Participation in the Potato Market in Uganda. Modern Economy 2014, 5 (8): 895–906. Doi: 10.4236/me.2014.58082
CrossRef - Hays, H. M. The marketing and storage of vegetables in Northern Nigeria, Satnaru Miscellaneous Pepper No. 50, Institute for Agricultural Research, Zaria 1975. 17-19.
- Olukosi, J. O., Isitor, S. U. and Ode, M. O. Introduction to Agricultural Marketing and Prices, Principle and applications. Living Books Series, GU Publications, Abuja, FCT 2007. 37-44.
- Osmani, A.G and Hossain, E Market Participation Decision of Smallholder Farmers and Its Determinants in Bangladesh. Economics of Agriculture2015. 62(1), 163- 179
CrossRef - Ouma, E., Jagwe, J., Obare, G. and Abele, S. Determinants of Smallholder Farmers’ Participation in banana markets in Central Africa: The role of transaction costs. Agricultural Economics 2010. 41(1), 111–122.
CrossRef - Makhura, M., Kirsten, J and Delgado C. Transaction costs and small holder participation in the maize market in the Northern Province of South Africa. Seventh Eastern and Southern Africa Regional Maize Conference, 11–15 February, Pretoria, South Africa 2001.
- Sigei, G K. Determinants of Market Participation among Small-Scale Pineapple Farmers in Kericho County, Kenya. MSc Thesis, Department of Agricultural and Applied Economics, Egerton University, Kenya 2014.
CrossRef - Coase, R.H. The nature of the firm. Economica 1937.Vol. 4: 386–405.
CrossRef - Coase, R. H. The problem of social cost. Journal of Law and Economics 1960. Vol. 3: 1– 44.
CrossRef - Williamson, O. The Economic Institutions of Capitalism: Firms, Markets, Relational Contracting. The Free Press, New York 1985.
- Kirsten, J & Vink, N. The economics of institutions: Theory and applications to African agriculture. Course study material, Department of Agricultural Economics Extension and Rural Development, University of Pretoria 2005.
- Ismail, I. J., Srinivas, M and Tundui, H. Transaction Costs and Market Participation Decisions of Maize Smallholder Farmers in Dodoma Region, Tanzania. Global Journal of Biology, Agriculture and Health Sciences 2015. 4(2), 12-20.
- Lofgren, H., and S. Robinson. Nonseparable Farm Household Decisions in a Computable General Equilibrium Model. American Journal of Agricultural Economics 1999, 81, 663-670
CrossRef - Omamo, S.W. Transport costs and smallholder cropping choices: An application to Siaya District, Kenya. American Journal of Agricultural Economics 1998. 80(1), 116–23.
CrossRef - Heckman J.J. Sample selection bias as a specification error. Econometrica 1979. 47(1), 153-161. Available at: http://doi.org/http://www.jstor.org/stable/1912352
CrossRef - Certo, S. T. Busenbark, J. R, Woo Hyun-Soo, and Semadeni, M. Sample Selection Bias and Heckman Models in Strategic Management Research. Strategic Management Journal 2016. 1- 19.
CrossRef - Otekunrin, O. A. Smallholder Farmers’ Market Participation: A Conceptual, Theoretical and Methodological Review. Unpublished PhD Non-Thesis Seminar presented in the Department of Agricultural Economics and Farm Management, Federal University of Agriculture, Abeokuta 2017.
- Gragg J.G. Some Statistical models for limited dependent variables with application to the demand for durable goods. Economerica 1971. 39 (5), 829-844 Doi: 10.2307/1909582
CrossRef - Burke, W. J., Myers, R. J., & Jayne, T. S. A Triple-Hurdle Model of Production and Market Participation in Kenya’s Dairy Market. American Journal of Agricultural Economics, 97(4), 1227–1246. 2015. Doi: 10.1093/ajae/aav009
CrossRef - Ouedraogo, S. A.Agricultural Commercialisation and Food Crop Productivity as Pathways to Poverty Reduction among Smallholder Farmers in Rural Burkina Faso. Unpublished PhD thesis, Department of Agricultural Economics and Agribusiness, University of Ghana. 2018.
- Croppenstedt, A., Demeke, M., & Meschi, M. M. (2003). Technology Adoption in the Presence of Constraints: the Case of Fertilizer Demand in Ethiopia. Review of Development Economics, 7(1), 58–70. http://doi.org/10.1111/1467-9361.00175
CrossRef - Ricker-Gilbert, J., T. Jayne, and E. Chirwa. Subsidies and Crowding Out: A Double-Hurdle Model of Fertilizer Demand in Malawi. American Journal of Agricultural Economics 2011. 93(1): 26-42.
CrossRef - Tobin, J. Estimation of relationships for limited dependent variables. Econometrica 1956. 26:24-36.
CrossRef - Maddala G.S Limited and Quantitative Markets in Zimbabwe: Organization, spatial integration and equilibrium, Unpublished PhD and Dissertation, Cornell University 1983.
- von Braun, J. Agricultural commercialization: impacts on income and nutrition and implications for policy. Food Policy 1995. 20(3), 187–202. Doi: 10.1016/0306-9192(95)00013-5
CrossRef - Govereh, J., Jayne, T. S., & Nyoro, J. Smallholder Commercialization, Interlinked Markets and Food Crop Productivity: Cross-Country Evidence in Eastern and Southern Africa. Working paper/The Department of Agricultural Economics and The Department of Economics, Michigan State University (MSU) 1999.
- Strasberg, P., Jayne, T., Yamano, T., Nyoro, J.K., Karanja, D.D and Strauss, J. Effects of Agricultural Commercialization on Food Crop Input Use and Productivity in Kenya, Policy Synthesis for USAID – Africa Bureau Office of Sustainable Development 41, East Lansing MI: Michigan State University 1999.
- Govereh, J., & Jayne, T. S. (2003). Cash cropping and food crop productivity: synergies or trade-offs? Agricultural Economics, 28, 39–50.
CrossRef - Rios, A. R., Shively, G. E. and Masters, W. A. Farm Productivity and Household Market Participation: Evidence from LSMS Data. Contributed Paper Prepared for Presentation at the International Association of Agricultural Economists, Beijing, China 2009.
- Ochieng, J., Knerr, B., Owuor, G., & Ouma, E. Commercialisation of Food Crops and Farm Productivity: Evidence from Smallholders in Central Africa. Agrekon 2016. 55(4), 458–482. Doi: 10.1080/03031853.2016.1243062
CrossRef - Carletto, C., Corral, P and Guelfi, A. Agricultural commercialization and nutrition revisited: Empirical evidence from three African countries. Food Policy 2017. 67, 106–118. Doi: 10.1016/j.foodpol.2016.09.020
CrossRef - Adepoju, A. A Investigating Endogeneity Effect of Agricultural Commercialization on Household Poverty Status in Oyo State Nigeria: A Cdsimeq Approach. International Journal of Agriculture Innovations and Research 2018. 7(1) 93-101
CrossRef
- Hagos, A and Geta E. Review on smallholder agriculture commercialization in Ethiopia: What are the driving factors to focused on? Journal of Development and Agricultural Economics 2016, 8(4)
CrossRef - Poulton, C. What is Agricultural Commercialisation, Why is it Important, and How Do We Measure it? Agricultural Policy Research in Africa (APRA) Working Paper 06: 2017.
- Tarekegn, K. and Yosefe, K. Determinants of Poultry Market Participation Decisions: The Case of Producers in Kaffa and Bench Majji Zones, Southern Ethiopia. Journal of Economics and Sustainable Development 2017. 8(3): 23-29
- Onoja, A.O., Usoroh, B.B. Adieme, D.T and Deedam, N.J. Determinants of market participation in Nigerian small-scale fishery sector: Evidence from Niger Delta region. Consilience: Journal of Sustainable Development 2012. 9(1), 69–84.
- Musah, A.B., Bonsu, O and Seini, W Market Participationof Maize farmers in the upper West region of Ghana. African Journal of Agricultural Research 2014. Vol.9 (31), 2427- 2435
CrossRef - Gani, B.S and Adeoti, A.I. Analysis of Market Participation and Rural Poverty among Farmers in Northern Part of Taraba State, Nigeria. Journal of Economics 2011, 2(1), 23–36.
CrossRef - Schalkwyk van, H.D., J.A. Groenewald, G.C.G. Fraser, O. Ajuruchukwu, and A.V. Tilburg Unlocking markets to smallholders: Lessons from South Africa 2012. Mansholt Publication 2012. 10:35–48.
- Goetz S.J. A selectivity model of household food marketing behavior in Sub-Saharan Africa. American Journal of Agricultural Economics 1992. 74 (2), 444-452.
CrossRef - Heltberg, R., and F. Tarp. Agricultural supply response and poverty in Mozambique discussion paper, World Institute for Development Economics Research (WIDER), United Nations University. Food Policy 2002, 27(2):103–124. Doi: 10.1016/S0306-9192(02)00006-4
CrossRef - Renkkow, M., Hallstrom, D.G., and Karanja, D.D. Rural infrastructure, transaction costs and market participation in Kenya. Journal of Development Economics 2004. 73(1) 349–367. Doi: 10.1016/j.jdeveco.2003.02.003
CrossRef - Egbetokun, O.A., and B.T. Omonona. Determinants of farmers’ participation in food market in Ogun State. Global Journal of Science Frontier Research Agriculture and Veterinary Science. 2012. 12(9):26–30.
- Enete A. A. and Igbokwe, E.M. Cassava Market Participation Decisions of Producing Households in Africa. Tropicultura 2009, 27(3), 129-136
- Onoja, A.O., Usoroh, B.B. Adieme, D.T and Deedam, N.J. Determinants of market participation in Nigerian small-scale fishery sector: Evidence from Niger Delta region. Consilience: Journal of Sustainable Development 2012. 9(1), 69–84.
- Shephard, S., N. Kefasi, A. Diagne, A.O. Fatunbi, and A.A. Adekunle (2011) Determinants of cereal market participation by sub-Saharan Africa smallholder farmer learning publics. J. Agric. Environ. Stud. 2(1), 180–193.
- Omiti, J. M., Otieno, D. J., Nyanamba, T. O., McCullough, E. Factors Influencing the Intensity of Market Participation by Smallholder Farmers: A Case Study of Rural and Peri-Urban Areas of Kenya. African Journal of Agricultural and Rural Economics 2009. 3, 57-82
- Fischer, E and Qaim, M. Linking Smallholders to Markets: Determinants and Impacts of Farmer Collective Action in Kenya. World Development 2012, 40(6) 1255-1268, Doi:10.1016/j.worlddev.2011.11.018
CrossRef - Siziba, S., Nyikahadzoi, K., Diagne, A., Fatunbi A. O., Adekunle, A. A. Determinants of Cereal Market Participation by Sub-Saharan Africa Smallholder Farmers. Journal of Agriculture and Environmental Studies 2011. 2(1), 180-193
- Zamasiya, B., Mango, N., Nyikahadzoi and Siziba, S. Determinants of Soybean Market Participation by Smallholder Farmers in Zimbabwe. Journal of Development and Agricultural Economics 2014. 6(2) 49-58. Doi: 10.5897/JDAE2013.0446
CrossRef - Reyes, B., Donovan, C., Bernsten, R and Maredia, M.K. Market Participation and Sales of Potatoes by Smallholder Farmers in the Central Highlands of Angola: A double Hurdle Approach. 2012 Conference, 18-24 August, 2012, Foz do Iguaçu, Brazil, 126655, International Association of Agricultural Economists.
- Zanello, G. Mobile Phones and Radios: Effects on Transactions Costs and Market Participation for Households in Northern Ghana. Journal of Agricultural Economics 2012, 63(3), 694-714. Doi: 10.1111/j.1477-9552.2012.00352.x
CrossRef - Ohen, S. B., Etuk, E. A., Onoja, J. A. Analysis of Market Participation by Rice Farmers in Southern Nigeria. Journal of Economics and Sustainable Development 2013. 4(7). pp. 6-11.
- Mather, D., Boughton, D and Jayne, T. S. Explaining smallholder maize marketing in southern and eastern Africa: The roles of market access, technology and household resource endowments. Food Policy 2013. 43, 248–266. Doi: 10.1016/j.foodpol.2013.09.008
CrossRef - Bwalya, R., Mugisha, J and Hyuha, T. Transaction costs and smallholder household access to maize markets in Zambia. Journal of Development and Agricultural Economics 2013; 8 (9): 238-336. Doi: 10.5897/JDAE12.134
CrossRef - Tadesse, G and Bahiigwa, G. Mobile Phones and Farmers’ Marketing Decisions in Ethiopia. World Development 2015; 68: 296-307. Doi: 1016/j.worlddev.2014.12.010
CrossRef - Mmbando, F.E., Wale, E.Z and Baiyegunhi L.J. S. Welfare impacts of Smallholder Farmers’ Participation in Maize and Pigeon pea Markets in Tanzania. Food Security. 2015 7:1211–1224. Doi: 10.1007/s12571-015-0519-9
CrossRef - Okoye, B.C., Abass, A and Bachwenkizi B., Asumugha, G., Alenkhe, B., Ranaivoson, R., Randrianarivelo, R., Rabemanantsoa, N and Ralimanana, I. Effect of Transaction Costs on Market Participation among Smallholder Cassava Farmers in Central Madagascar. Cogent Economics & Finance 2016; 4: 1-20. Doi: 10.1080/23322039.2016.1143597
CrossRef - Willy, B.T and Gemechu, A. Determinants of Market Participation and Financial Profitability of Smallholder Dairy Farming: The Case of Bako Tibe, West Showa, Ethiopia. Trends of Agricultural Economics 2016; 9(1-3): 29-44
CrossRef - Ahmed, Y. E., Girma, A.B and Aredo, M.K. Determinants of Smallholder Farmers Participation Decision in Potato Market in Kofele District, Oromia Region, Ethiopia. International Journal of Agricultural Economics 2016; 1(2): 40-44. Doi: 10.11648/j.ijae.20160102.14
- Camara, A. An Analysis of Welfare Effect of Market Participation of Smallholder Farm Households in Guinea. The Economic Research Guardian 2017, 7(1), 2-23
- Nakazi, F., Njuki, J., Ugen, M.A., Aseete, P., Katungi, E., Birachi, E., Kabanyoro, R., Mugagga, I.J and Nanyonjo, G. Is Bean really a Women’s Crop? Men and Women’s Participation in Bean Production in Uganda. Agriculture and Food Security 2017, 6:22. Doi: 10.1186/s40066.017.0102-z
CrossRef - Honja, T., Geta, E and Mitiku, A. Determinants of Intensity of Market Participation of Smallholder Mango Producers: The Case of Boloso Bombe Woreda, Wolaita Zone, Southern Ethiopia. Journal of Marketing and Consumer Research 2017, 32: 56-63
- Mbitsemunda, J and Karangwa, A. Analysis of Factors Influencing Market Participation of Smallholder Bean Farmers in Nyanza District of Southern Province, Rwanda. Journal of Agricultural Science 2017. 9(11). Doi: 10.5539/jas.v9n11p99
CrossRef - Adeoye, I. and Adegbite, O. Determinants of Smallholder Plantain Farmers Participation in Market. Journal of Innovative Agriculture 2018, 5(1), 5-12
- Akidi, I.L, Wamala, S.K. and Mugonola, B. Determinants of smallholder indigenous chicken Farmers’ Market Participation Decisions and Value of Sales in Gulu District. Journal of Development and Agricultural Economics 2018. 10(8), 271-278, Doi:10.5897/JDAE2018.0941
CrossRef - Maponya, P., Kekana, V., Senyolo, G.M and Venter, S.L. Socioeconomic Factors Influencing Market Participation of horticultural Smallholder Farmers in the Alfred Nzo District, Eastern Cape, South Africa. Journal of Agribusiness and Rural Development 2018, 4(50), 421-427. Doi: 10. 17306/J.JARD.2018.00421
CrossRef - Yameogo, T.B., Bossa, A.Y., Torou, B.M., B.M., Fasillier, J., Da, D.E.C., Yira, Y., Serpantie, G., Some, F and Dama-Balima, M.M. Socio-economic factors influencing Small-Scale Farmers’ Market Participation: Case of Rice Producers in Dano. Sustainability 2018, 10, 1-16. Doi: 10.3390/su10124354.
CrossRef - Balirwa, E. K and Waholi, E. Analysis of Market Participation Behavior among Smallholder Dairy Farmers in Uganda. Journal of Agricultural Science 2019. 11(3): 109-123 doi:10.5539/jas.v11n3p109
CrossRef - Dlamini-Mazibuko, B.P., Ferrer, S and Ortmann, G. Factors affecting the choice of marketing outlet selection strategies by smallholder farmers in Swaziland. African Journal of Science, Technology, Innovation and Development 2019, Doi: 10.1080/20421338.2018.1554323
CrossRef - Kondo, E. Market Participation Intensity Effect on Productivity of Smallholder Cowpea Farmers: Evidence from the Northern Region of Ghana. Review of Agricultural and Applied Economics 2019. 22(1): 14-23 Doi: 10.15414/raae.2019.22.01.14-23
CrossRef - Adepoju, A.O., Owoeye, I.T and Adeoye, I.B. Determinants of Market Participation among Pineapple Farmers in Aiyedaade Local Government Area, Osun State, Nigeria, International Journal of Fruit Science 2015, 15:4, 392-404. Doi: 10.1080/15538362.2015.1015763
CrossRef - Adenegan, K.O., Olorunsomo, S.O and Nwauwa, L.O.E. Determinants of Market Orientation among Smallholders Cassava Farmers in Nigeria. Global Journal of Management and Business Research Finance 2013, 13(6), 1-11
- Singh, I., Squire, L and Strauss, J. A survey of Household Models: Recent Findings and Policy Implications. The World Bank Economic Review 1986, 1(1), 149-179. Doi: 10.1093/wber/1.1.149
CrossRef