
Introduction
People of Uttar Dinajpur are primarily dependent on agriculture as the land is very much fertile.3 The Nager-Kulik interfluve is an important agriculture productive land of the Raiganj C.D Block as well as Utter Dinajpur district. Besides the kharif crops, rabi crops like winter rice, maize, wheat, mustered are cultivated in most of the villages. According to the census 2011 the interfluve having net sown area about 79% (24733.23 ha.) out of which 42 % area is getting the irrigation facility. A good number of main workers about 75.22% engage in agricultural practices as cultivator and agricultural laborer as 31% and 43%, respectively. Therefore, it indicates that the dependency on the net sown area is quite high in the interfluve. The interfluve experiences humid tropical climate with monsoon rainfall (temp. in June 35°C, and in December 7°C; 140 cm/year). Kharif crops are largely dependent on the vagaries of monsoon and rabi crops on irrigation water. There is a significant unequal distribution of irrigation facility is found at village level. In the Interfluve, the irrigation planning is required to reduce the disparity. Therefore, it is the first and important work to find out the villages which are lagging behind by irrigation facility and required irrigation water for the rabi crops mainly. Normally there is a deviation between Net Sown Area and Irrigated area that means any area having higher net sown area maybe deficit by the irrigation facility. To identify the villages for planning of net sown area and irrigation facility z score analysis has been taken into consideration.
Study Area
The area selected for the present study is the lower part of the Nagar-Kulik interfluve (comes under country of India) which extending from 25°32′9.84″N to 25°50′9.84″N latitudes and 88°1′27.1″E to 88°14′7.74″E longitudes cover an area of 315.671 sq. km. (Raiganj P.S -313.4636 sq. km and Itahar P.S-2.2074 sq. km) of the Uttar Dinajpur district in the state of West Bengal, India (Figure 1). The interfluve comprises 137 villages of the Uttar Dinajpur district. The interfluve is bounded by the rivers of Nagar in the West and Kulik in the east and south. The length of the river Nagar and Kulik is 165 km and 131 km respectively. The political boundary between India and Bangladesh serves the northern limit of the study area. The maximum north-south extent is about 31 km and the maximum east-west width is about 18 km. The confluence of the Nagar and Kulik rivers indicates the southern limit of the study area, which is situated at Gorahar mouza in Itahar P.S. of the study area.7
The regional topography is generally flat with a gentle slope in south-west direction. The elevation of the study area ranges from almost 43 m. to 29 m. from mean sea level. The study area is characterized by inactive and active flood plain, piedmont or fan, back swamp, marsh land, oxbow lakes, paleochannels etc. Numerous large water bodies that are remnants of back swamps or abandoned streams locally known as ‘Bills.’4
Geologically the region is filled up by the fan deposits and riverine sediments during the Holocene and Pleistocene periods. The study area comprises with alternating sand, silt and clay and also observed predominantly course to fine sand alternating with silty sand. The study area is the part of Shaugaon, Malda and Baikunthapur formation. Besides these along the river channel present day deposit is common.4
Soil of the study area is very fertile and rich with older alluvial disposition. The older alluvium is estimated to be Pleistocene age. Alternating sand, silt and clay are found in soil horizon. Confluence of Nagar and Kulik e.g. the southeast edge of the study area active alluvium deposition and active land building process are currently underway. Basically, black prairie soil, entisol and inceptisol types of soil are found in the study area.4
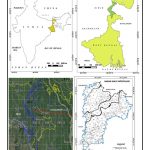 |
Figure 1: Location map of the study area |
Objectives
- To find out the changes in the net sown area
- To find out the problems of net sown area
- To find out the relation between net sown area and irrigated area
- To give planning proposals at village level
Sources of Information
Both primary and secondary types of data are used for this work. Data are collected from P.S. Maps, Toposheet (78 C/2, G45Q2, NG 45-11), Census Reports, District Statistical Hand Book and District Gazetteer, Landsat Satellite Image 2019. Soil related information is collected from various reports and books related from different offices.
Methodology
The main objective of this work is to find out the relation between cultivated area and irrigated area by applying Z-score for village level landuse planning.9 After selecting the objectives, the agricultural problems of the study area have been identified. Secondly, the data have been collected from Census Handbooks (1991 & 2011), Police Station Map, Topographical sheets and Landsat satellite image 2019 etc. to find out the land use change pattern and to prepare base map. Thirdly, the data has been computed and compiled and prepared thematic maps. Finally, data and present scenario have been analysed for village level planning.
Review of Literature
A good deal of works has been done on changes of cultivated area and irrigation area.2.5.6.8.9.10.11 Though, a considerable work has been done on landuse change and net sown area or cultivated area change but at village level no such work is done still on the relation between cultivated area and irrigated area. In the previous works numerous techniques are used to calculate the changes. Application of Z-score is an attempt to understand the relation between cultivated area and irrigated area to assess the agricultural landuse in the Nagar-Kulik interfluve.
Result Analysis
To explore the village-wise parity and disparity between the distributions of net sown area and irrigated area, standard deviation (S.D.) and Z-score have been calculated.8,9,12 Some important observations have come out which are as follows:
Irrigated area Mean: 76.50 hect.SD: 71.41
Net Shown area Mean: 181.86 hect. SD: 142.37

X: individual, X̅: mean, sd: Standard Deviation
The score value must be positive (+) or negative (-) and greater than 1 or less than one. Less than one value indicates that the area is deviated less than standard deviation and vice-versa.
Positive value indicates that the area has net sown area or irrigation more than “Mean”.
Changes in Net Sown Area
Present land utilization has been analysed on the basis of Census Report for 1991 and 2011 (Figures 2 , 3 and Table 1). Cultivated land constitutes 79.00 % (247.33 sq. km) of the Interfluve (2011) but only 42.06% (104.04 sq. km) of the rural cultivated area is getting the irrigation facility and 57.93 % (143.28 sq. km) is unirrigated till 2011. 86 villages of the study area are still devoid of irrigation facility. Although the Interfluve is showing good percentage of agricultural land and qualitatively it is fertile. A number of changes in the net sown area have been observed in the Interfluve from 1991 to 2011 (Table 2).
Cultivated land is unevenly distributed in the villages of the Interfluve. A lot of changes have been found in cultivated land (Table 2). In 2011, 52.21% of the village having a maximum concentration of cultivated land (70.1% to 80% village area) where it was 63.50% in 1991; 30.88% of village having maximum concentration of cultivated land (80.1% to 90% village area) where it was 18.98% in 1991 and 13.24% of the village having a maximum concentration of cultivated land (90.1% to 100% village area) where it was 11.68% in 1991. 1.46% and 0.74% of the villages in 1991 and 2011 respectively is showing a cultivated area below 60% of the village area. In the Interfluve cultivated land has increased from 77.77% to 79.00% since 1991 to 2011. Due to the addition of irrigation practice the agricultural intensity has increased. An area not available for agriculture has decreased in the Interfluve. Unirrigated land has been converted into irrigation land whereas irrigated land has increased there. Area under non-agricultural use land has decreased there.
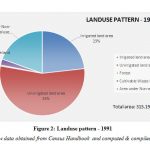 |
Figure 2: Landuse pattern – 1991 |
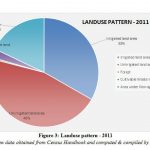 |
Figure 3: Landuse pattern – 2011 |
Table 1: Landuse changes from 1991 to 2011
|
Landuse categories |
Area (sq. km) |
% to total area |
||
|
1991 |
2011 |
1991 |
2011 |
|
|
Irrigated land area |
73.22 |
104.04 |
23.23 |
33.23 |
|
Unirrigated land area |
171.82 |
143.28 |
54.51 |
45.77 |
|
Forest |
1.26 |
1.42 |
0.39 |
0.45 |
|
Cultivable Waste land area |
7.24 |
8.18 |
2.29 |
2.61 |
|
Area under Non-agricultural use |
61.65 |
56.10 |
19.55 |
17.92 |
|
Total |
315.19 |
313.02 |
100 |
100 |
Source: Raw data obtained from Census Handbook and computed & compiled by the author
Table 2: Net Sown Area
|
Category (% of net sown area to village area |
1991 |
2011 |
||
|
No. of villages under the category |
% of villages to total number of villages |
No of villages under the category |
% of villages to total number of villages |
|
|
60 & below |
2 |
1.46 |
1 |
0.74 |
|
60.1-70 |
6 |
4.38 |
4 |
2.94 |
|
70.1-80 |
87 |
63.50 |
71 |
52.21 |
|
80.1-90 |
26 |
18.98 |
42 |
30.88 |
|
90.1-100 |
16 |
11.68 |
18 |
13.24 |
|
Total villages |
137 |
100 |
136 |
100 |
|
N.B. From 1991 to 2011, 1 village have been engulfed in urban area |
||||
Source: Raw data obtained from Census Handbook and computed & compiled by the author
Changes in Irrigation facility from 1991 to 2011
In 2011, 41.73% of the cultivated area gets irrigation water in the Interfluve. Out of the total irrigated area (10284.82 ha. land) canals serves 40% (4120.03 ha.), wells/tube wells serve 36 % (3693.33 ha. land), tanks serve 7% (720.65 ha.), waterfall serves 4% (385.87 ha.) and other sources serves 13% (1365.06 ha.) (Figure 4). Village wise variation of irrigated area also has been found in the Interfluve. Table 3 reveals that 1.46 % of the total village (2 village) were not getting irrigation facility in 1991 where in 2011 all villages getting the irrigation facility. 23.52 % (32 villages out of 136) of the village has more than 50% (2011) of area under irrigation facility to the total cultivated land (Table 3).
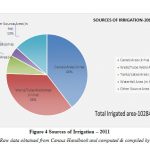 |
Figure 4: Sources of Irrigation – 2011 |
The irrigation map reveals that there is a notable positive change in irrigation facility. At present 41.73% cultivated land gets irrigation water, whereas it was only 29.88% in 1991. It has improved steadily, which is one of the most important elements of agriculture and future landuse planning. Some important observations are mentioned as follows:
- The whole Interfluve shows an increase of irrigation (Table 3).
- In 1991 there were only 2.91% of villages get more than 50% irrigation facility (4 mouzas) but at present 23.52% of villages (32 mouzas) has got irrigation water more than 50%.
- In 2011, 77.94% of the village is getting irrigation water for less than 50% of cultivated land whereas it was 97.08% in 1991. In 1991, 2.18% of the village was under irrigation water for 50 to 80% cultivated land but has increased to 11.76% in 2011. Only 1 (0.72%) villages get water for more than 80% cultivated land in 1991 whereas it is 16 villages (11.76%) in 2011.
- There are 6 villages in 2011 are getting 100% irrigation water for the total cultivated land.
Table 3: Changes in Irrigated Area
|
Category (% of irrigated area to cultivated area) |
1991 |
2011 |
||
|
No. of villages under the category |
% of villages to total number of villages |
No of villages under the category |
% of villages to total number of villages |
|
|
0 |
2 |
1.46 |
NIL |
|
|
10 & below |
NIL |
NIL |
||
|
10.1- 20 |
7 |
5.11 |
5 |
3.68 |
|
20.1- 30 |
62 |
45.26 |
33 |
24.26 |
|
30.1- 40 |
57 |
41.61 |
51 |
37.50 |
|
40.1- 50 |
5 |
3.65 |
15 |
11.03 |
|
50.1- 60 |
2 |
1.46 |
4 |
2.94 |
|
60.1- 70 |
NIL |
7 |
5.15 |
|
|
70.1- 80 |
1 |
0.73 |
5 |
3.68 |
|
80.1- 90 |
NIL |
6 |
4.41 |
|
|
Above 90 |
1 |
0.73 |
10 |
7.35 |
|
NA |
NIL |
1 |
0.74 |
|
|
Total village |
137 |
100 |
136 |
100 |
|
From 1991 to 2011, 1 village have been engulfed in urban area |
||||
Source: Raw data obtained from Census Handbook and computed & compiled by the author
Changes in Net Sown Area and Irrigated Area
Irrigate and Net Sown Area have been considered as ‘X’ and ‘Y’ respectively. Threshold value increases from 5.49 to 10.65 (1991 to 2011) indicating that if irrigation is ‘0’ then also cultivation possible. Increase of intercept value indicates that cultivation is not determined by irrigation. Slope value also increases from 0.268 to 0.362 (1991 to 2011). It indicates that per unit change in irrigation can change the NSA more in 2011 than 1991 (Figures 5 and 6).
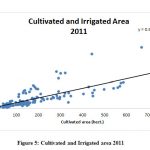 |
Figure 5: Cultivated and Irrigated area 2011 |
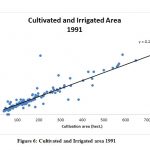 |
Figure 6: Cultivated and Irrigated area 1991 |
Table 4: Deviation of Net Sown Area & Irrigated Area – 2011
|
|
No. of Village |
% of Village |
||
|
+ |
– |
+ |
– |
|
|
Deviation of Net Sown Area |
47 |
89 |
34.55% |
65.65% |
|
Deviation of Irrigated area |
51 |
85 |
37.50% |
62.50% |
Relation between Net Sown Area and Irrigated Area
To explore the village-wise parity and disparity between the distributions of net sown area and irrigated area, standard deviation (S.D.) and Z-score have been calculated. Some important observations have come out which are as follows:
- S.D. is relatively higher for the net sown area (SD-142.38 ha.) than the irrigated area (SD-71.42 ha.) which means greater variation exists in the available net sown area among the villages than irrigated area. There is huge gap between the mean (M) of net sown area (181.86 ha.) and irrigated area (76.50 ha.) on an average 105.36 ha. Planning is required to reduce the gap. When the whole net area will get irrigation facility then it will become zero.
- Positive score indicates that the villages have net area or irrigated area more than mean distribution. Therefore, positive value has been treated here as a good symbol for the village than negative value. Because negative value indicates that the respective villages have lower net area or irrigated area than the mean.
- The score with a lower positive value (less than +0.50) indicates more stable condition than the score with lower negative value (less than -0.50).
- When the score is positive and more than 1, it reveals that the villages are in better condition than the other villages of the Interfluve.
- Negative scores more away from zero are representing more poor condition at regional aspect for both net area and irrigated area.
- Villages of the 1st quadrant like Basatpur (Sl. no. 1) , Gopalpur (Sl. no. 22), Maladkhanda (Sl. no. 5), Bhatol (Sl. no. 6), Bhatganja (Sl. no. 7), Malibari (Sl. no. 8), Maslandapur (Sl. no. 9), Halalpur (Sl. no. 18), Runia (Sl. no. 19), Jagadishpur (Sl. no. 21), Tazpur (Sl. no. 24), etc of the interfluve is the most agriculturally advanced because their irrigation positively deviates up to 5 times than the SD and NSA positively deviates up to 5 (Figures 7 and 8).
- Villages of the 2nd quadrant represent positive change in NSA but negative in irrigation. Such villages like Mallickpur (Sl. no. 2), Dhalgaon (Sl. no. 3), Kharibadkol (Sl. no. 26), Soharai (Sl. no. 112), Bahin (Sl. no. 119), Bhitihar (Sl. no. 132), Amritakhnda (Sl. no. 133), Birahimkhanda (Sl. no. 134), Jugiamer (Sl. no. 135), Dubduar (Sl. no. 136), Gorahar (Sl. no. 137) need more irrigation (Figure 9).
- The villages of the 3rd quadrant are characterized by negative deviation for NSA and irrigated area both. These villages are regionally lagging behind to the maximum. In the Interfluve Narayantola (Sl. no. 10), Pratappur (Sl. no. 11), Mahua (Sl. no. 12), Gurincha (Sl. no. 13), Baradhara (Sl. no. 14), Keshra (Sl. no. 15), Jauniya (Sl. no. 16), Patidaha (Sl. no. 17), Dhusmal (Sl. no. 20), Sarua (Sl. no. 23), Badkol (Sl. no. 25), Kachanbari (Sl. no. 28), Paschim Gobindapur (Sl. no. 29), Panch Bhaiya (Sl. no. 30), Amar (Sl. no. 31), etc villages come under this category. (Figure 9)
- The villages of the 4th quadrants are needed planning for NSA because in this quadrant the villages like Parial (Sl. no. 4), Ghagra (Sl. no. 37), Pariharpur (Sl. no. 49), Baje Bindol (Sl. no. 52), Mahipur (Sl. no. 54), Dhoabishua (Sl. no. 94), Jhitkai (Sl. no. 107) are negatively deviated for NSA. (Figure 9)
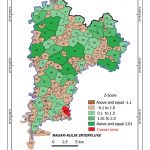 |
Figure 7: Z-Score Net Sown Area – 2011 |
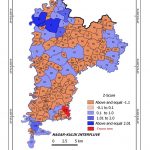 |
Figure 8: Z-Score Irrigated Area – 2011 |
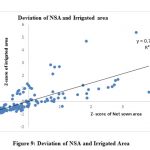 |
Figure 9: Deviation of NSA and Irrigated Area |
Table 5: Planning identified
|
|
Need plan for Net Sown Area |
Need plan for Irrigation Area |
Need plan for Net Sown Area and Irrigation Area |
|
Nagar-Kulik Interfluve |
Parial (Sl. no. 4), Ghagra (Sl. no. 37), Pariharpur (Sl. no. 49), Baje Bindol (Sl. no. 52), Mahipur (Sl. no. 54), Dhoabishua (Sl. no. 94), Jhitkai (Sl. no. 107) |
Mallickpur (Sl. no. 2), Dhalgaon (Sl. no. 3), Kharibadkol (Sl. no. 26), Soharai (Sl. no. 112), Bahin (Sl. no. 119), Bhitihar (Sl. no. 132), etc. |
Narayantola (Sl. no. 10), Pratappur (Sl. no. 11), Mahua (Sl. no. 12), Gurincha (Sl. no. 13), Baradhara (Sl. no. 14), Keshra (Sl. no. 15), Jauniya (Sl. no. 16), Patidaha (Sl. no. 17), Dhusmal (Sl. no. 20), Sarua (Sl. no. 23), Badkol (Sl. no. 25), Kachanbari (Sl. no. 28), Paschim Gobindapur (Sl. no. 29), Panch Bhaiya (Sl. no. 30), Amar (Sl. no. 31), Makdampur (Sl. no. 33), Fazilpur (Sl. no. 34), Dumaria (Sl. no. 35), etc |
Conclusion
Regional disparity in the distribution of agricultural resource basically net sown area and irrigation facility has decreased since last twenty decades; evidenced by the increase of irrigation facility where as NSA is almost remain same as the interfluve is highly used in agricultural practices since long back. A progressive movement has been observed in the 40 (29.41%) villages having more NSA and irrigation facility than the average of the interfluve. The villages required to improve irrigation facility are 11 (8.08%) but the villages required special attention both for the NSA and irrigation facility are quite high in number 79 (58.08%). It can be said from the overall study that as the interfluve has flooded by each year almost, capacity for a variety of crop production like rice, maize, jute etc. and dominated by rural settlement therefore, pressure on land for conversion into built up area in not sound here and irrigation facility also improving, so the interfluve may be reduced by the unevenness in agricultural resource in upcoming time if land conversion would be restricted.
Acknowledgements
First and foremost, we’re extremely thankful to Prof. Dr. Nageshwar Prasad, Formerly Professor of Geography, University of Burdwan, for kindly guiding the Research work. This Research would not have been possible without his invaluable suggestions and support.
Funding
The author(s) received no financial support for the research, authorship, and/or publication of this article.
Conflict of Interest
The authors declare that no conflict of interest exists in the publication of this research work.
References
- All India Report on Input Survey 2011-12. Agriculture Census Division Department of Agriculture, Cooperation & Farmers Welfare Ministry of Agriculture & Farmers Welfare New Delhi, 2016;
- Berry B. J. and Marble D.F. Spatial Analysis. Prentice-Hall, Inc. Englewood Cliffs, New Jersey, 2-5.
- District Human Development Report, Uttar Dinajpur. Development and planning Department, Government of West Bengal, First published February 2010;
- District Resource Map, North Dinajpur, West Bengal. First edition: Published under the direction of the Director General, Geological Survey of India, Kolkata.
- Manly B. F. J., Multivariate Statistical Methods: A Primer. Chapman and Hall, London, 1986; 59-71.
- Mandal S.P., and Gupta K. Relationship between net irrigated area and net sown area mapping in Simlapal block of Bankura District: An assessment, International Journal of Current Research, 2016; 8, (08), 37443-37450.
- Police Station Map, Rayganj, West Dinajpur; Made and Published under the authority of Government in 1940.
- Prasad N., and Ghosh T. Spatio-temporal variation in net sown area in southwest Birbhum District, West Bengal. Practicing Geographer, 2011; 15 (2): 56-67.
- Prasad N., and Sarkar R. Relationship between Changes in Cultivated Area and Irrigated Area in the Burdwan Upland, West Bengal: An Assessment, Rural Development: Challenges and Opportunities, edited by Dr. Piyal Basu Roy, Geographical Society of North Bengal, 2013; 17-25. 978-81-927059-0-3
- Rahman F., et al. Diffusion of irrigation and its impact on agriculture: A case study. Indian Journal of Regional Science, 2008; 20 (1):43-52.
- Renuka C., and Ali M. I. A statistical analysis of farm management data on paddy crop-a study in different regions of Kadam project. Indian Journal of Regional Science, 1997; 29 (2):643-52.
- Tripathi S., and Tiwari R.P. Regional Disparities and Development in India, Ashish Publishing House, New Delhi, 1993; 336-345.
- Singh J. Determinants of Agricultural Change: An Agricultural Atlas of India (A Case Study in Green Revolution), Oxford and I.B.H. Publishing Co. Pvt. Ltd, New Delhi, 1992.
- Singh J., and Dhillon S. S. Agricultural Geography, New Delhi: Tata McGraw-Hill Publishing Company Limited, 1984; 209-244.
- Strong F.W. Eastern Bengal District Gazetteers, Dinajpur. L. Publishers, Siliguri, West Bengal, 1912;