

Introduction
Cotton (Gossypium sp.) belongs to Malvaceae family is oldest of the all fibers used by human beings. It is known as a “King of Fibre” crop due to its global importance in agriculture as well as industrial economy. It contributes significantly to both agriculture and industry in terms of farm income, employment and export earnings. It is grown in more than 100 countries and it is estimated that, the crop is cultivated on about 2.5 per cent of the world cultivable land.1 Cotton cultivation has traditionally concentrated in a few countries viz: China, United States, India, Pakistan, Brazil, Uzbekistan, Turkey and Australia. Together these countries account for more than three quarter of global production. At global level, cotton area is projected to grow by 9 per cent and yield are only projected to increase 6 per cent.
It is commonly known as “White Gold” in farming community. It is a multipurpose crop that supplies 5 basic products viz; lint, oil, seed meal, hulls and linters. Due to its multipurpose nature and use, it has huge demand from industry side, which makes this crop popular among the farming community.
Historically, India has been an exporter of raw cotton to the world, Due to outbreak of Second World War, India’s cotton exports was affected adversely. The second setback came from partition of the country in 1947. A region covering 40 per cent of irrigated fertile land of Punjab and Sindh which were used to produce medium and long staple cotton was lost to Pakistan while over 98 per cent of the textile mills remained in India. Eventually the country was hard pressed to meet its domestic cotton requirements, leave alone exports. This single event converted India into a net importer of cotton overnight.2
The situation is not good for textile industry for its survival in competitive world market. Hence government has taken appropriate policy decisions to reduce the import dependency of Indian textile industry for raw their raw materials by increasing cotton production. This goal was achieved by enhancing the productivity of cotton with adoption of improved variety, hybrids, Bt Hybrids, production technology and expanding area of cotton cultivation. Farmer has expanded area of cotton cultivation as this crop becomes comparatively profitable. For this purpose government launched campaigns “Grow More Cotton” and “Cotton Extension Scheme”. To enhance the productivity, government has set up research programme /scheme / institute viz; All India Coordinated Cotton Improvement Scheme in 1967, Central Institute for Cotton research in 1976 , Intensive Cotton Development Programme in 1971-71.
Because of these efforts, the production of cotton was increased from 3.04 million tonnes to 35.90 million tonnes at National level. This growth in cotton production can visualize because of area expansion and yield improvement.
In Cotton production, Maharashtra is foremost state in India. It covers around 36 per cent cotton area of the country and contributes around 22 per cent of its production. Hence performance of cotton was analyzed on important parameters at state level.
Material and Methods
Data
The time series secondary data on area, production and productivity of cotton at state level was collected for the period from 1988 to 2017-18. The data period was divided in to two sub groups viz; group- I: 1988 to 2002 and group-II: 2003 to 2018. The groups were divided on the basis on basis of introduction of Bt hybrids. The data was collected from official website of Commissionerate of Agriculture, Department of Agriculture, Government of Maharashtra.( www.agri.mah.nic.in.)
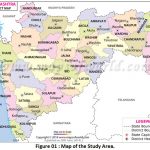 |
Figure 01 : Map of the Study Area. Click here to view Figure |
Analytical Tools
The data was compiled, scrutinized subjected to tabular and functional analysis to get meaningful inferences. Compound growth rate, Cuddy-Della Instability Index, and Minhas and Vidhyanathan decomposition model was employed. For analytical details see More, S.S. et al., 2015 and More et al., 2017.3, 4
Growth Rate
Compound growth rate is a key indicator to measure agricultural growth and usally used for forecasting area/ production/productivity etc. of various commodities. It plays a vital role in agricultural policy making, therefore, estimated value of growth rate needs to be very precise, so the suitable policies can be adopted accordingly. Accuracy of estimated value of growth rate is largely depends on proper statistical procedures followed to estimate it.
Compound growth rate is simply a compounding of annual growth rates over period. It can be easily computed using two data points with constant returns as in case of fixed deposits. However, in case of annual growth rates which are not constant, but for monotonically increasing or decreasing functions, the compound growth rate is computed based on its fit using non-linear models, especially, the exponential model. The exponential model is more commonly used in economic analysis. Conventionally, the compound growth rates were estimated after converting the growth model to semi-log form and estimated through Ordinary Least Square (OLS) technique assuming multiplicative error term.
Yt = b0 * b1t * et ———————————[1]
ln (Yt) = b0+t * ln b1 +et —————————[2]
Where,
ln (Yt) is the natural logarithm of time series data for area / production / yield for year t,
b0 is the constant term,
t is the time trends for years of interest,
et is the error term and
b1 is growth rate for the period under consideration (i.e. slope coefficient).
Then, Compound growth rate was calculated using following equation
Compound Growth Rate = [(Antilog b1)-1]*100 ————-[3]
However, there are several problems associated with this methodology including the difficulty in estimating standard error of estimates of original parameters (Prajneshu & Chandran, 2005)5. Hence, a non-linear estimation technique for solving exponential model assuming additive error terms were used to estimate the compound growth rates.
Yt = constant *(1+CGR)t +et ————————————-[4]
Where,
Yt is the time series data for area / production / yield for year t,
t is the time trends for years of interest,
et is the error term and
CGR is Compound Growth Rate for the period under consideration.
The data were smoothened with the help of three year central moving average techniques to remove bias from the data if any induced by the outliers ( Sawant, 1983; Sawant and Achuthan,1995; Singh et al.,1997)6 7 8. The Marquardt algorithm was used to estimate the parameters of equation [4]. The significance of regression coefficient ‘b’ (slope coefficient) was tested by applying standard ‘t’ test procedure (Gujarati and Sangeetha, 2007)9.
Instability
The measure that may use to estimate instability in a variable over time should satisfy two minimum conditions. First, it should not include deviations in the data series that arise due to secular trend or growth. Second, it should be comparable across the data sets having different means (Mehra, 1981; Hazell, 1982)10,11. Simple coefficient of variation (CV) overestimates the level of instability in time series data, characterised by the long-term trends. To avoide the problem of overestimation, Mehra (1981)10 and Hazell (1982)11 has developed two independent methods of estimation of instability in the time series data. Both the methods involve detrending of the data series. However, both methods have been criticized for measuring instability around arbitrarily assumed trend line, which greatly influences inference regarding changes in instability (Ray, 1983)12.
Ray (1983)12 has developed a very simple measure of using standard deviation in annual growth rates. This method satisfies all the ideal properties like instability based on de-trended data and comparability. Moreover, the methodology does not involve actual estimation of the trend, computation of residuals and de-trending, but all these are taken care in the standard deviation of annual growth rates. This method does not suffer from the limitations of arbitrary choice of assumed trend line which was present in the methods developed by Mehra, 198110 and Hazell, 198211.
But, in recent year at international level, Cuddy-Della Valle Index was used as a measure of variability in time series data analysis (Weber and Sievers, 1985; Singh and Byerlee, 1990; Deb et al.,2004)13,14,&15. Singh and Byerlee (1990)14 found identical results of instability, when they estimated instability by Cuddy-Della Valle Index and Coefficient of Variation around trend as the standard error of regression divided by mean. Since both methods provides similar results and possess all desirable properties, hence we have estimated instability in area, production and yield of major crop groups using the Cuddy-Della Valle Index for the present investigation.
This index is a modification of coefficient of variation [CV] to accommodate trend, which is commonly present in time series economic data. It is superior over other scale dependent measures such as Standard Deviation or Root Mean Square of the residuals (RMSE) obtained from the fitted trend lines of the raw data, and hence suitable for cross comparisons (Cuddy and Della Valle, 1978)16 (Della Valle, 1979)17.
The Cuddy-Della Valle Index (Ix) was calculated as follows:
![]()
Where,
Ix= Instability index
SEE = Standard error of the trend line estimates
Ȳ= Average value of the time series data
Alternatively, Ix could be measured as:
Where,
R2 = Adjusted coefficient of multiple determination
Where ever trend in the time series data was non-significant, instability of that particular series was analysed with the help of conventional statistical tool of instability i.e. coefficient of variation.
The SAS macros for econometric analysis-I available on web adrees of Indian Agricultural Statistical Research Institute, New Delhi (http :// www. iasri. res. In / sscnars / ecoanlysis.aspx)18 was used to analyse the data with the help of Statistical Analysis System (SAS) software, Version 9.3 available at Department.
Results and Discussion
The performance of cotton was adjudicated on two important considerations i.e. growth and instability in area, production and productivity of cotton at Maharashtra. Sources of production were also identified by decomposing the cotton production series and contribution of area and yield was estimated and results were presented in table 1 to 4.
The average area, production and productivity of cotton was calculated for two sub periods viz; period-I (1988 to 2002) and period –II (2003 to 2018) as well as for overall period (1988 to 2018) and results were presented in table 1. A perusal of table 1, it is revealed that, the average area, production and yield of cotton in Maharashtra was improved during period-II over period-I.
The average area of cotton in Maharashtra during period –I and period-II was 28880 and 34977 hundred hectares, respectively. At overall period, it was 31929 hundred hectares. In regards with cotton production, it was 22415 and 50487 hundred MT, respectively. During overall period it was 36451 hundred MT. The average productivity of cotton in Maharashtra was amplified after the adoption of Bt Hybrids cotton by farmers. The average yield of cotton in Maharashtra during period –I was 131 kg per hectares, it was raised to 242 kg per hectares during period-II. During overall period of the study, the yield of cotton was 187 kg per hectares. More, et al., 2017 reported that, the yield of cotton was significantly increased during recent period.4
Table 1: Average Area, Production and Yield of Cotton in Maharashtra.
| Parameters | Period-I | Period-II | Overall Period |
| Area | 28880 | 34977 | 31929 |
| Production | 22415 | 50487 | 36451 |
| Yield | 131 | 242 | 187 |
Source : Author’s own estimate
Note: Area in ‘00’ ha; Production in ‘00’ MT; Yield in kg/ha.
The compound growth rate was calculated using best fit non-linear exponential model. The equation was estimated using marquardt algorithms5. The analysis was carried out using SAS macro available on IASRI web site with the help of SAS 9.3 software. The estimate of compound growth rate for two sub periods and overall period was presented in table 2 and figure 01.
The compound growth rate (CGR) of area in cotton during period-I was 1.93 per cent per year and it was 4.05 per cent per year during period-II. In both the sub-periods CGR was significant. During overall period, CGR of area in cotton was 1.76 per cent per year. The CGR was increased sub substantially during the second sub period. The increase in CGR of cotton area is an indication that, farmers of the state have given preference to this crop over other competitive crop in their cropping pattern due to its profitability.
The CGR of production and yield of cotton was also improved during second sub period of the study. The CGR of cotton production during period-I was 4.17 per cent per year and it was 6.72 per cent per year during second sub period. During overall sub period, the production of cotton was increased at an annual growth rate of 6.32. The increase in production growth can visualize due to expansion in area and improvement in yield of cotton. Decomposition analysis was carried out to see the sources of production growth.
The productivity of cotton was raised to 3.41 per cent per year during second sub period from 2.34 per cent per year of first sub period. During overall study period the CGR of productivity of cotton was 4.22 per cent per year. The CGR in all the sub periods and overall period was significant at one per cent level of significance.
Table 2: Estimates of Compound Growth Rate of Area, Production and yield of Cotton in Maharashtra.
| Parameters | Period-I | Period-II | Overall Period | |||
| CGR | ‘t’ value | CGR | ‘t’ value | CGR | ‘t’ value | |
| Area | 1.93 | 6.63 | 4.05 | 13.31 | 1.76 | 8.62 |
| Production | 4.17 | 4.57 | 6.72 | 4.92 | 6.32 | 11.47 |
| Yield | 2.34 | 2.55 | 3.41 | 2.85 | 4.22 | 8.87 |
Source : Author’s own estimate
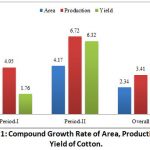 |
Figure 1: Compound Growth Rate of Area, Production and Yield of Cotton. |
Table 3: Estimates of Instability Index of Area, Production and Yield of Cotton in Maharashtra.
| Parameters | Period-I | Period-II | Overall Period |
| Area | 5.79 | 5.40 | 9.73 |
| Production | 24.79 | 35.08 | 36.13 |
| Yield | 24.44 | 31.27 | 31.78 |
Source : Author’s Own Estimate
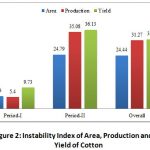 |
Figure 2: Instability Index of Area, Production and Yield of Cotton |
Cuddy-Della Valle instability index which is a revision of coefficient of variation to accommodate for drift was employed to estimate the instability in area, production and productivity of cotton in Maharashtra state.16, 17 The results were presented in table 3 and figure 3.
A perusal of table 03, it is revealed that, instability in production and productivity of cotton was increased during second sub period of study related to first sub period. It was increased to 35.08 per cent from 24.79 per cent per annum in production. In regards with yield, instability was increased from 24.44 to 31.27 per cent per annum. Instability in area was stable in both the period and it was around six per cent. During overall study period, instability in area, production and productivity of cotton was 9.73, 36.13 and 31.78 per cent per annum, respectively. The instability in production was seen maximum compared to yield and area. This is obvious, as production is an interaction of area and yield so instability in yield and area was reflected in the production series. Narala and Reddy (2015) reported that, area of cotton was steady than production and productivity.19
The contribution of area and yield towards cotton production was measured by decomposing the cotton production series. The method proposed by Minhas and Vidhyanathan (1965) and reframed by Sharma (1977) was employed.20, 21 The decomposition results give the per cent contribution of area, productivity and its interactions for boosting cotton production in the state. The results of the decomposition analysis were reported in table 4.
The result shows that, during first period of the research, the contribution of area and productivity was 5.47 per cent and 97.32 per cent. Similar trend was observed during second sub period and overall period of research, where contribution of area and yield was 8.60 per cent and 91.67 per cent, respectively in second sub period and 8.67 and 91.63 per cent in overall study period. The results undoubtedly indicate that, the contribution of productivity was more dominant in cotton production compared to area. Chahal et al., 2003 reported that, productivity of cotton was significant factor for boosting cotton production in India.22
Table 4: Results of Decomposition Analysis.
| Parameters | Area Effect | Yield Effect | Interaction Effect |
| Period-I | 5.47 | 97.32 | -2.79 |
| Period-II | 8.60 | 91.67 | -0.27 |
| Overall Period | 8.67 | 91.63 | -0.23 |
Source : Author’s Own Estimate
Conclusion
The area, production and Productivity of cotton were increased significantly after the adoption of Bt hybrids technology by farmers in large scale. The enhancement in productivity of cotton after the adoption of Bt hybrids technology by farmers was associated with the moderate instability. The productivity of cotton was moderately fluctuating from one year to another year. These fluctuations were also seen in cotton production. Bt cotton hybrids improved the yield and production and in some extent were also responsible for area expansion but the yield and production performance of cotton after the introduction of Bt was not stable. Enhancement in yield was the major factor responsible for improvement in cotton production in Maharashtra state compared to area.
Conflict of Interest
No
Acknowledgements
Authors’ are thankful to the referee for review of the paper and University authority for their financial support.
Funding Source
In house funded project.
Reference
- Shivsankar, A and Naidu, V.B. (2015) Comparative analysis of growth and instability of cotton: India vis-à-vis World. Indian Stream Research Journal, 5: 1-11.
- Singh, R.P., Lal Roshan and Singh, D.R. (1993) Cotton development and export potential of India. Agriculture Situation in India, 63 (4): 251-256.
- More, S.S., Singh, N. and Kuthe, S.B. (2015) Performance of pulses crops in Gujarat State- A decomposition analysis. International Journal of Agricultural Sciences, 7 (5): 510-515.
- More, S.S., Singh. N and Leua, A. ( 2017) Performance of cotton in Gujarat: A long term critical analysis. Journal of Cotton Research Development, 31 (1) : 157-163.
- Prajneshu and Chandran, K.P. (2005) Computation of compound growth rates in agriculture: Revisited, Agricultural Economic Research Review. 18: 317-324.
- Sawant, S.D. (1983). Investigation of the hypothesis of deceleration in Indian agriculture. Indian Journal of Agricultural Economics, 38(4): 475-496.
- Sawant, S.D., and Achuthan, C.V. (1995). Agricultural growth across crops and regions: Emerging trends and patterns. Economic and Political Weekly, 30(12): 2-13.
- Singh, I.J., Rai, K.N., and Karwasra, J.C. (1997). Regional variations in agricultural performance in India. Indian Journal of Agricultural Research, 52(3): 374-386.
- Gujarati, D. N., and Sangeetha. (2007). Basic econometrics. New Delhi: Tata McGraw Hill Education, Pvt. Limited.
- Mehra, S. (1981). Instability in Indian agriculture in the contex of the new technology. Washington DC., USA: International Food Policy Research Institute.
- Hazell, P.B. (1982). Instability in Indian foodgrain production. Washington, DC.,USA: International Food Policy Research Institute.
- Ray, S.K. (1983). An empirical investigation of the nature and causes for growth and instability in India : 1950-80. Indian Journal of Agricultural Economics, 38(4): 459-474.
- Weber, A., and Sievers, M. (1985). Observations on the geopraphy of wheat production instability. Quarterly Journal of International Agriculture, 24(3): 201-211.
- Singh, A.J., and Byerlee, D. (1990). Relative variability in wheat yields across countries and overtime. Journal of Agricultural Economics, 41(1): 21-32.
CrossRef - Deb, U. K., Bantilan, M., Evenson, R. E., and Roy, A. D. (2004). Productivity impact of improved sorghum cultivars. In : Bantilan, M., Deb, U.K., Gowda, C., Reddy, B., Obilana, B.A.D., and Evenson, R.E. Sorghum genetic enhancement : research. process, dissemination and impacts. Patancheru, Andhra Pradesh, India: ICRISAT.pp.203-222.
- Cuddy,J.D.A, and P.A.Della Valle (1978). “Measuring the instability in time series data.” Oxford Bulletin of Economics and Statistics. 40(1): 79-85.
CrossRef - Della Valle,P.A. (1979) “On the instability index of time series data: A generalization”, Oxford Bulletin of Economics and Statistics. 41(3): 247-248.
CrossRef - SAS Macro (n.d.) The SAS macros for econometric analysis-I Retrieved January 22, 2014, from http:// www.iasri.res.in /sscnars / ecoanlysis .aspx
- Narala, A. and Reddy, A.R. (2011). Analysis of growth and instability of cotton production in India. Paper presented at the World Cotton Research Conference on Technologies for Prosperity. Retrieved from website https://www.icac.org/wpcontent/uploads/2012/03/wcrc5_proceedings_part8.pdf
- Minhas, B.S. and Vaidhyanathan, A. (1965) Growth of crop output in India. Journal of Indian Society of Agricultural Statistics, 28 (2): 230-252.
- Sharma, K.L. (1977) Measurement of the effects to area, yield and prices in the increase of value of crop output in India. Agricultural Situation in India, 32: 348-350.
- Chahal, S.S., Singh, R.H. and Singh, S. (2003) A study in to growth analysis of production and acreage response of cotton in Punjab. Agriculture Situation in India, 60 (1): 3-10.