

Introduction
Common bean or Haricot bean is a diploid (2n=2x=22), yearly and principally self-fertilizing legume that cultivated globally mostly for direct human consumption, with a marketable significance surpassing altogether the remaining pulse (Graham and Vance, 2003). Even though little in methionine and cysteine, the dry seeds are an chief source of dietetic protein, dietetic fiber, amino acids lysine and tryptophan, minerals iron, copper, zinc, anti-carcinogenic components and antioxidants such as flavonoids which devour free radicals, beneficial phytochemicals and phenolics for lots of individuals all over the tropics, accompanying those amino acids missing in foods established on maize, rice or other cereals (Broughton et al., 2003; FAO, 1999).
In the horn of Africa haricot bean is considered as the main cash crop and protein font for most poor growers. Farmers also practice haricot bean remains for feed and bedcovers for animals, insulating, energy and tiles material (Dagnew et al. 2014). In Ethiopia haricot bean positions third as an export item next coffee and oil seeds which is coming up with about nine point five percent of the entire market overseas charge from agricultural system (FAOSTAT, 2010). White and red common bean takes the second largest share of the grain crop area 0.74% (about 94,789.94 hectares) and 1.45% (about 186,293.55 hectares), respectively. The production obtained from white and red common beans is 0.52% (about 172739.897 tones) and 0.93% (312807.196 tones), respectively (CSA, 2019/20). The average national yield of white and red common beans is about 2 and 1.9 t/ha, respectively (CSA, 2019/20) which is very low equated to the mean harvest of 2.3 t/ ha in the United States of America (FAO, 2019). This relatively low yield of common bean production in most bean producing countries including Ethiopia is generally related to many abiotic and biotic factors such as; drought, acidity, salinity, diseases, poor agronomic practice, absence of effective and stress tolerant indigenous rhizobia in the soil, poor nitrogen fixing ability and the genetic background of the plant itself can be mentioned (Negash 2007; Caldas et al., 2016; Slattery et al., 2001; Reinprecht et al., 2020; Martínez-Roméro E 2003; Kumarasinghe et al., 2016).
Though common bean is poor in nitrogen fixation when compared to other legumes, still there are a number of genotypes that fix significant amounts of nitrogen in association symbiotically with rhizobia (Peoples et al., 2009). Many national and international greenhouse results also confirmed that inoculation of haricot bean with stress tolerant rhizobia has ensued in biomass, harvest, and nitrogen echelons increment within host plant. However, due to known and unknown reasons the symbiont- host association has been not as much of effectual in farm environments (Negash 2007; Hungria and Vargas, 2000).
Forming Rhizobium-pulse symbiosis under extreme field soil condition, principally in acidic soil; the host pulse crop is the restraining element. Generally legumes have a different reaction to low pH concerning growth and nodulation. Several research results also indicate the volume of nitrogen fixed by fodder leguminous plant on less productive and low pH soil is reliant on legume development and existence (Thomas, 1995). On the other hand, selection and inoculation of legumes with stress-tolerant wild or mutant rhizobia made the establishment of effective symbiosis under stressed field condition (Correa and Barneix, 1997; Glenn Dilworth, 1994). Concerning the argument said previously, in addition to evaluating better tolerant host genotype it is mandatory to work on selection of stress tolerant and symbiotically most effective wild and mutant rhizobial isolates at in-vitro condition. Therefore, this exact research focused on in what way carefully chosen rhizobia isolates enrich productivity of haricot bean in eastern Ethiopia.
Material and Methods
Description of the Study Area
The rhizobia were isolated from soil samples of pulse growing areas in the lowlands of East Hararghe Zone around Babile, a small town located 32 km and 529 km away from the ancient city of Harar and Addis Ababa, respectively. The lowlands of the East Hararghe zone generally included altitude ranging from 1300 to 1600 meter above sea level.
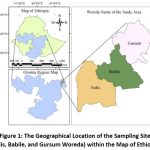 |
Figure 1: The Geographical Location of the Sampling Sites (Fedis, Babile, and Gursum Woreda) within the Map of Ethiopia. |
Soil Sample Assemblage
The soil samples were gathered from three main potential pulse-cultivating districts in Eastern Hararghe lowland and mid-altitude areas in April 2012 (Table 3). Common bean and ground nuts are the most cultivated legumes in these areas. In each area, five bulk soil samples; three kilograms, were randomly collected with an auger and sterile plastic baggage from a depth of 0-20 cm of the surface for the isolation of indigenous rhizobia by host trap method as indicated in Somasegaran and Hoben (1994). Soil collection spots were geo-referenced using the Universal Transverse Mercator (UTM) geographic coordinating system. Proper procedures were implemented to evade mixing up of the soil samples pending used for the greenhouse pot experiment and soil pH analysis.
Designation of the Isolates
Each isolate was designated as HUCR (Haramaya University Common bean Rhizobium) for the wild isolate and HUCRM (Haramaya University Common bean Rhizobium Mutant) for the mutant isolates followed by a number (represent Kebele) and a letter (represent Genda or Village).
Physiological Characterization of Wild Rhizobium Based on Salt and pH Tolerance
The in vitro pH tolerance among Rhizobium isolates was determined using the method described by Lupwayi and Haque (1994). Media plates of YEMA (Yeast Extract Mannitol Agar) containing various concentrations (2%, 4%, 6% and 7% )of sodium chloride or TY(Tryptone Yeast) agar media adjusted to pH levels of 4-9 ( for pH tolerance) were prepared and inoculated with appropriately diluted pure cultures of the isolates (Somasegaran and Hoben 1994). The petri plates were then incubated at about 30oC for 4 days. Finally, the growth of the rhizobial strains was qualitatively evaluated as negative (-) for no growth and positive (+) for growth, and in the same manner the susceptibility to NaCl was recorded as a positive (+) for growth or negative (-) for the absence of growth.
Authentication and Assessment of Synergetic Efficacy of Wild Rhizobium in Sterilized Sand Culture
Fifty pure isolates that qualified the presumptive test were further tested for authentication in the greenhouse (Table 3). Fine graded river sand was washed in tap water and immersed in concentrated sulphuric acid (H2 SO4) for two days. It was washed in several changes of tap and distilled water to get rid of the last traces of the acid and autoclaved for 1.5 hours before filling into plastic pots of 3 kg capacity which were superficial sanitised with ninety five percept ethanol (Lupwayi and Haque, 1994). Two hundred and fifty common bean seeds, Haramaya University Gofta (G-2816) variety, of uniform size and colour were superficial sanitised by suspending for ten minutes in 3-5% H2O2 with washings of several changes of distilled water (Somasegaran and Hoben, 1994). The sterilized seeds were then transferred to distilled water and incubated at 25oC for 3 days of germination. Five surface sterilized and pre-germinated seeds were moved into each pot, which was far along rarefied to three after a week of planting. Each pre-germinated seeds were shot with 1ml culture of each isolate adjusted to an inoculum size of 109cell/ml (Somasegaran and Hoben, 1994). The pots with seedlings were subsequently provided by distilled water every two days and fertilized once a week with quarter strength of Broughton and Dilworth N-free medium described in Somasegaran and Hoben (1994).
Forty-five days after sowing, the plants were harvested and their roots were scored for nodulation. The shoots of plants, as well as the nodules, were then oven-dried to determine their dry weight at 700C for 48 hrs at the HU Microbiology laboratory. Synergetic efficacy (SE) of the isolates was equated rendering to the formula:
![]()
Then, Synergetic efficacy (SE) of isolates were graded as ineffective, lowly-effective, effective, and highly effective, when the calculated values were <35%, 35-50%, 50-80%, and >80 %, respectively (Beck et al., 1993).
Evaluation of the Synergetic Efficacy of Wild Rhizobium in Unsterilized Soil
The efficacy of five selected isolates was determined by the pot trial using unsterilized soil at Haramaya University greenhouse (Table 5). The soil was well mixed, sieved and air–dried. Three Kg of this soil was distributed to plastic pots. Twenty-five common bean seeds of “Gofta (G-2816) Variety” was surface sterilized as before and rinsed in five changes of sterilised salt free water. Five un-germinated seedlings were planted in each pot and later rarefied down to three after germination for one week. After a week, each germinated seed was shot with 1 ml of each isolate grown for 72 hrs in YEM broth. The experiment was set up in replicates in the greenhouse and the pots were arranged in complete random design with each block consisting of negative control (without nitrogen and inoculum) and positive control (without inoculum but with nitrogen). The nitrogen fertilizer (KNO3) was given at an amount of zero point five grams per litter per week until the plants were harvested. All the pots were watered every two days.
Plant Total Nitrogen Content Analysis
The modified Kjeldahl method was used to evaluate the nitrogen content of the plant samples collected from the pot experiment (Sahlemedhin Sertsu and Taye Bekele, 2000). In this method, plant samples were first ground, and initially, 0.3 g of the resulting material was measured in a 100 ml digestion tube for analysis. Following this, 0.5 g of a mixture of 10 g K2SO4, 2 g CuSO4.5H2O, and 0.2 g Selenium was added to the ground sample and used as a catalyst. A mixture of sulphuric and salicylic acid (7 ml) was also added to the ground sample and permitted to react for 30 minutes. Also, 0.5 g of Na2S2O3.5H2O was added and shaken to react for five more minutes. A blank consisting of 0.5 g salt mixture and seven millilitres of the sulphuric-salicylic mix was also prepared. The digestion of the ground sample was undertaken at a temperature of 3000C for 2hrs until the content turned colourless. Then, the sample was distilled by adding 75 ml of 40% NaOH and its nitrogen together with a flask containing 20 ml boric acid until the volume reached 110 ml. Ultimately, the distillate was titrated using 0.1 N H2SO4 and the reading of the burette used to calculate the percentage nitrogen using the formula:
![]()
Where a1 = ml of titrant used for the sample
b2 = ml of titrant used for the blank
N = Normality for the acid
S = weight of the plant material
Total N uptake was calculated as:
![]()
Assortment of Salt and pH Lenient Rhizobium Mutants
Serial dilution of a pure culture of selected mutants was prepared. Following this, aliquots of the appropriate dilutions were spread on sterile TY agar media containing various concentrations of sodium chloride (8, 9, 10, 11, 12, 14, 16, and 18%) and measuring different levels of pH (pH 1-10) to test the levels of salt and pH tolerance of the test strains. Colonies that appeared on TY agar media, containing concentrations of NaCl higher than the maximum value which is 10% and pH adjusted to pH ≤ 4 or pH ≥ 10.5 required for the assortment of wild rhizobium were carefully chosen as salt and pH lenient mutants, respectively (Bernal and Graham, 2001; Abbdel Hamid et al., 2011).
Chemical Mutagenesis
Hydroxylamine hydrochloride and sodium azide were used as chemical mutagenic agents to induce mutation in Rhizobium isolates as described by O’Connel et al. (1990). Late exponential phase cultures (approximately 2 x 10⁸ cfu ml-1) were used in all mutagenesis experiments. The rhizobial isolates were pelleted in an Eppendorf microcentrifuge, washed once with phosphate-buffered saline (0.876gm NaCl, 0.522gm K2HPO4, 0.136 gm KH2PO4 per 100 ml), and re-suspended to the original volume in phosphate-buffered saline solution. From the stock solution of each mutagenic substance (1.17g/ml), 0.0, 100, 200, and 300µl was added into each ml of rhizobial culture suspension. Subsequently mixing with a vortex, the cells were incubated at room temperature for 60 minutes. The mixture was then diluted and spread plated on TY agar medium without salt. After three days of incubation at 28±2 OC, colonies of Rhizobium were observed and only those colonies that were grown in all the three different mutagenic chemical concentrations were selected as true mutants (Table 6).
Physical Mutagenesis
Physical mutagenesis was carried out according to the method described by O’Connel et al. (1990) late exponential phase cultures (approximately 2 x 10⁸CFU ml-1). Pure culture of each Rhizobium isolate was first pelleted in an Eppendorf microcentrifuge, washed twice; and re-suspended in phosphate buffer. Five millilitres of the cell suspension was spread thinly on an open glass Petri dish and exposed for 15 seconds to UV radiation at 2000µw/cm2 intensity. Each irradiated suspension was streaked on a Petri dish containing TY agar media and incubated at 28OC for three days. The remaining colonies were moved to other fresh media for conservancy and further physiological tests. Thus, further screening was made to select desired mutants based on their ability to withstand extreme pH conditions, high salt concentrations (Table 6).
Evaluation of the Symbiotic Efficacy of Mutant Rhizobial Isolates
As Table (7 and 8) depicts the symbiotic effectiveness of the mutant rhizobial isolates on sterilized sand and unsterilized soils was determined using pot experiments in a growth chamber at Haramaya University Agronomy laboratory according to Subba Rao (1999). Percentage symbiotic effectiveness of isolates was calculated according to the equation proposed by Lupwayi and Haque, (1994). Symbiotic efficacy was then categorised as used for the wild isolates, i.e. ineffective, <35%; lowly-effective, 35-50%; effective, 50-80%; and highly effective, >80% (Beck et al., 1993).
Data Analysis
Comparison between treatments was analysed using one-way ANOVA (Fisher’s LSD tests) (SAS.9.1). The data that used in the analysis were nodule number, nodule dry weight, shoot dry weight, % of nitrogen, and the content of nitrogen.
Results
Isolation and Presumptive Test for Identification of Rhizobia
Overall 50 Common bean rhizobial bacteria were obtained from nodules that were induced from soils of Babile (40 isolates), Fedis (5 isolates), and Gursum (5 isolates) (Table 3). Hundred per cent of the isolates were found to be gram-negative, rod-shaped bacteria that did not absorb Congo red on YEMA-CR medium and were not grown on Peptone Glucose Agar (PGA). According to Subba Roa (1999) growth of bacteria on PGA media is a useful criterion for the identification of true Rhizobia from the root nodule. These 50 isolates turned YEMA medium containing bromothymol blue (YEMA-BTB) into moderately yellow, yellow, and deep yellow colour after 48 hours of incubation showing that all the isolates were fast-growing acid-producing rhizobia (Table 3). Somasegaran and Hoben, (1994) and Gupta (2000) also confirmed that colonies of fast-growing Rhizobium spp. can show little or no Congo red absorption when incubated in the dark and should turn the YEMA-BTB to yellow after 3-5 days of incubation.
Authentication of Rhizobia
To determine the potential of the isolates that were induced from the soils of eastern Ethiopian lowland and mid-altitude to form nodules, they were re-inoculated on the host plant on a sterile pouch and grown in a growth chamber. All the 50 isolates made nodulation and were legitimate as root nodulating bacteria (Somasegaran and Hoben, 1994)
Salt and pH Lenience of Wild Rhizobia Isolates
The isolates displayed growth differences on the YEMA medium adjusted to different NaCl concentrations (Table 1). Among the 50 isolates 43(86%), 37(74%), 29(58%), 6(12%), were grown at 2%, 4% and 6% of NaCl on YEMA medium, respectively (Table 1). The most salt-tolerant isolates were HUCR9A and HUCR7B from Babille grown at 6% NaCl concentration. on the flip side, isolates HUCR (9C, 10A, 10B, 10C, 12B, 12C) from Babile were found to be within a narrow range of salt tolerance up to 2% of NaCl concentration and HUCR (3C,5D,12E,13A,13B,13C,13E) were the most sensitive isolates which did not grow at 2% of NaCl concentration (Table 1). The tolerance to pH changes varied amongst the tested isolates (Table 2). In this study, growth was detected from pH 4.5-8.5. All of the rhizobia isolates were grown in between pH 5.5-8. Four per cent of isolates were adapted to develop at pH 4.5 and pH 8.5, respectively (Table 2). Only two isolates from Babile HUCR (2C, 5C) managed to grow on all the tested pH values whereas (Table 2). All isolates from Gursum, Fedis, and 96% of the isolates from Babile failed to grow at pH <5 (Table 2).
Table 1: Tolerance of the Isolates to different Salt Concentrations.
| Isolates |
Soil sampling localities
|
Salt Concentration | |||||||||
| 2% | 4% | 6% | 8% | 9% | 10% | 11% | 12% | Salt Tolerance Range | |||
| HUCR2A | Babile | + | + | – | – | – | – | – | – | 2-4 | |
| HUCR2B | Babile | + | + | – | – | – | – | – | – | 2-4 | |
| HUCR2C | Babile | + | + | – | – | – | – | – | – | 2-4 | |
| HUCR2D | Babile | + | + | – | – | – | – | – | – | 2-4 | |
| HUCR2E | Babile | + | + | – | – | – | – | – | – | 2-4 | |
| HUCR3A | Fedis | + | + | – | – | – | – | – | – | 2-4 | |
| HUCR3B | Fedis | + | + | – | – | – | – | – | – | 2-4 | |
| HUCR3C | Fedis | – | – | – | – | – | – | – | – | < 2 | |
| HUCR3D | Fedis | + | + | – | – | – | – | – | – | 2-4 | |
| HUCR3E | Fedis | + | + | – | – | – | – | – | – | 2-4 | |
| HUCR5A | Babile | + | + | – | – | – | – | – | – | 2-4 | |
| HUCR5B | Babile | + | + | – | – | – | – | – | – | 2-4 | |
| HUCR5C | Babile | + | + | – | – | – | – | – | – | 2-4 | |
| HUCR3E | Fedis | + | + | – | – | – | – | – | – | <2 | |
| HUCR5E | Babile | + | + | – | – | – | – | – | – | 2-4 | |
| HUCR6A | Babile | + | + | – | – | – | – | – | – | 2-4 | |
| HUCR6B | Babile | + | + | – | – | – | – | – | – | 2-4 | |
| HUCR6C | Babile | + | + | – | – | – | – | – | – | 2-4 | |
| HUCR6D | Babile | + | + | – | – | – | – | – | – | 2-4 | |
| HUCR6E | Babile | + | + | – | – | – | – | – | – | 2-4 | |
| HUCR7A | Babile | + | + | – | – | – | – | – | – | 2-4 | |
| HUCR7B | Babile | + | + | – | – | – | – | – | – | 2-6 | |
| HUCR7C | Babile | + | + | – | – | – | – | – | – | 2-4 | |
| HUCR7D | Babile | + | + | – | – | – | – | – | – | 2-4 | |
| HUCR7E | Babile | + | + | – | – | – | – | – | – | 2-4 | |
| HUCR9A | Babile | + | + | + | – | – | – | – | – | 2-6 | |
| HUCR9B | Babile | + | + | – | – | – | – | – | – | 2-4 | |
| HUCR9C | Babile | + | – | – | – | – | – | – | – | 2 | |
| HUCR9D | Babile | + | + | – | – | – | – | – | – | 2-4 | |
| HUCR9E | Babile | + | + | – | – | – | – | – | – | 2-4 | |
| HUCR10A | Babile | + | – | – | – | – | – | – | – | 2 | |
| HUCR10B | Babile | + | – | – | – | – | – | – | – | 2 | |
| HUCR10C | Babile | + | – | – | – | – | – | – | – | 2 | |
| HUCR10D | Babile | + | + | – | – | – | – | – | – | 2-4 | |
| HUCR10E | Babile | + | + | – | – | – | – | – | – | 2-4 | |
| HUCR12A | Babile | + | + | – | – | – | – | – | – | 2-4 | |
| HUCR12B | Babile | + | – | – | – | – | – | – | – | 2 | |
| HUCR12C | Babile | + | – | – | – | – | – | – | – | 2 | |
| HUCR12D | Babile | + | + | – | – | – | – | – | – | 2-4 | |
| HUCR12E | Babile | – | – | – | – | – | – | – | – | <2 | |
| HUCR13A | Babile | – | – | – | – | – | – | – | – | <2 | |
| HUCR13B | Babile | – | – | – | – | – | – | – | – | <2 | |
| HUCR13C | Babile | – | – | – | – | – | – | – | – | <2 | |
| HUCR13D | Babile | + | + | – | – | – | – | – | – | 2-4 | |
| HUCR13E | Babile | – | – | – | – | – | – | – | – | <2 | |
| HUCR14A | Gursum | + | + | – | – | – | – | – | – | 2-4 | |
| HUCR14B | Gursum | + | + | – | – | – | – | – | – | 2-4 | |
| HUCR14C | Gursum | + | + | – | – | – | – | – | – | 2-4 | |
| HUCR14D | Gursum | + | + | – | – | – | – | – | – | 2-4 | |
| HUCR14E | Gursum | + | + | – | – | – | – | – | – | 2-4 | |
| % of tolerant isolates | 86 | 74 | 4 | 0 | 0 | 0 | 0 | 0 | |||
Key: (+) = Presence of Growth; (-) = Absence of Growth
Table 2: Tolerance of the Isolates to the Different pH Level.
| Isolates | Soil sampling localities | pH 4.5 | pH 5 |
pH 5.5 |
pH 6 |
pH 7 |
pH 8 |
pH 8.5 |
pH 9 |
pH 9.5 |
pH 10 |
pH 10.5 |
pH Tolerance Range |
| HUCR2A | Babile | – | + | + | + | + | + | – | – | – | – | – | 5-8 |
| HUCR2B | Babile | – | _ | + | + | + | + | – | – | – | – | – | 5.5-8 |
| HUCR2C | Babile | + | + | + | + | + | + | + | – | – | – | – | 4.5-8.5 |
| HUCR2D | Babile | – | + | + | + | + | + | – | – | – | – | – | 5-8.5 |
| HUCR2E | Babile | – | _ | + | + | + | + | – | – | – | – | – | 5.5-8 |
| HUCR3A | Fedis | – | + | + | + | + | + | – | – | – | – | – | 5-8 |
| HUCR3B | Fedis | – | _ | + | + | + | + | – | – | – | – | – | 5.5-8 |
| HUCR3C | Fedis | – | + | + | + | + | + | – | – | – | – | – | 5-8 |
| HUCR3D | Fedis | – | + | + | + | + | + | – | – | – | – | – | 5-8 |
| HUCR3E | Fedis | – | + | + | + | + | + | – | – | – | – | – | 5-8 |
| HUCR5A | Babile | – | + | + | + | + | + | – | – | – | – | – | 5-8 |
| HUCR5B | Babile | – | _ | + | + | + | + | – | – | – | – | – | 5.5-8 |
| HUCR5C | Babile | + | + | + | + | + | + | + | – | – | – | – | 4.5-8.5 |
| HUCR5D | Babile | – | + | + | + | + | + | – | – | – | – | – | 5-8 |
| HUCR5E | Babile | – | + | + | + | + | + | – | – | – | – | – | 4.5-8 |
| HUCR6A | Babile | – | + | + | + | + | + | – | – | – | – | – | 5-8 |
| HUCR6B | Babile | – | + | + | + | + | + | – | – | – | – | – | 5-8 |
| HUCR6C | Babile | – | + | + | + | + | + | – | – | – | – | – | 5-8 |
| HUCR6D | Babile | – | _ | + | + | + | + | – | – | – | – | – | 5.5-8 |
| HUCR6E | Babile | – | + | + | + | + | + | – | – | – | – | – | 5-8 |
| HUCR7A | Babile | – | + | + | + | + | + | – | – | – | – | – | 4.5-8 |
| HUCR7B | Babile | – | + | + | + | + | + | – | – | – | – | – | 5-8 |
| HUCR7C | Babile | – | + | + | + | + | + | – | – | – | – | – | 5-8 |
| HUCR7D | Babile | – | _ | + | + | + | + | – | – | – | – | – | 5.5-8 |
| HUCR7E | Babile | – | + | + | + | + | + | – | – | – | – | – | 5-8 |
| HUCR9A | Babile | – | + | + | + | + | + | – | – | – | – | – | 5-8 |
| HUCR9B | Babile | – | _ | + | + | + | + | – | – | – | – | – | 5.5-8 |
| HUCR9C | Babile | – | + | + | + | + | + | – | – | – | – | – | 5-8 |
| HUCR9D | Babile | – | _ | + | + | + | + | – | – | – | – | – | 5.5-8 |
| HUCR9E | Babile | – | + | + | + | + | + | – | – | – | – | – | 5-8 |
| HUCR10A | Babile | – | + | + | + | + | + | – | – | – | – | – | 5-8 |
| HUCR10B | Babile | – | + | + | + | + | + | – | – | – | – | – | 5-8 |
| HUCR10C | Babile | – | _ | + | + | + | + | – | – | – | – | – | 5.5-8 |
| HUCR10D | Babile | – | + | + | + | + | + | – | – | – | – | – | 5-8 |
| HUCR10E | Babile | – | _ | + | + | + | + | – | – | – | – | – | 5.5-8 |
| HUCR12A | Babile | – | + | + | + | + | + | – | – | – | – | – | 5-10.5 |
| HUCR12B | Babile | – | + | + | + | + | + | – | – | – | – | – | 5-10.5 |
| HUCR12C | Babile | – | + | + | + | + | + | – | – | – | – | – | 5-10.5 |
| HUCR12D | Babile | – | + | + | + | + | + | – | – | – | – | – | 5-8.5 |
| HUCR12E | Babile | – | + | + | + | + | + | – | – | – | – | – | 5-10.5 |
| HUCR13A | Babile | – | _ | + | + | + | + | – | – | – | – | – | 5.5-9 |
| HUCR13B | Babile | – | + | + | + | + | + | – | – | – | – | – | 5-10.5 |
| HUCR13C | Babile | – | + | + | + | + | + | – | – | – | – | – | 5-9 |
| HUCR13D | Babile | – | + | + | + | + | + | – | – | – | – | – | 5-9 |
| HUCR13E | Babile | – | + | + | + | + | + | – | – | – | – | – | 5-10.5 |
| HUCR14A | Gursum | – | + | + | + | + | + | – | – | – | – | – | 5-10.5 |
| HUCR14B | Gursum | – | _ | + | + | + | + | – | – | – | – | – | 5.5-10.5 |
| HUCR14C | Gursum | – | + | + | + | + | + | – | — | – | – | – | 5-10.5 |
| HUCR14D | Gursum | – | + | + | + | + | + | – | – | – | – | – | 5-10.5 |
| HUCR14E | Gursum | – | + | + | + | + | + | – | – | – | – | – | 5-10.5 |
| % of tolerant isolates | 4 | 76 | 100 | 100 | 100 | 100 | 4 | 0 | 0 | 0 | 0 | ||
Key: (+) = Presence of Growth; (-) = Absence of Growth
Evaluation of the Relative Synergetic Efficacy of Wild Rhizobium under Sterilized Sand in a Pot Experiment
The inoculated plants showed significant variations (p< 0.05) in nodule number, nodule dry weight and shoot dry weight (Table 3). Each of the presumptive rhizobial isolates was authenticated in sterile pots using sterilized sand culture in a greenhouse. All the 50 rhizobial isolates in this study were able to induce nodulation on common bean (Phaseolus vulgaris L.) and were subsequently authenticated as true rhizobial isolates (Somasegaran and Hoben, 1994). Visual observation of the outward appearances of inoculated plants had also shown that they were visibly different from the negative control. The control plants (especially the negative control) appeared relatively dwarf and pale green while the inoculated plants appeared deep green with long shoots, many branches, and pink to red nodules, indicating that the latter performed better than the control in terms of atmospheric nitrogen fixation. The least quantity of nodulation was noted for the host shot with HUCR13C (28/plant) and the highest was for the plant inoculated with isolate HUCR2A (140/plant) both from Babille woreda (Table 3). Similarly, 0.04g/plant and 0.3g/plant were the smallest and highest nodule dry mass recorded for plants inoculated with isolates HUCR (5C, 6A,9B, 9E 10B) and HUCR3A, respectively (Table 3).
The highest (1.4g/plant) and the least (0.3g/plant) dry biomass accumulations were noted from host shot with HUCR3D and isolate HUCR5A, respectively( Table 3). Plants inoculated with isolates HUCR2A, HUCR3C and HUCR3D showed significantly (p<0.05) higher nodule number, nodule dry weight, and shoot dry weight than any of the other inoculated plants respectively. Correlation among variables in the sand experiment for wild rhizobia confirmed that nodule numbers were correlated positively and significantly (r = 0.4, P < 0.0001) with nodule dry weight (Appendix Table 2). Regarding the relative symbiotic effectiveness 46%, 52%, and 2% of the isolates were highly effective, effective, and ineffective respectively (Table 4). Considering the site of location, all isolates from Gursum, 61% of the isolates from Babille, and 17% of the isolates from Fedis woreda were highly effective (Table 4). Four per cent of the isolates from Fedis and 96% of the isolates from Babille woreda became effective.
The highest scores of effectiveness of symbiotic nitrogen fixation were displayed by HUCR (3D,3A,2D,2C,3C,14D,14C,6B,7B,9C,13A,13B,14A,14E,2A,6C,13C,2B,2E,3E,7C,13D,14B) shoot dry mass >0.8g/plant (Table 4). Isolate HUCR5A from Babille soil was obtained to be ineffective which was observed to be smaller than the ineffective equivalent of 0.414g/plant showed by negative control (Table 3). In this study, 98% of the isolates were categorized into effective and very effective groups (Table 3).
Table 3: Soil sampling localities, Isolates colour on growth media, symbiotic effectiveness of common bean (Phaseolus vulgaris L.) rhizobial isolates and their ability to produce root nodules on sterilized sand culture.
| Treatments | Soil sampling localities | Growth on YEMA-BTB | Nodule No/ plant |
Nodule dry weight/plant(gm) | Shoot dry weight/plant(gm) | SE (%) | E |
| HUCR2A | Babile | Moderate Yellow | 140±17a | 0.18± 0.02c | 0.9± 0.04el | 94 | HE |
| HUCR2B | Babile | Yellow | 62± 19gm | 0.09±0.01eg | 0.8±0.010ho | 83 | HE |
| HUCR2C | Babile | Yellow | 61±22hm | 0.19±0.01c | 1.2±0.580cd | 125 | HE |
| HUCR2D | Babile | Yellow | 102±20b | 0.24± 0.02b | 1.3±0.230b | 136 | HE |
| HUCR2E | Babile | Yellow | 69±15dk | 0.18±0.01c | 0.8±0.001g-n | 83 | HE |
| HUCR3A | Fedis | Yellow | 82±18.6cf | 0.3±0.010b | 1.3±0.002c | 136 | HE |
| HUCR3B | Fedis | Yellow | 36±1ps | 0.2± 0.001d | 0.7±0.001lq | 73 | E |
| HUCR3C | Fedis | Deep yellow | 86±13.1bd | 0.2± 0.010a | 1.2±0.002b | 125 | HE |
| HUCR3D | Fedis | Deep yellow | 56±12.9io | 0.09±0.002eg | 1.4±0.001a | 158 | HE |
| HUCR3E | Fedis | Deep yellow | 39±11.9os | 0.05± 0.002nq | 0.8±0.001hn | 83 | HE |
| HUCR5A | Babile | Yellow | 64±10.6fm | 0.05±0.001nq | 0.3±0.001t | 31 | I |
| HUCR5B | Babile | Yellow | 69±15dk | 0.14±0.003d | 0.5±0.001qt | 52 | E |
| HUCR5C | Babile | Yellow | 85±11.1be | 0.04± 0.003pq | 0.6±0.001os | 63 | E |
| HUCR5D | Babile | Yellow | 43±13.1ns | 0.05±0.001mq | 0.7±0.001jq | 73 | E |
| HUCR5E | Babile | Yellow | 68±17.6dk | 0.14±0.001d | 0.6±0.001pt | 63 | E |
| HUCR6A | Babile | Yellow | 70±16.6dk | 0.04±0.003pq | 0.7±0.003mr | 73 | E |
| HUCR6B | Babile | Yellow | 103±12.5b | 0.05±0.002mq | 1.0±0.002di | 104 | HE |
| HUCR6C | Babile | Yellow | 77±13.5ch | 0.05±0.001nq | 0.9±0.001fm | 94 | HE |
| HUCR6D | Babile | Yellow | 35±7.2ps | 0.06±0.001lq | 0.6±0.002pt | 63 | E |
| HUCR6E | Babile | Deep yellow | 69±8.4dk | 0.05± 0.001oq | 0.7±0.100kq | 73 | E |
| HUCR7A | Babile | Deep yellow | 61±12.3hm | 0.06±0.001oq | 0.7±0.001mr | 73 | E |
| HUCR7B | Babile | Deep yellow | 90±35.4bc | 0.05±0.001pq | 1.0±0.001dj | 104 | HE |
| HUCR7C | Babile | Deep yellow | 93±20.5bc | 0.06±0.002lq | 0.8±0.001fn | 83 | HE |
| HUCR7D | Babile | Deep yellow | 66±15.6fl | 0.06±0.002lq | 0.6±0.001os | 63 | E |
| HUCR7E | Babile | Deep yellow | 67±13.5el | 0.05± 0.001oq | 0.5±0.001rf | 52 | E |
| HUCR9A | Babile | Deep yellow | 65±2.7fm | 0.06±0.001kq | 0.6±0.001os | 63 | E |
| HUCR9B | Babile | Moderate yellow | 71±3.1dj | 0.04±0.001pq | 0.8±1.000ip | 83 | E |
| HUCR9C | Babile | Moderate yellow | 63±2.7gm | 0.05±0.001pq | 1.0±1.000dg | 104 | HE |
| HUCR9D | Babile | Deep yellow | 61± 3.2gn | 0.07±0.001in | 0.6±0.003ns | 63 | E |
| HUCR9E | Babile | Deep yellow | 78±4ch | 0.04±0.001pq | 0.7±0.001kq | 73 | E |
| HUCR10A | Babile | Deep yellow | 61±3.2gn | 0.08±0.002fj | 0.6±0.001ns | 63 | E |
| HUCR10B | Babile | Deep yellow | 53±3.1jp | 0.04±0.001q | 0.6±0.001os | 63 | E |
| HUCR10C | Babile | Deep yellow | 52±2.1kp | 0.07±0.002gl | 0.6±0.001os | 63 | E |
| HUCR10D | Babile | Deep yellow | 63±2.5gm | 0.06±0.002jp | 0.6±0.001ps | 63 | E |
| HUCR10E | Babile | Deep yellow | 51±6.5kp | 0.05±0.001mq | 0.7±0.003mr | 73 | E |
| HUCR12A | Babile | Deep yellow | 49±2lr | 0.09±0.002eh | 0.6±0.001pt | 63 | E |
| HUCR12B | Babile | Deep yellow | 74±1ci | 0.07±0.002hm | 0.8±0.001iq | 83 | E |
| HUCR12C | Babile | Deep yellow | 80±1cg | 0.05±0.001pq | 0.7±0.002kq | 73 | E |
| HUCR12D | Babile | Deep yellow | 56±3.6io | 0.05±0.002mq | 0.8±0.002jo | 83 | E |
| HUCR12E | Babile | Deep yellow | 51±3kq | 0.1±0.0100l | 0.7±0.002mr | 73 | E |
| HUCR13A | Babile | yellow | 52±17.2kp | 0.18±0.060c | 1±0.0010kq | 104 | HE |
| HUCR13B | Babile | Yellow | 56±5.1io | 0.1±0.001eg | 1±0.0020jq | 104 | HE |
| HUCR13C | Babile | Yellow | 28± 2s | 0.1±0.002li | 0.9±0.002go | 94 | HE |
| HUCR13D | Babile | Deep yellow | 54±3.5jp | 0.1±0.001mq | 0.8±0.001jq | 83 | HE |
| HUCR13E | Babile | Deep yellow | 55±3jo | 0.1±0.002fj | 0.7±0.001kq | 73 | E |
| HUCR14A | Gursum | Deep yellow | 70±6.7dk | 0.1±0.100fk | 1.0±0.001dj | 104 | HE |
| HUCR14B | Gursum | Deep yellow | 32±3.2qs | 0.1±0.002ei | 0.8±0.001ho | 83 | HE |
| HUCR14C | Gursum | Deep yellow | 36±2.1qs | 0.05±0.001mq | 1.1±0.002ce | 114 | HE |
| HUCR14D | Gursum | Deep yellow | 31± 2.1rs | 0.07±0.002jn | 1.2±0.001cd | 125 | HE |
| HUCR14E | Gursum | Deep yellow | 47± 2mr | 0.10±0.002ef | 1.0±0.001dh | 104 | HE |
| Control(-) | 0t | 0r | 0.414±0.002st | 43 | |||
| Control(+) | 0t | 0r | 0.959±0.001ek | 100 | |||
| LSD(p<0.05) | 18.95 | 0.03 | 0.23 | ||||
Key: Numbers in the same column followed by the same letters are not significantly different at p<0.05(Fisher’s LSD). SE= Symbiotic, E= Effectiveness, YEMA-BTB= Yeast Extract Mannitol Agar. E= effectiveness; I= ineffective; E= Effective and HE= Highly Effective; LSD= list significant difference. % SE= >80% is highly effective, 50-80 % is effective, and < 35% is ineffective.
Table 4: Rating of the Effectiveness of Isolates by Sampling Site (Woreda)
| Sampling woredas | %HE | %E | Total | %IE | Total | HE Isolates |
E Isolates |
| Babile | 35% | 62.5 | 97.5 | 2.5 | 100 | 2D,2C,6B,7B,9C,13A,13B2A, 6C,13C,2B,2E,7C13D |
9B,12B,12D,5D,6A,6E,7A,9E,10E, 12C,12E,13E,5C,5E,6D,7D,9A,9D, 10A,10B,10C,10D,12A,7E,5B |
| Fedis | 80 | 20 | 100 | 0 | 100 | 3D,3A,3C,3E | 3B |
| Gursum | 100 | 0 | 100 | 0 | 100 | 14D,14C,14A,14E,14B | None |
Evaluation of Synergetic Efficacy of Wild Rhizobium under Unsterilized Soil in a Pot Experiment
From the sand culture, HUCR(3D,3A) from Fedis, HUCR(2D,2C) from Babille, and HUCR14D from Gursum were the five highly effective isolates selected as inoculants for Common bean plant and tested on Babille soil under greenhouse condition at Haramaya University main campus (Table 5). In all parameters except in % N, the inoculated plants showed a substantial variance (P ≤ 0.05). In this study the different rhizobial inoculants showed variation in nodule number, nodule dry weight, shoot dry weight, N %, and N contents on the inoculated common bean plants (Table 5). HUCR3A was the isolate that induced the highest nodule number (120 per plant) followed by isolates HUCR2C and HUCR2D with nodule numbers of 117 per plant and 110 per plant respectively (Table 5). The least number of nodules was induced by plants inoculated with isolates HUCR3D and HUCR14D with nodules number 52 per plant and 99 per plant correspondingly (Table 5). All isolates except HUCR 3D showed significantly (p <0.05) higher nodule number than both positive and negative controls and isolate HUCR 14D showed significantly (p<0.05) higher shoot dry weight than other plants. This study, (Appendix Table 6) showed that positive correlations were observed concerning the number of nodules and dry weight of nodules (r = 0.8, p<0.0001), dry weight of shoot, and N content (r = 0.73, p<0.0001) and %N and N content in the shoot of common bean (r = 0.43, p<0.04). Comparing the nodule number of the controls with the inoculated plants, the least nodule number for the inoculated plant (52 per plant) was greater than the nodule number of positive control by 85% and the nodule number of negative control by 42% (Table 5).
HUCR14D was the isolate that induced the highest dry biomass weight 2.2 g/plant followed by isolates HUCR3A and HUCR2D with a dry biomass weight of 1.3 and 1.1 g/plant in that order. The least dry biomass weight was 0.5 g/plant induced by isolate HUCR3D (Table 5). The recorded maximums dry biomass weight 2.2 g/plant of this study on Babille soil is greater than the dry biomass weight of the positive and negative control by 23% and 77%, correspondingly (Table 5). Concerning % N, 2.5% N/gm for a plant inoculated with isolate HUCR3D and 2.1% N/gm for a plant inoculated with isolate HUCR14D were the highest and the lowest record for this study. Here the % N of the negative control decreased from the lowest value % N of this study by 24% (Table 5).
Table 5: Nodulation Data of selected Effective Wild Isolates of Common Bean Rhizobia with Gofta (G-2816) Variety on Babile Soil.
| Isolates | Nodule No/plant | Nodule dry weight/plant(gm) | Shoot dry weight/plant(gm) | Nitrogen (%) |
N Content (g/pl) |
| HUCR 3D | 52±2b | 0.18±0.01bc | 0.5±0.001d | 2.5±1a | 0.02±0.003cd |
| HUCR 3A | 120±10a | 0.23±0.05a | 1.3±0.6bc | 2.3±0.05a | 0.03±0.01a,b |
| HUCR 2D | 110±35a | 0.21±0.02a | 1.1±0.001c | 2.4±0.1a | 0.03±0.00b |
| HUCR 2C | 117±18a | 0.2±0.00ab | 0.9±0.001c | 2.2±0.14a,b | 0.02±0.00c |
| HUCR14D | 99±1a | 0.16±0.04c | 2.2±0.001a | 2.1±0.01a,b | 0.03±0.01b |
| Control(-) | 30±1b,c | 0.08±0.001d | 0.5±0.01d | 1.6±0.01b | 0.01±0.00d |
| Control(+) | 8±1c | 0.05±0.01d | 1.7±0.3b | 2.5±0.01a | 0.04±0.00a |
| LSD(p<0.05) | 26.7 | 0.04 | 0.42 | 0.67 | 0.01 |
Key: Levels connected by same letter are not significantly different (p<0.05).
Isolation of Mutant Rhizobium Cells
Among the 50 presumptively tested and authenticated wild rhizobial isolates following the physical and chemical mutagenesis, a total of 65 survivors (22 from sodium azid, 24 from Hydroxylamine hydrochloride, and 19 from UV) were isolated at Haramaya University Microbiology laboratory and Plant Science Pathology Laboratory (Appendix 9). Out of these, only 8 of the survivors have been selected as mutants for further studies based on their ability to survive extreme conditions such as high salt concentrations, pH, and temperature. Isolates HUCRM (2D, 5C, 7D, 9A, 9C, 12E) were mutants that developed from chemical mutagenesis. Among these, chemically induced mutant isolates HUCRM (2D, 9C, 5C) and HUCR (7D, 9A, 12E) were induced through the effects of mutagenic chemicals sodium azide and hydroxylamine hydrochloride, respectively. HUCRM 3B and HUCRM 14A were the additional mutants obtained through physical mutagenesis. All chemically induced rhizobium mutants were isolated from Babille soils while the UV-induced mutants were from both Fedis and Gursum, respectively.
Physiological Characterization of Rhizobium Mutant’ Based on Salt and pH Tolerance
As Table 6 depicts it is possible to observe how many of the mutant rhizobium were tolerant to different sodium chloride concentrations on TY agar medium. 87.5% of the mutant isolates were successful to grow on a TY agar medium containing 11% NaCl, similarly, 36% and 0% of the isolates were tolerant to the same medium containing 12% and 14% of NaCl concentration. Mutant isolates like HUCRM (2D, 5C, 3B) were the most tolerant rhizobium that grew on the entire medium containing different NaCl concentrations except at 14% of NaCl. Relatively the most sensitive mutant isolate was HUCR 7 D, which showed no growth on any of the NaCl concentration. Isolates HUCRM (9A, 9C, 12E, 14A) were the next other sensitive mutant rhizobia that grew only at 11% of NaCl concentration on TY agar medium. Comparing to the wild rhizobium isolates the mutant isolates were observed to be by far tolerant to a medium containing a higher concentration of NaCl as high as 11% to 12% of NaCl concentration Table 1 and 6). At the same time when the highest salt-tolerant wild isolates (for example HUCR9A tolerated 10% NaCl on YEMA medium) compared with its mutant derivatives, the wild isolate was very sensitive for a higher percent of NaCl.
In this study, 0 %, 38 %, 50 %, 25 %, 13 % of the isolates were tolerated at pH of 3.5, 4, 11, 11.5, and 12 on sterile TY agar media (Table 6). Isolate HUCRM2D were tolerated all the provided pH except at pH 3.5 and HUCRM14A was the second most tolerant isolate that tolerated all the given pH except at pH 3.5 and 12 (Table 6). The most sensitive mutant isolate that tolerated narrow ranges of pH conditions was HUCRM9C and HUCRM5C all of them were isolated from wild rhizobium isolates of Babille soil. Mutant isolates HUCRM (7D, 9A, 12E, and 3B) were not tolerated in any of the given pH conditions. Here compared to the wild rhizobial isolates mutant rhizobium were observed to tolerate both the upper and lower extreme pH conditions (<4.5 and > 10.5); for example, there was no wild rhizobial isolate tolerant for pH 4, 11, 11.5, and 12 except the observed mutants. Likewise comparing the wild-type rhizobial isolates, their mutant derivatives showed comparatively superiority intolerance for both extreme pH conditions. In compliance with this, Chen et al., (1993) testified that certain mutants of R. leguminosarum have been reported to be able to grow at a pH ≤ 4.5,
Table 6: Salt and pH Tolerance of Rhizobium Mutant Isolates.
| Treatment | Localities | Salt tolerance (%) | pH range | ||||||
| 11 | 12 | 14 | 3.5 | 4 | 11 | 11.5 | 12 | ||
| HUCRM2D | Babile | + | + | – | – | + | + | + | + |
| HUCRM5C | Babile | + | + | – | – | + | + | – | – |
| HUCRM7D | Babile | – | – | – | – | – | + | – | – |
| HUCRM9A | Babile | + | – | – | – | – | – | – | – |
| HUCRM9C | Babile | + | – | – | – | – | – | – | – |
| HUCRM12E | Babile | + | – | – | – | – | – | – | – |
| HUCRM3B | Babile | + | + | – | – | – | – | – | – |
| HUCRM14A | Gursum | + | – | – | – | + | + | + | + |
| % of tolerated mutant isolates | 87.5 | 36 | 0 | 0 | 38 | 50 | 25 | 13 | |
Key: – HUCRM= Haramaya University common bean rhizobium mutant.
Evaluation of Relative Symbiotic Effectiveness of Common Bean Rhizobium Mutant Isolates under Sterilized Sand in Pouch Experiment
All of the mutant isolates were tested for their nodulation and relative symbiotic effectiveness on common bean Gofta (G-2816) variety in the sterile pouch using sterilized sand culture, and they were efficient in nodulation and symbiotic effectiveness. Inoculated common bean showed significant (p< 0.05) increase in all parameters investigated in this study as compared with the un-inoculated negative control (Table 7). The control plant appeared relatively shorter, less dark green than the inoculated individuals. These indicate that the inoculated plants fixed atmospheric nitrogen well. In this study, the smallest nodule number record was 68 per plant for a plant inoculated with mutant isolates HUCRM12E and HUCRM14A (Table 7).
The highest nodules number record were 131 and 111 per plant for plants inoculated with isolates HUCRM2D and HUCRM5C, correspondingly (Table 7). Likewise, in nodule dry mass 0.08g/plant was the smallest and 0.21g/plant was the highest record for plants inoculated with isolates HUCRM (9C,12E) and HUCRM2D, respectively Table 7). The highest shoot dry matter accumulations 1.4 g/plant were recorded from the plant inoculated with isolates HUCRM2D from Babille soil and the least 0.7g/plant were recorded from the plant inoculated with isolates HUCRM3B and HUCRM9C from Fedis and Babille soil respectively (Table 7). Furthermore, in this study, all isolates resulted in accumulation of shoot dry matter higher than the positive control (N+). Plants inoculated with isolate HUCRM2D showed significantly (p<0.05) higher nodule number, nodule dry weight, and shoot dry weight than any of the other plants Table7). The superiority of isolate HUCRM2D could more likely be due to the contribution of Rhizobium species in increasing the biomass through plant growth-promoting hormone production such as auxins and indole acetic acid beyond N fixation (Zafar-ul-Hye et al., 2007).
Correlation response among variables in the sand experiment for mutant rhizobia confirmed that nodule numbers were related positively and significantly (r = 0.85, P < 0.0001) with nodule dry weight (Table 7). Concerning the relative symbiotic effectiveness, 100% of the isolates were found to be highly effective (Table 7). Comparing to the plants inoculated with wild isolates on sand culture, the plants inoculated with mutants got higher means in nodulation quantity, nodule dry weight, and biomass dry weight (Table 7). The means of inoculated plants with mutants in in nodulation quantity, nodule dry weight, biomass dry weight were greater than the respective means of inoculated plants with the wild isolates by 13%, 27%, and 0.5%, correspondingly (Table 7).
Table 7: Nodulation Data of Rhizobium Mutants on Sterilized Sand.
| Treatment | Nodule number | Nodule dry weight | Shoot dry weight | SE (%) | Effectiveness |
| HUCRM2D | 131±11a | 0.21±0.04a | 1.4±0.4a | 233 | HE |
| HUCRM5C | 111±11b | 0.2±0.00a | 1.2±0.1b | 200 | HE |
| HUCRM7D | 86±31c | 0.2±0.01a | 1.2±0.1b | 200 | HE |
| HUCRM9A | 85±1c | 0.2±0.01a | 0.8±0.1c | 133 | HE |
| HUCRM9C | 74±1c | 0.08±0.00b,c | 0.7±0.0c | 117 | HE |
| HUCRM12E | 68±1c | 0.08±0.00b | 0.8±0.0c | 133 | HE |
| HUCRM3B | 77±1c | 0.1±0.00b | 0.7±0.0c | 117 | HE |
| HUCRM14A | 68±1c | 0.1±0.00c | 0.8±0.0c | 133 | HE |
| Control- | 0d | 0d | 0.3±0.0d | ||
| Control+ | 0d | 0d | 0.6±0.0c | ||
| LSD(p<0.05) | 18.328 | 0.0275 | 0.2469 |
Key: – Numbers in the same column followed by the same letters are not significantly different at p<0.05(Fisher’s LSD). SE= Symbiotic effectiveness; E= Effective and HE= Highly Effective. LSD= list significant difference. % SE= >80 % is highly effective; 50-80 % is effective.
Evaluation of Synergetic Efficacy of Common Bean Rhizobium Mutant Isolates under Unsterilized Soil in Pouch Experiment
Six highly effective isolates HUCRM2D, HUCRM5C, HUCRM7D, HUCRM9A, HUCRM12E, and HUCRM14A from the sand culture were selected as inoculants for common bean and tested on Babille soil under growth chamber (Table 8). The data showed that the different rhizobial inoculants displayed variation in nodule number, nodule dry weight, shoot dry weight, plant total nitrogen, and N content of the inoculated common bean plants (Table 8). Isolates HUCRM (2D, 5C, 7D) showed significantly (p<0.05) higher N content than other plants. Isolate HUCRM2D induced the highest nodule number of 136 per plant followed by isolate HUCRM12E, HUCRM5C, and HUCRM9A with nodule number of 121 per plant, 106 per, and 100 per plant, respectively(Table 8). The lower nodule number was induced by plants inoculated with HUCRM14A with 95 nodules per plant (Table 8). The highest nodule dry weight of 0.2g per plant was induced by isolate HUCRM2D. On the other hand, the lowest nodule dry weight of 0.15g per plant was recorded by plants inoculated with isolates HUCRM7D and HUCRM14A (Table 8).
This study (Appendix Table 8) showed that positive correlations were observed concerning the number of nodules and dry weight of nodules (r = 0.73, p<0.0001), dry weight of shoot and %N (r = 0.8, p<0.0001), dry weight of shoot and N content (r = 0.9, p<0.0001). In addition to nodule number and nodule dry weight, it was also observed that the dry weight of the shoot was influenced by inoculation of isolates (Table 8). The highest dry weight of shoot 3.4g per plant was recorded with isolate HUCRM7D, which was 46% and 54% higher than the records in shoot dry weight of positive and negative controls, respectively (Table8). On the other hand, the lowest dry weight of shoot 1.6g per plant was recorded with a plant inoculate isolate HUCRM12E.
In comparison generally, shoot dry matter was found to be higher in soil cultures by 61% than the sand culture of tested isolates. Comparing the means of the inoculated plants with mutant isolates over that of plants inoculated with the wilds isolates, except in %N in all other parameters (nodulation quantity, nodule dry weight, biomass dry weight, and N content) the plants inoculated with mutants showed 26%, 6.6%, 47%, and 50% higher means than the plants inoculated with wild types in nodule number, nodule dry mass, shoot dry mass and N content, respectively. But the plants inoculated with the mutant isolates showed similarity in % N with the plants inoculated with wild isolates.
Table 8: The Effect of Rhizobial Infection on the Performance Common of Bean Plants.
| Treatment | Nodule number |
Nodule dry weight | Shoot dry weight | Plant total nitrogen (%) | N Content (g/pl) |
| HUCRM2D | 136±39a | 0.2±0.01a | 3±0.5a | 2.7±0.6a | 0.08±0.01a |
| HUCRM5C | 106±20b,c | 0.17±0.04a-c | 2.9±0.6a-c | 2.4±0.6a-c | 0.07±0.02a |
| HUCRM7D | 99±21b,c | 0.15±0.1c | 3.4±0.6c | 2.6±0.6a,b | 0.09±0.02a |
| HUCRM9A | 100±1b,c | 0.16±0.00b,c | 1.9±0.01b,c | 2±0.01c,d | 0.04±0.00b |
| HUCRM12E | 121±1a,b | 0.19±0.02a,b | 1.6±0.01a,b | 2.3±0.1a-c | 0.04±0.00b,c |
| HUCRM14A | 95±1b,c | 0.15±0.00b,c | 1.9±0.01b,c | 2.1±0.1b-d | 0.04±0.00b |
| Control- | 91±1c | 0.15±0.00c | 1.6±0.01c | 1.6±d0.01d | 0.02±0.00c |
| Control+ | 77±1c | 0.17±0.00a-c | 1.9±0.01a-c | 2.4±0a-c.01a-c | 0.03±0.01b,c |
| LSD(p<0.05) | 29.41 | 0.04 | 0.59 | 0.61 | 0.02 |
Key: – Numbers in the same column followed by the same letters are not significantly different at p<0.05(Fisher’s LSD).
Discussion
In this study 50 isolates were found and all of them authenticated as common bean nodulating bacteria. This indicates that soil of this region of the country is rich in effective rhizobial isolates. In line with this, Wortmann et al. (1998), Alemayuhu Workalemahu (2006), and Anteneh Argaw (2007) indicated that all collected rhizobia from common bean nodules were authenticated as root nodule bacteria. Alemayuhu Workalemahu (2006) and Anteneh Argaw (2007) also confirmed the existence of native bean-nodulating rhizobia in Ethiopian soils. Isolates HUCR9A and HUCR7B from Babille were grown at 6% NaCl concentration, a little bit higher than the maximum tolerance range known before; 3-5%. This result is a good indicator for the presence of halo- tolerant wild common bean rhizobia in soil of these areas. In the same way, Hungria and Vargas (2000) reported that usually, fast-growing rhizobia grew well between 3-5 % concentrations of NaCl. It is obvious that Rhizobium phaseoli are amongst the salt-tolerant rhizobia and several isolates have been reported to tolerate high salt concentrations between 4%-5%. Likewise, two isolates of common beans from southern Ethiopia tolerated a higher concentration of salt as reported by Alemayehu Workalemahu (2006).
Even though, tolerance to pH changes varied amongst the tested isolates growth was detected from pH 4.5-8.5. Though, fast growing rhizobia are sensitive for lower pH, isolates from Babile; HUCR (2C, 5C) not only managed to grow on all the tested pH values but also they were successfully appeared at a lower pH. This means soil of this locality is rich in promising tolerant common bean rhizobia that may be used for making future commercial inoculants after testing them in different agro ecologies. Similarly, Bordeleau and Prevost (1994) showed that fast-growing rhizobia are commonly susceptible to low pH but grow best nearly at neutral to basic pH. In line with this, Alemayehu Workalemau (2006), and Anteneh Argaw (2007), and other similar domestic researchers revealed that acid-producing rhizobia are poor intolerance to low soil pH conditions.
All the 50 rhizobial isolates in this study were able to induce nodulation on common bean (Phaseolus vulgaris L.) and were subsequently authenticated as true rhizobial isolates (Vincent, 1970). In line with this, Rahmani et al. (2011), Esubalew Sintie,(2011), and Kassa Baye,(2011) on common bean, lupine and field pea reported that all their rhizobial isolates were successful in nodulating their host plants. All results of the above studies disclose that Ethiopian soil is rich in symbiotically potential rhizobia that might productivity of bens in the country. According to Somasegaran and Hoben (1994), Lupwayi and Haque (1994), and Peoples and Craswell(1992) shoot dry matter is a good indicator of the relative symbiotic effectiveness of the isolates and a positive correlation between the nitrogen-fixing capacity of legumes and their shoot dry matter accumulation than nodule dry weight and nodule number. Therefore, the relative high shoot dry matter accumulation record of this study (1.4g/plant) by isolate HUCR3D on sand culture ensures the presence and performance of indigenous common bean rhizobia in soil of eastern Ethiopians low lands and mid altitudes. In a similar work, Alemayuhu Workalemahu, (2006), Anteneh Argaw, (2007) reported that more effective isolates were obtained from a wide range of geographical locations and pH ranges of south and east Ethiopia soils respectively. Hopefully, this is an indication of the survival and abundance of more effective soil rhizobia in Ethiopia.
The recorded maximums biomass dry weight (2.2 g/plant) of this study on Babille soil is greater than the biomass dry weight of the positive and negative control by (23% and 77%), correspondingly. Concerning % N, (2.5% N/gm) for a plant inoculated with isolate HUCR3D was the highest record for this study. Here the % N of the negative control (1.6%) decreased from the lowest value % N of this study by 24%. This means the isolate is more competent in N accumulation than the native rhizobia in the soil, which means this ability of N accumulation of HUCR3D is a pointer for the existence of potential rhizobia in the soil of vicinity’s of lowlands and mid altitude of eastern Ethiopia.
Among the 50 presumptively tested and authenticated wild rhizobial isolates only 8 mutants were induced based on their ability to survive on extreme conditions such as 11% and 12% of NaCl concentrations and 4-13 pH. The above results is a pointer how mutagenesis can enhance tolerance of rhizobia to extreme salt and pH condition. In line with this result, Abdel Hamid et al., (2011) reported that rhizobial mutants that are induced through Ethyl methane sulphonate were tolerated 12% NaCl concentration. Opposite to this, Tejera et al., (2005) testified that the mutant derivatives for the wild halo-tolerant Rhizobium tropici strain CIAT899 showed decreasing in salt-tolerance. Similarly, Fujihara and Yoneyama, (1993) reported that Sinorhizobium Fedis F (acid producing rhizobia that form nitrogen-fixing nodules on soybean roots) can grow well between pH 4 – 9.5. Zahran, (2001) also said that high pH can prevent Rhizobium from growing and undergoing nodulation, although R. leguminosarum bv. trifolii has been reported to colonies soil at a higher rate and produce nodules at a higher frequency in alkaline conditions; it is also known to grow unaffected at pH 11.5. These results are believed to be promising information for farmers to grow legumes, particularly under extreme pH conditions to make better the yield of the legume. Besides these mutant isolates may be the future promising rhizobial strains to be used as bio inoculants.
All the mutants were efficient in nodulation and symbiotic effectiveness on sterilized and unsterilized soil conditions. Furthermore, in this study on sterilized and unsterilized soil conditions, all isolates resulted in accumulation of shoot dry matter higher than the positive control (N+). This means mutant isolates will be one of the future hops in making commercial inoculants that may increase common bean productivity by reducing cost invested on inorganic fertilizers. Plants inoculated with isolate HUCRM2D showed significantly (p<0.05) higher nodule number, nodule dry weight, and shoot dry weight than any of the other plants. The superiority of isolate HUCRM2D could more likely be due to the contribution of Rhizobium species in increasing the biomass through plant growth-promoting hormone production such as auxins and indole acetic acid beyond N fixation (Zafar-ul-Hye et al., 2007). Concerning the relative symbiotic effectiveness, 100% of the isolates were found to be highly effective. This may show us the existence and abundance of indigenous wild rhizobium around Babile area which can be induced chemically and become effective in nodulation and biological nitrogen fixation of legumes.
The means of inoculated plants with mutants in nodulation quantity, nodule dry weight, biomass dry weight were greater than the respective means of inoculated plants with the wild isolates by 13%, 27%, and 0.5% on sand culture, correspondingly. This means in addition to selecting efficient wild rhizobia as usual, mutagenesis can be another alternative to access better efficient rhizobia. In line with this, Ragchaudhuri et al., (2005) reported that the chickpea (Cicer arietinum) inoculated with N-methyl-N-nitro-N-nitrosoganidine induced mutant isolates produced higher nodules number, nodule dry weight, and shoot dry weight than the chickpea inoculated with wild rhizobia. Similarly, Williams et al., (1827) reported that plants shot with efficient mutant (M3) nodulated earlier, produced more nodules (58%), and had increased dry weights (26%) than plants inoculated with the wild type. In the evaluation of the effectiveness of the wild isolates with that of their mutant derivatives, the mutant isolates were highly effective (HE). Similarly, Shashi et al., (1997) reported that in comparison to the parent strain, Azide-resistant (AzR) mutants exhibited either similar or higher symbiotic effectiveness. Comparing the means of the inoculated plants with mutant isolates over that of plants inoculated with the wilds isolates on unsterilized soil condition, except in %N in all other parameters the plants inoculated with mutants showed 26%, 6.6%, 47%, and 50% higher means than the plants inoculated with wild types. In line with this, Ragchaudhuri et al., (2005) reported that in the non-sterile soil, plants inoculated with mutant isolates (N15) strain consistently produce almost 35% more nodules of larger biomass and 25% or more increased dry shoot weight than plants inoculated with the wild strain (BICC651). Based on the above mentioned results mutants were fairly active than the wild isolates in competing with other native rhizobia in the soil for infectivity, nodule occupancy, and nodulation of the host.
Conclusion
Overall 50 wild and 8 mutant rhizobial isolates were induced from soils collected around east Hararghae lowlands and mid altitudes. All the isolates induced nodulation and proved to be true root noduleting bacteria. Among the inoculated plants, common beans inoculated with wild isolate HUCR2A and mutant HUCRM2D produced the maximum nodule number 140 and 131 per plant, respectively. The highest dry weight of shoots was recorded for plants inoculated with wild isolate HUCR3D and mutant isolateHUCRM7D (1.4 g and 3.4g per plant), respectively. Isolates were very sensitive to concentrations of NaCl beyond 8% and 12% for wild and mutant isolates, correspondingly. Effectiveness rating results also showed that 23(46%) and 26(52%) of the isolates were found to be effective and highly effective, correspondingly. The above-mentioned results made known the abundance and existence of effective common bean rhizobial isolates in eastern Hararghae lowlands and mid-altitude. At the same time the result also assured the chance of having effective common bean rhizobial mutant isolates through chemical and physical mutagenesis.
Funding Source
The author(s) received no financial support for the publication of this article.
Conflict of Interest
No conflict of interest.
References
- Abdel H., Nivien A.A., Effat A.M.S. Enhancement of some Egyptian clover nodulating Rhizobium bacteria tolerance to high salinity using ethyl methanesulphonate. International journal of academic research.2011; Vol. 3. No.5.
- Alemayehu Workalemahu 2006. Symbiotic and phenotypic characterization of Common bean nodulating rhizobia from some area of southern Ethiopia. M. Sc. (Biology) thesis submitted to Addis Ababa University, Ethiopia: 2006.
- Anteneh A. Symbiotic and Phenotypic Characterization of Rhizobia Nodulating Common Bean (Phaseolus vulgaris L.) from Eastern Ethiopia. An M.Sc Thesis Presented to the School of Graduate Studies of Addis Ababa University. 2007; Pp.20-22.
- Beck D.P., Materon L.A and Afandi F. 1993. Practical Rhizobium-legume technology manual, Technical Manual.1993; No: 19. ICARDA, Aleppo, Syria.
- Bernal G and Graham P.H. Diversity in the rhizobia associated with Phaseolus vulgaris L. in Ecuador, and comparisons with Mexican bean rhizobia. Can. J. Microbiol. 2001; 47:526-534.
CrossRef - Bordeleau L.M and Prevost D. Nodulation and nitrogen fixation in extreme environments. 1994; Plant Soil 161:115-124.
CrossRef - Broughton W.J and Deakin W.J.“Beans (Phaseolus Spp.) Model food legumes”, Plant and Soil. 2003; 185:2975-2979.
- Caldas D.G.G, Konzen E.R, Recchia G.h, Pereira A.C.V.Z and Tsai S.M. Functional Genomics of Biotic and Abiotic Stresses in Phaseolus vulgaris. 2016.DOI: 10.5772/62051.
CrossRef - Chen H., Richardson A. E and Rolfe B. G. Studies of the Physiology and Genetic Basis of Acid Tolerance in Rhizobium leguminosarum biovar trifolii. Applied and Environmental Microbiology.1993; 59. 1798 – 1804.
CrossRef - The federal democratic republic of Ethiopia central statistical agency agricultural sample survey.2019/20
- Correa O.S and J.Barneix . Cellular mechanisms of pH tolerance in Rhizobium loti. World J. Microbiol Biotechnol. 1997;13:153-157.
CrossRef - Dagnew K. Haileselassie T. Feyissa T. Genetic diversity study of common bean (Phaseolus vulgaris L.) germplasm from Ethiopia using inter simple sequence repeat (ISSR) markers. Afr J Biotechnol.2014; 13(36):3638–3649.
CrossRef - Esubalew S. The symbiotic effectiveness of Lupin (Lupinus albus L.)- Noudulating Rhizobia from Western Gojam, Amhara Regional State, Ethiopia May 2010, MSc Thesis, Haramaya University.
- FAO “Phaseolus bean: Post-harvest operations”, INPhO Post-Harvest Compendium, Food and Agriculture Organization, Rome.1999. www.fao.org/3/a-av015e.pdf.
- Food and Agriculture Organization at www.fao.org, 2010.
- FAO . Food and Agriculture Organization of the United Nations Rome,2019.
- Fujihara and Yoneyama. Effects of pH and Osmotic Stress on Cellular Polyamine Contents in the Soybean Rhizobia fredii P220 and Bradyrhizobium japonicum A1017. Applied and Environmental Microbiology. 1993;59. 1104 – 1109.
CrossRef - Giller K.E. Nitrogen Fixation in Tropical Cropping Systems. Cabi publishers, 2010; Uk2:1969-1970.
- Glenn R and Dilworth. The Life of Root Nodule Bacteria in the Acidic Underground. FEMS Microbiology Letters. 1994;123. 1 – 10.
CrossRef - Graham P.H and Vance C.P., “Legumes: Importance and constraints to greater use”, Plant Physiology, 2003;Vol. 131, No. 3, pp. 872-877, http://dx.doi.org/10.1104/pp.017004.
CrossRef - Gupta K.P Soil Plant, and Water and Fertilizer Analysis.AGROBIOS (India).2000; PP.234-245.
- Hungaria M and Vergas M.A.T. Environmental factors affecting N2 fixation in grain legumes in tropics, with an emphasis on Brazil. Field crops research. 2000;65: 151-164.
CrossRef - Kassa B. Characterization and Symbiotic effectiveness of Field pea (Pisum sativum L.) Rhizobial isolates from eastern and western Hararghae highlands, Ethiopia. A thesis submitted to the department of biology, school of graduate studies Haramaya University in Partial Fulfillment of the Requirements for the Degree of Master of Science in biology (microbiology),2011.
- Kumarasinghe K. K. S., Kirda C., Mohamed A. R. A. G., Zapata, F and S. K.A Danso. 13C isotope discrimination correlates with biological nitrogen fixation in soybean (Glycine max (L.) Merrill). 2016; Plant Soil 139, 145–147. doi: 10.5772/62051.
CrossRef - Lupwayi and Haque. Legume-Rhizobium Technology Manual. Environmental Sciences Division International Livestock Centre for Africa. Addis Ababa, Ethiopia,1994; pp.1-93.
- Martínez-Roméro E. Diversity of Rhizobium-Phaseolus vulgaris symbiosis: overview and perspectives. Plant Soil 252, 11–23. doi: 10.1023/A:1024199013926, 2003.
CrossRef - Negash R. Determinants of adoption of improved haricot bean production package in Alaba special woreda, southern Ethiopia. MSc. Thesis, Haramaya University, 2007.
- O’Connell K.P. A. Handelsman. Exopolysaccharide- deficient mutants of Rhizobium sp. Strain CIAT899 induce chlorosis in the common bean {Phaseolus vulgaris). Mol Plant-Microbe Interactions,1990; 3: 424-428.
CrossRef - Peoples M.B., Herridge D.F and Ladha J.K. “The potential environmental benefits and risks derived from legumes in rotations,” in Nitrogen fixation in crop production. Eds. D. W. Emerich and H. B. Krishnah (Madison, USA: ASA, CSSA, SSSA). 2009; 349–385.
CrossRef - Rahmani H.A., Räsänen L.A., Afsharia M., Lindströmb K . Genetic diversity and symbiotic effectiveness of rhizobia isolated from root nodules of Phaseolus vulgaris L. grown in soils of Iran. Applied Soil Ecology.2011;48:287-293.
CrossRef - Raychaudhuri N. Das and Chakrabartty. Symbiotic effectiveness of a siderophore Overproducing mutant of Mesorhizobium ciceri. Polish Journal of Microbiology.2005;Vol.54, No1, 37-41.
- Reinprecht Y.,Schram L., Marsolais F., Thomas H.S.,Hill B and Karl P.P. Effects of Nitrogen Application on Nitrogen Fixation in Common Bean Production.doi:10.3389/fpls.2020.01172.
CrossRef - Sahelemedihin S and Taye Bekele. Procedures for soil and plant analysis. National SoilResearch Center, Ethiopian Agricultural Research Organization, Addis Ababa, Ethiopia, 2000; P.110.
- Shashi B.S., Sakadeva and Sharma. Mutations conferring azide resistance enhance symbiotic nitrogen fixation in Rhizobium loti. Plant and Soil 189:1997; 221–229.
CrossRef - Slattery J.F., Coventry D.R and Slattery W.J. Rhizobial ecology as affected by soil environment. Australian Journal of Experimental Agriculture.2001; 41, 289-298.
CrossRef - Somasegaran and Hoben. Hand book for Rhizobia. Springer- Verlang, New York, 1994;1-138 pp.
CrossRef - Subba Rao N.S. Soil Microbiology. The fourth edition of Soil microorganisms and Plant Growth. 1999;166-228. Oxford and IBH publishing Co. PVVT.LTD, New Delhi, Kolkata.
- Tejera N.A., Campos R., Sanjuan and Lluch. Effect of Sodium Chloride on Growth, Nutrient Accumulation and Nitrogen Fixation of Common Bean Plants in Symbiosis with Isogenic Strains. Departamento de Fisiolog´ıa Vegetal, Facultad de Ciencias, Universidad de Granada, Spain, Departamento de Microbiolog´ıa del Suelo y Sistemas Simbi´oticos, Estaci´on Experimental del Zaid´ın, CSIC, Granada, Spain,2005.
CrossRef - Thomas R. J. Role of legumes in providing N for sustainable tropical pasture systems. Plant Soil. 1995;174: 103-118.
CrossRef - Williams P.M. The isolation of effective and ineffective mutants of Cowpea Rhizobium. Instituto Venezolano de Investigaciones Cientificas,Centro de Microbiologia y Biologia Celular, Aptdo.1827,Caracas,Venezuela.
- Wortmann C.S., Kirby R.A., Eledu C.A and Allen D.J. Atlas of common bean production in Africa, CIAT publication.1998; No. 297.
- Zafar-Hye M, Zahir Z.A., Shahzad S.M., Irshad and Arshad. Isolation and screening of rhizobia for improving growth and nodulation of lentil (Lens culinaris Medic) seedlings under axenic conditions. Soil and Environ. 2007;26: 81-91.
- Zahran H.H . Rhizobia from wild legumes: diversity, taxonomy, ecology, nitrogen fixation and biotechnology. Botany Department, Faculty of Science, Beni-Suef,2001; 62511, Egypt.
CrossRef
Appendices
Appendix Table 1: ANOVA for Nodulation Parameters on Sand Experiment for Wild Rhizobium.
| Source of variation | Degree of freedom | Nodule Number |
Nodule dry weight (g plant-1) |
Shoot dry weight (g plant-1) |
|||
| Mean square | F-value | Mean square | F-value | Mean square | F-value | ||
| Replication | 2 | 920.74 | 0.71ns | 0.0002 | 0.05ns | 0.03 | 0.22ns |
| Treatment | 51 | 1697.05 | 12.38* | 0.01 | 66.48* | 0.41 | 19.85* |
| Error Means |
102 | 14251.33 61.1 |
0.0174 0.08 |
2.13 0.85 |
|||
| CV (%) | 19.1 | 15.4 | 16.7 | ||||
ns = Non-significant; ** = Significant at P < 0.05, CV= Coefficient of variation
Appendix Table 2: Correlation Coefficient Parameters on Sand Culture for Wild Rhizobium.
| Description | Nodule number / Nodule dry weight* | |
| Mean | 61.1 | 0.08† |
| Std Dev | 25.5 | 0.06† |
| Minimum | 0 | 0† |
| Maximum | 151 | 0.29† |
| r value | r = 0.32** | |
** = Significance at P < 0.01; †= Represents values for the 2nd parameter in a column
Appendix Table 3: ANOVA for Nodulation Parameters on Sand Experiment for Mutant Rhizobium.
| Source of variation | Degree of freedom |
Nodule Number |
Nodule dry weight (g plant-1) |
Shoot dry weight (g plant-1) |
|||
| Mean square | F-value | Mean square | F-value | Mean square | F-value | ||
| Replication | 2 | 319 | 0.18ns | 0.0004 | 0.06ns | 0.04ns | 0.32ns |
| Treatment | 9 | 5252 | 45.35* | 0.02 | 85.8* | 0.41* | 22.59* |
| Error | 18 | 2316 | 0.005 | 0.367 | |||
| Means | 70.0 | 0.11 | 0.85 | ||||
| CV (%) | 15.37 | 14.11 | 15.78 | ||||
ns = Non-significant; * = Significant at P < 0.05, CV= Coefficient of variation
Appendix Table 4: Corilation Coefficient Parameters on Sand Culture for Mutant Rhizobium.
| Description | Nodule number/Nodule dry weight* | |
| Mean | 70 | 0.11† |
| Std Dev | 41.34 | 0.8† |
| Minimum | 0 | 0† |
| Maximum | 141 | 0.24† |
| r value | 0.85** | |
** = Significance at P < 0.01; † = Represents values for the 2nd parameter in a column
Appendex Table 5: ANOVA for the Different Parameters of Soil Culture Experiment for Wild Rhizobium.
| Mean square values and significance level | ||||||
| Source of variation |
Degree of Freedom |
Nodule number plant-1 |
Nodule dry weight (g plant-1) |
Shoot dry weight (g.plant-1) |
Percent N |
N Content (g/pl) |
| Replication | 2 | 614.7ns | 0.00183ns | 0.089ns | 0.19ns | 0.00003ns |
| Treatment | 6 | 6307.9* | 0.014* | 1.14* | 0.291ns | 0.0004* |
| Error | 12 | 232 | 0.0005 | 0.057 | 0.148 | 0.00001 |
| Means | 77 | 0.15 | 1.2 | 2.6 | 0.025 | |
| CV (%) | 19.09 | 15.34 | 19.9 | 17.03 | 17.28 | |
ns = Non-significant; * = Significant at P < 0.05, CV= Coefficient of variation
Appendex Table 6: Correlation Coefficient of Selected Parameters in Soil Experiment for Wild Rhizobium.
| Description | Nodule number/nodule dry weight* | Shoo dry weight/N content* | ||
| Mean | 76.5 | 0.15† | 1.2 | 0.025† |
| Std Dev | 45.3 | 0.06† | 0.6 | 0.01† |
| Minimum | 7 | 0.04† | 0.5 | 0.01† |
| Maximum | 135 | 0.28† | 2.24 | 0.04† |
| r value | 0.88** | 0.74** | ||
**, = P < 0.001; †= Represents values for the 2nd parameter in a column
Appendex Table 7: ANOVA for the Different Parameters of Soil Culture Experiment for Mutant Rhizobium.
| Mean square values and significance level | ||||||
| Source of Variation |
Degree of Freedom |
Nodule number plant-1 |
Nodule dry weight (g plant-1) |
Shoot dry weight (g plant-1) |
N per cent | N Content (gpl) |
| Replication | 2 | 882ns | 0.001ns | 0.32ns | 0.323ns | 0.0003ns |
| Treatment | 7 | 999* | 0.001* | 1.6* | 0.384* | 0.0018* |
| Error | 14 | 288.7 | 0.0006 | 0.114 | 0.124 | 0.0001 |
| Means | 103 | 0.16 | 2.1 | 2.3 | 2.3 | |
| CV (%) | 16.5 | 15 | 15 | 16 | 17 | |
ns = Non-significant; * = Significant at P < 0.05, CV= Coefficient of variation
Appendex Table 8: The Correlation Coefficient of Selected Parameters in Soil Experiment for Mutant Rhizobium.
| Description | Nodule number/nodule dry weight* | Shoot dry weight/N content* |
Shoot dry weight/% N | |||
| Mean | 103.1 | 0.17† | 2.27 | 2.27† | 2.27 | 0.05† |
| Std Dev | 22.5 | 0.03† | 0.74 | 0.5† | 0.74 | 0.02† |
| Minimum | 76 | 0.09† | 1.5 | 1.6† | 1.5 | 0.02† |
| Maximum | 175 | 0.22† | 4 | 3.3† | 4 | 0.1† |
| r value | 0.72* | 0.95* | 0.78* | |||
*= Significance at P < 0.001; 0.215†= Represents values for the 2nd parameter in a column
Appendex Table 9: Tolerance of Mutant Rhizobial Isolates on High Salinity and Extreme pH.
| Treatment | Salt tolerance (%) | pH range | ||||
| 11 | 12 | 4 | 11 | 11.5 | 12 | |
| HUCRM2D | + | + | + | + | + | + |
| HUCRM5C | + | + | + | + | – | – |
| HUCRM7D | – | – | – | + | – | – |
| HUCRM9A | – | – | – | – | – | – |
| HUCRM9C | – | – | – | – | – | – |
| HUCRM12E | + | – | – | – | – | – |
| HUCRM3B | + | + | – | – | – | – |
| HUCRM14A | + | – | + | + | + | + |
Key: +: Presence, – : Absence of Growth