
Introduction
In moriculture, quality of mulberry leaves has been considered as a prime feature in good crop production.1 Better the leaf quality, greater are the possibilities of obtaining good cocoons, resulting in qualitative and quantitative silk production. The biochemical composition of mulberry leaf, viz., carbohydrates, proteins, minerals, fatty acids, amino acids and vitamins satisfy the nutritional requirement of silkworm larvae ensuring their healthy growth, and development of quality silk gland.2 Application of fertilizers and biofertilizers have been reported to increase the biochemical contents of the mulberry leaves with regard to its nutritional status.3-5 Albeit, information on the nutritional status of the biochemical aspects of mulberry leaves through soil application of micronutrients is scanty. The quality and quantity of mulberry leaves can be increased by adopting physiological manipulations.6 Micronutrients are involved in numerous metabolic events of mulberry plant viz., photosynthesis, chlorophyll establishment, cell wall development, water absorption and xylem permeability, plant growth and resistance to plant diseases, responsible for quality leaf production.7 Further, micronutrients perform the role of cofactors in enzyme stimulation, partake in redox reactions, photosynthesis and respiration, besides playing an indispensable part in the metabolism of carbohydrates and translocation of sugars.8-12 Therefore, in the present study, the impact of micronutrients on the biochemical contents of mulberry leaves was assessed.
Materials and Methods
Study area
A three year old mulberry garden, free from other plants which received direct sunlight exposure with proper irrigation served for conducting field experiments. This experimental plot was situated at an altitude of 29 m above sea level at Poovancode village, Kanyakumari district, Tamil Nadu, India (8.3031° N, 77.2881° E).
Mulberry cultivation
For the experimental study, MR2 (Mildew Resistant Variety 2) mulberry plant (Morus alba) was selected. This was developed by the Sericulture Department, Govt. of Tamil Nadu experimental station, Coonoor, Tamil Nadu, India. The mulberry plants were pruned in the month of June, ploughed, FYM applied at 20t/ha/year, and a single dose of nitrogen, phosphorous and potash at 120:120:60 kg/ha/year was hoed in the soil uniformly. All of the above were done prior to the commencement of the experiment. Irrigation at an interval of five day was provided, depending upon the climatic conditions. After twenty days of pruning, the micronutrients were added to the soil. Care was taken to ensure that the experimental plot was protected from plant pests and also in periodical removal of diseased/affected parts of the plant.
Experimental design and treatments
A randomized block design with twelve treatments with spacing of 90x60cm between the plants was chosen for the field experiments. Recommended dose of fertilizers and the macronutrients, viz., nitrogen, phosphorous and potassium (NPK) in the form of ammonium sulphate, super phosphate, potash (120:120:60) was common for all treatments. Each treatment (except control) was supplemented with the required amount of micronutrients, viz., zinc, copper and iron in the form of zinc sulphate, copper sulphate and ferrous sulphate either individually or in combination (Table 1) and were given as soil application. Each treatment replicated thrice, with ten plants per replication was supplemented with the required amount of micronutrients.
Table 1: Treatments used for the present study
| Treatment | Micronutrients (individual/combination) | |||||
| T0 | : | Control | ||||
| T1 | : | FeSO4 10Kg/ha | ||||
| T2 | : | Zn SO4 5Kg/ha | ||||
| T3 | : | CuSO4 5Kg/ha | ||||
| T4 | : | CuSO4 5Kg/ha | + | ZnSO4 5Kg/ha | ||
| T5 | : | CuSO4 5Kg/ha | + | FeSO4 10Kg/ha | ||
| T6 | : | FeSO4 10Kg/ha | + | ZnSO4 5Kg/ha | ||
| T7 | : | CuSO4 5Kg/ha | + | ZnSO4 5Kg/ha | + | FeSO4 10Kg/ha |
| T8 | : | CuSO4 10Kg/ha | + | ZnSO4 10Kg/ha | + | FeSO4 20Kg/ha |
| T9 | : | CuSO4 15Kg/ha | + | ZnSO4 15Kg/ha | + | FeSO4 30Kg/ha |
| T10 | : | CuSO4 20Kg/ha | + | ZnSO4 20Kg/ha | + | FeSO4 40Kg/ha |
| T11 | : | CuSO4 25Kg/ha | + | ZnSO4 25Kg/ha | + | FeSO4 25Kg/ha |
Five plants in each replication were randomly selected and labelled for recording observations at the 45th and 60th day of pruning for its biochemical parameters viz., leaf moisture, leaf moisture retention, chlorophyll ‘a’, ‘b’, total chlorophyll, carbohydrates, proteins, free amino acids and nitrogen.
Biochemical analysis of mulberry leaf
Leaf moisture and leaf moisture retention was estimated through gravimetric method on fresh weight basis.13 Chlorophyll ‘a’, ‘b’, and total chlorophyll content of leaves14-16 were estimated using spectrophotometer at a wavelength of 645 to 663nm, and computed via Arnon’s formulae,17 and expressed in mg/g of leaf on fresh weight basis. The harvested leaves (at 45th and 60th day of pruning) from the plant were oven dried at 70°C for one hour and powdered. The dried leaf samples were then analysed for carbohydrate,18-21 total protein,22,23 total free amino acid24 and nitrogen25 content.
Statistical analysis
Pooled data affirmed as Mean ±S.D, and subjected to Student’s ‘t’ test to determine significant difference between control and treatment groups.
Results
Leaf moisture
The leaf moisture was found to be more in apical leaves, followed by middle and bottom leaves. Maximum mean leaf moisture content on the 45th and 60th day of pruning was noted in T8 (CuSO4 10Kg/ha + ZnSO4 10Kg/ha + FeSO4 20Kg/ha) (80.72 ±1.44%) and (81.41 ±3.32%) which increased by 10.30% and 12.39% over control, respectively and its minimum was recorded in T6 (FeSO4 10Kg/ha + ZnSO4 5Kg/ha) (74.48 ±1.31%) which increased by 1.77% over control, and in T4 (CuSO4 5Kg/ha + ZnSO4 5Kg/ha) (74.8 ±4.44%) with an increase of 3.27% over control, respectively (Table 2; Figure 1).
Leaf moisture retention
The bottom leaves had higher moisture retention percentage when compared to top and middle leaves. Maximum mean leaf moisture retention percentage on the 45th and 60th day of pruning was noted in T8 (CuSO4 10Kg/ha + ZnSO4 10Kg/ha + FeSO4 20Kg/ha) (70.70 ±7.86%) and (80.67 ±5.66%) which increased by 29.32% and 11.02% over control, respectively and its minimum was recorded in T5 (CuSO4 5Kg/ha + FeSO4 10Kg/ha) (59.58 ±1.34%) with an increase of 8.98% over control, and in T11 (CuSO4 25Kg/ha + ZnSO4 25Kg/ha + FeSO4 25Kg/ha) (77.12 ±2.26%) with an increase of 6.13% over control respectively (Table 3; Figure 1).
Chlorophyll
On the 45th day of pruning, maximum and minimum chlorophyll ‘a’ content was observed in T8 (CuSO4 10Kg/ha + ZnSO4 10Kg/ha + FeSO4 20Kg/ha) (1.80 ±0.25mg/g) and T3 (CuSO4 5Kg/ha) (1.61 ±0.08mg/g) which increased by 18.42% and 5.92%, respectively over control; while for chlorophyll ‘b’ it was recorded at T7 (CuSO4 5Kg/ha + ZnSO4 5Kg/ha + FeSO4 10Kg/ha) (0.58 ±0.05mg/g) and T11 (CuSO4 25Kg/ha + ZnSO4 25Kg/ha + FeSO4 25Kg/ha) (0.42 ±0.01mg/g) which increased by 48.71% and 7.69%, respectively over control. The total chlorophyll content was maximum in T8 (2.34 ±0.34mg/g) which increased by 21.87% over control; and the minimum value was reported in T1 (FeSO4 10Kg/ha) (2.05 ±0.12mg/g) with an increase of 6.77% over control (Table 4; Figure 1). Whereas, on the 60th day of pruning, maximum and minimum chlorophyll ‘a’ content was observed in T8 and T9 (CuSO4 15Kg/ha + ZnSO4 15Kg/ha + FeSO4 30Kg/ha) (1.91 ±0.10mg/g and 1.91 ±0.08mg/g) and T1 (1.16 ±0.06mg/g) which increased by 29.05% and 2.03%, respectively over control; while for chlorophyll ‘b’ it was again recorded in T8 and T9 (0.64 ±0.12 and 0.64 ±0.13mg/g) with an increase of 18.52% over control and in T1 and T2 (ZnSO4 5Kg/ha) (0.54 ±0.16mg/g) which was on par with the control. Maximum total chlorophyll content was observed in T9 (2.56 ±0.18mg/g) which increased by 26.25% when compared to control; and the minimum value was reported in T1 (2.05 ±0.18mg/g) with an increase of 1.48% over control (Table 4; Figure1).
Carbohydrate
The soil application of micronutrients increased the sugar content in middle leaves followed by apical and bottom leaves. On the 45th and 60th day of pruning, maximum carbohydrate content was recorded in T10 (CuSO4 20Kg/ha + ZnSO4 20Kg/ha + FeSO4 40Kg/ha) (373.41 ±45.65µg/mg) and T9 (CuSO4 15Kg/ha + ZnSO4 15Kg/ha + FeSO4 30Kg/ha) (236.66 ±62.13µg/mg) which increased by 22.25% and 24.99% respectively, over control, and its minimum was recorded in T11 (CuSO4 25Kg/ha + ZnSO4 25Kg/ha + FeSO4 25Kg/ha) (317.53 ±60.47µg/mg) and T7 (CuSO4 5Kg/ha + ZnSO4 5Kg/ha + FeSO4 10Kg/ha) (195.66 ±32.46µg/mg) which increased by 3.96% and 3.34% respectively, over control (Table 5; Figure 1).
Protein
The soil application of micronutrients increased the protein content in middle leaves followed by apical and bottom leaves. On the 45th and 60th day of pruning, maximum protein content was recorded in T9 (CuSO4 15Kg/ha + ZnSO4 15Kg/ha + FeSO4 30Kg/ha) (405.16 ±83.51µg/g) and T8 (CuSO4 10Kg/ha + ZnSO4 10Kg/ha + FeSO4 20Kg/ha) (385.20 ±3.38µg/g) which increased by 60.56% and 70.69% respectively, over control, and its minimum was recorded in T2 (ZnSO4 5Kg/ha) (312.83 ±15.46µg/g) and T3 (CuSO4 5Kg/ha) (246.16 ±59.07µg/g) which increased by 23.97% and 9.08% respectively, over control (Table 6; Figure 1).
Free amino acid
In all the treatments, free amino acid content was higher in the apical leaves followed by middle and bottom leaves. On the 45th and 60th day of pruning, maximum free amino acid content was recorded in T8 (CuSO4 10Kg/ha + ZnSO4 10Kg/ha + FeSO4 20Kg/ha) (41.83 ±9.81µg/g) and T4 (CuSO4 5Kg/ha + ZnSO4 5Kg/ha) (19.33 ±8.86µg/g) which increased by 112.76% and 123.21% respectively, over control, and its minimum was recorded in T10 (CuSO4 20Kg/ha + ZnSO4 20Kg/ha + FeSO4 40Kg/ha) (20.0 ±2.64µg/g) and T1 (FeSO4 10Kg/ha) (9.66 ±3.88µg/g) which increased by 1.72% and 11.54% respectively over control (Table 7; Figure 1).
Nitrogen
In all the treatments, nitrogen content was higher in the apical leaves followed by middle and bottom leaves. On the 45th and 60th day of pruning, maximum nitrogen content was recorded in T9 (CuSO4 15Kg/ha + ZnSO4 15Kg/ha + FeSO4 30Kg/ha) (4.50 ±0.61%) and T10 (CuSO4 20Kg/ha + ZnSO4 20Kg/ha + FeSO4 40Kg/ha) (3.46 ±0.06%) which increased by 30.81% and 11.93% respectively, over control, and its minimum was recorded in T1 (FeSO4 10Kg/ha) (3.67 ±0.57%) and T6 (FeSO4 10Kg/ha + ZnSO4 5Kg/ha) (3.13 ±0.12%) which increased by 6.68% and 0.96% respectively, over control (Table 8; Figure 1).
Table 2: Effect of micronutrients on leaf moisture of mulberry leaf
| Treatment | 45th day of pruning | 60th day of pruning | ||||||
| Top | Middle | Bottom | Mean | Top | Middle | Bottom | Mean | |
| T0 | 75.75 ±0.88 | 72.97 ±2.06 | 70.82 ±0.09 | 73.18 ±2.47 | 73.58 ±0.71 | 72.57 ±1.29 | 71.14 ±1.01 | 72.43 ±1.22 |
| T1 | 80.57 ±0.21 | 78.89 ±0.50 | 77.6 ±2.26 | 77.39 ±2.72 | 78.05 ±1.03 | 76.58 ±0.71 | 75.13 ±1.02 | 76.58 ±1.46 |
| T2 | 80.14 ±1.43 | 78.97 ±1.32 | 77.12 ±0.44 | 78.74 ±1.52 | 78.22 ±1.40 | 76.23 ±1.0 | 72.15 ±2.88 | 75.53 ±3.09 |
| T3 | 80.0 ±0.05 | 78.06 ±2.04 | 75.23 ±0.16 | 77.76 ±2.39 | 80.85 ±2.24 | 77.71 ±0.61 | 72.64 ±3.58 | 77.06 ±4.14 |
| T4 | 77.79 ±1.4 | 75.91 ±2.14 | 73.66 ±0.17 | 76.12 ±2.57 | 79.90 ±5.07 | 72.72 ±1.14 | 71.78 ±0.68 | 74.80 ±4.44 |
| T5 | 79.41 ±2.7 | 77.80 ±1.14 | 76.86 ±2.43 | 78.02 ±1.28 | 82.90 ±4.58* | 76.42 ±0.79 | 74.47 ±1.37 | 77.93 ±4.41 |
| T6 | 75.86 ±1.43 | 74.34 ±1.11 | 73.24 ±2.38 | 74.48 ±1.31 | 79.22 ±1.74 | 76.75 ±0.12 | 73.42 ±2.59 | 76.46 ±2.91 |
| T7 | 79.17 ±3.1 | 77.88 ±1.27 | 76.14 ±1.43 | 77.73 ±1.52 | 83.23 ±3.22* | 78.67 ±1.16 | 75.32 ±3.36 | 79.07 ±3.97 |
| T8 | 82.22 ±3.61* | 80.62 ±1.19* | 79.33 ±1.67* | 80.72 ±1.44* | 80.78 ±2.98 | 85.0 ±1.00* | 78.45 ±4.63* | 81.41 ±3.32* |
| T9 | 81.48 ±2.64* | 80.22 ±1.17* | 78.66 ±2.83* | 80.12 ±1.41* | 81.12 ±1.02* | 79.67 ±0.66 | 80.62 ±0.07* | 80.47 ±0.73* |
| T10 | 79.41 ±2.74 | 77.53 ±1.34 | 76.32 ±1.16 | 77.75 ±1.55 | 81.64 ±2.57* | 78.0 ±1.00 | 76.59 ±0.92 | 78.74 ±2.60 |
| T11 | 77.14 ±3.2 | 75.37 ±1.51 | 73.45 ±0.76 | 75.32 ±1.84 | 82.56 ±2.10* | 79.58 ±0.71 | 75.28 ±2.04 | 79.14 ±3.65 |
Values expressed in %; *Significant @ P<0.05 (t-test)
Table 3: Effect of micronutrients on leaf moisture retention of mulberry leaf
| Treatment | 45th day of pruning | 60th day of pruning | ||||||
| Top | Middle | Bottom | Mean | Top | Middle | Bottom | Mean | |
| T0 | 54.16 ±1.86 | 56.52 ±2.25 | 53.33 ±2.12 | 54.67 ±2.91 | 78.78 ±1.71 | 76.36 ±4.86 | 62.84 ±4.32 | 72.66 ±8.59 |
| T1 | 60.14 ±5.85* | 68.42 ±3.71* | 73.68 ±4.43* | 67.41 ±6.82* | 80.23 ±1.19 | 78.54 ±1.96 | 72.65 ±2.18* | 77.14 ±3.97 |
| T2 | 58.31 ±4.51 | 64.70 ±4.25* | 70.58 ±4.27* | 64.53 ±6.13* | 81.89 ±2.51 | 78.34 ±0.86 | 74.43 ±2.59* | 78.22 ±3.73 |
| T3 | 59.32 ±1.82 | 61.90 ±5.18* | 69.23 ±4.06* | 63.48 ±5.14* | 80.50 ±1.61 | 78.21 ±1.42 | 73.38 ±2.21* | 77.36 ±3.63 |
| T4 | 59.28 ±6.46 | 68.42 ±2.26* | 65.22 ±0.64* | 64.30 ±4.63* | 82.75 ±0.85 | 81.54 ±3.30 | 72.63 ±2.67* | 78.97 ±5.52 |
| T5 | 58.55 ±0.38 | 59.09 ±1.42 | 61.11 ±1.07* | 59.58 ±1.34 | 80.65 ±2.21 | 77.52 ±0.49 | 74.82 ±2.11* | 77.66 ±2.91 |
| T6 | 54.47 ±7.09 | 62.5 ±5.56* | 70.37 ±6.07* | 61.78 ±8.97* | 81.36 ±0.58 | 80.53 ±3.39 | 71.63 ±2.48* | 77.84 ±5.39 |
| T7 | 57.81 ±5.23 | 65.21 ±1.11* | 63.64 ±1.04* | 62.22 ±3.89* | 79.35 ±1.43 | 77.32 ±0.18 | 79.36 ±0.47* | 78.67 ±1.17 |
| T8 | 61.87 ±10.64* | 76.92 ±2.53* | 73.33 ±1.85* | 70.70 ±7.86* | 84.12 ±0.25* | 83.76 ±3.82* | 74.14 ±2.43* | 80.67 ±5.66* |
| T9 | 63.09 ±0.64* | 64.0 ±5.25* | 71.43 ±3.71* | 66.17 ±4.57* | 83.97 ±1.81 | 81.40 ±2.42 | 73.87 ±2.98* | 79.74 ±5.24 |
| T10 | 59.79 ±3.83* | 65.21 ±2.10* | 68.18 ±2.67* | 64.39 ±4.25* | 82.97 ±2.25 | 79.78 ±2.32 | 72.18 ±3.29* | 78.31 ±5.54 |
| T11 | 58.29 ±2.29 | 61.53 ±6.40 | 70.59 ±5.03* | 63.47 ±6.37* | 79.13 ±1.10 | 77.57 ±0.82 | 74.67 ±1.41* | 77.12 ±2.26 |
Values expressed in %; *Significant @ P<0.05 (t-test)
 |
Table 4: Effect of micronutrients on the chlorophyll content of mulberry leaf |
Values expressed in mg/g; *Significant @ P<0.05 (t-test)
Table 5: Effect of micronutrients on the carbohydrate content of mulberry leaf
| Treatment | 45th day of pruning | 60th day of pruning | ||||||
| Top | Middle | Bottom | Mean | Top | Middle | Bottom | Mean | |
| T0 | 310.13 ±42.42 | 371.50 ±3.53 | 234.67 ±10.77 | 305.43 ±71.45 | 232.50 ±19.60 | 181.5 ±26.16 | 154.0 ±5.65 | 189.33 ±37.65 |
| T1 | 385.21 ±21.21* | 355.86 ±63.63 | 267.57 ±15.09* | 336.21 ±61.23* | 263.50 ±10.61* | 210.0 ±70.71* | 158.50 ±2.12 | 210.66 ±52.50* |
| T2 | 355.63 ±21.21* | 325.45 ±21.23 | 280.93 ±16.99* | 320.67 ±37.57 | 250.50 ±16.57 | 250.0 ±107.27* | 160.50 ±0.70 | 220.33 ±51.81* |
| T3 | 310.0 ±0.0 | 380.19 ±84.85 | 348.12 ±27.82* | 346.10 ±35.13* | 269.50 ±16.27* | 223.0 ±80.61* | 162.50 ±4.94 | 218.33 ±53.65* |
| T4 | 385.72 ±16.0* | 362.50 ±3.53 | 269.13 ±15.97* | 339.11 ±61.71* | 259.0 ±12.83* | 231.50 ±101.01* | 155.50 ±3.53 | 215.33 ±53.61* |
| T5 | 390.81 ±14.14* | 385.22 ±7.07 | 259.50 ±14.12* | 345.17 ±74.25* | 268.50 ±17.68* | 270.50 ±96.85* | 159.0 ±2.82 | 232.66 ±63.80* |
| T6 | 360.37 ±28.28* | 410.84 ±42.42* | 264.45 ±16.34* | 345.22 ±74.36* | 264.50 ±13.34* | 268.50 ±57.68* | 153.0 ±5.65 | 228.66 ±65.55* |
| T7 | 305.54 ±49.49 | 375.14 ±48.49 | 313.32 ±27.18* | 331.33 ±38.13 | 218.50 ±72.83 | 210.0 ±84.85* | 158.50 ±12.0 | 195.66 ±32.46 |
| T8 | 345.23 ±49.49* | 420.32 ±56.56* | 298.46 ±20.11* | 354.67 ±61.47* | 238.50 ±15.25 | 234.50 ±106.77* | 158.0 ±1.41 | 210.33 ±45.36* |
| T9 | 430.57 ±42.42* | 375.25 ±7.07 | 278.53 ±17.83* | 361.45 ±76.95* | 269.50 ±16.27* | 275.50 ±47.78* | 165.0 ±8.48* | 236.66 ±62.13* |
| T10 | 410.0 ±62.63* | 388.0 ±61.35 | 322.25 ±22.73* | 373.41 ±45.65* | 237.50 ±12.53 | 216.0 ±94.65* | 163.50 ±2.12 | 205.66 ±38.06 |
| T11 | 270.47 ±41.42 | 385.75 ±21.21 | 296.39 ±20.93* | 317.53 ±60.47 | 261.50 ±13.44* | 219.0 ±72.12* | 160.50 ±10.6 | 213.66 ±50.71* |
Values expressed in µg/mg; *Significant @ P<0.05 (t-test)
Table 6: Effect of micronutrients on the protein content of mulberry leaf
| Treatment | 45th day of pruning | 60th day of pruning | ||||||
| Top | Middle | Bottom | Mean | Top | Middle | Bottom | Mean | |
| T0 | 268.50 ±19.30 | 311.50 ±20.59 | 268.0 ±1.14 | 252.33 ±75.66 | 223.0 ±1.41 | 250.0 ±34.30 | 204.0 ±32.50 | 225.66 ±23.11 |
| T1 | 330.12 ±10.07* | 367.50 ±25.50* | 332.50 ±13.43* | 343.37 ±20.9* | 278.0 ±57.30 | 308.0 ±35.38 | 238.0 ±20.81 | 274.66 ±55.67* |
| T2 | 321.0 ±57.98* | 322.50 ±60.10 | 295.0 ±21.21* | 312.83 ±15.46* | 275.0 ±49.49 | 429.50 ±67.9 | 158.0 ±15.96 | 287.50 ±136.14* |
| T3 | 328.50 ±19.09* | 355.0 ±13.0* | 325.12 ±14.31* | 336.20 ±16.36* | 278.0 ±28.56 | 282.50 ±29.03 | 178.0 ±14.27 | 246.16 ±59.07 |
| T4 | 334.50 ±16.26* | 357.50 ±11.50* | 331.62 ±12.19* | 341.20 ±14.18* | 317.0 ±4.42 | 333.0 ±21.0 | 316.0 ±5.65 | 322.0 ±9.53* |
| T5 | 316.50 ±12.02* | 338.0 ±13.0 | 314.37 ±9.01* | 322.95 ±13.07* | 308.0 ±23.24 | 321.50 ±48.19 | 298.0 ±29.10 | 309.83 ±7.01* |
| T6 | 407.0 ±59.39* | 414.50 ±48.79* | 260.50 ±26.57 | 360.66 ±86.82* | 311.50 ±10.60 | 341.50 ±17.50 | 314.0 ±14.11 | 322.33 ±16.60* |
| T7 | 373.50 ±13.42* | 381.0 ±17.0* | 375.87 ±10.07* | 376.79 ±3.83* | 315.87 ±11.10 | 338.0 ±9.0 | 318.50 ±14.84 | 324.12 ±12.08* |
| T8 | 400.50 ±6.36* | 410.0 ±84.85* | 375.0 ±91.92* | 395.16 ±62.63* | 384.12 ±6.89 | 389.0 ±13.0 | 382.50 ±9.19 | 385.20 ±3.38* |
| T9 | 408.0 ±93.33* | 408.50 ±8.48* | 399.0 ±21.83* | 405.16 ±83.51* | 368.12 ±2.61 | 398.50 ±3.50 | 367.50 ±3.53 | 378.04 ±17.25* |
| T10 | 396.50 ±45.30* | 403.50 ±16.17* | 329.50 ±40.75* | 376.50 ±85.54* | 356.87 ±2.65 | 386.50 ±6.50 | 377.50 ±3.53 | 373.62 ±15.19* |
| T11 | 366.50 ±0.70* | 383.50 ±23.33* | 343.50 ±33.23* | 364.50 ±20.07* | 312.50 ±3.53 | 326.0 ±16.0 | 313.12 ±2.65 | 317.20 ±7.62* |
Values expressed in µg/g; *Significant @ P<0.05 (t-test)
Table 7: Effect of micronutrients on the free amino acid content of mulberry leaf
| Treatment | 45th day of pruning | 60th day of pruning | ||||||
| Top | Middle | Bottom | Mean | Top | Middle | Bottom | Mean | |
| T0 | 19.50 ±12.02 | 22.0 ±5.65 | 17.50 ±6.36 | 19.66 ±4.25 | 8.66 ±3.01 | 2.0 ±1.19 | 1.0 ±0.01 | 8.66 ±3.88 |
| T1 | 29.0 ±18.38* | 22.0 ±8.48 | 35.0 ±9.89* | 28.66 ±6.50* | 9.66 ±8.54 | 2.70 ±1.74* | 2.90 ±0.82* | 9.66 ±3.88 |
| T2 | 27.50 ±23.33* | 33.50 ±14.84* | 17.0 ±8.48 | 26.0 ±8.35* | 10.0 ±5.29* | 2.60 ±0.02 | 6.80 ±2.10* | 10.0 ±5.08* |
| T3 | 36.50 ±17.67* | 40.50 ±12.02* | 28.0 ±5.65* | 35.0 ±6.38* | 15.0 ±2.76* | 9.0 ±1.63* | 2.60 ±1.36* | 15.0 ±6.46* |
| T4 | 29.0 ±15.55* | 35.0 ±7.07* | 24.0 ±8.48* | 29.33 ±5.50* | 19.33 ±1.01* | 5.0 ±2.47* | 2.00 ±0.03* | 19.33 ±8.86* |
| T5 | 30.50 ±53.03* | 20.0 ±5.65 | 27.50 ±47.37* | 25.83 ±5.34* | 13.66 ±1.18* | 13.50 ±1.73* | 2.10 ±0.06* | 13.66 ±8.77* |
| T6 | 27.50 ±9.19* | 34.50 ±19.09* | 41.0 ±9.89* | 34.33 ±6.75* | 14.33 ±3.50* | 14.0 ±1.31* | 2.0 ±0.02* | 14.33 ±9.75* |
| T7 | 25.0 ±1.41* | 36.0 ±16.97* | 37.0 ±15.55* | 41.66 ±19.4* | 12.66 ±3.31* | 15.0 ±1.32* | 1.90 ±1.25 | 12.66 ±8.18* |
| T8 | 30.50 ±0.70* | 47.50 ±24.74* | 47.50 ±24.74* | 41.83 ±9.81* | 11.66 ±2.20* | 10.0 ±2.73* | 2.90 ±0.84* | 11.60 ±7.26* |
| T9 | 40.50 ±17.67* | 41.50 ±16.26* | 29.0 ±1.41* | 37.0 ±6.94* | 16.0 ±6.70* | 4.0 ±0.14* | 1.80 ±0.07 | 16.0 ±10.22* |
| T10 | 21.0 ±7.07 | 22.0 ±5.65 | 17.0 ±1.41 | 20.0 ±2.64 | 17.0 ±3.89* | 8.0 ±1.10* | 10.0 ±0.47* |
17.0 ±9.85* |
| T11 | 24.50 ±16.26* | 44.0 ±11.31* | 32.50 ±27.57* | 33.66 ±9.80* | 13.66 ±9.60* | 13.0 ±1.87* | 4.0 ±1.12* | 13.66 ±10.11* |
Values expressed in µg/g; *Significant @ P<0.05 (t-test)
Table 8: Effect of micronutrients on the nitrogen content of mulberry leaf
| Treatment | 45th day of pruning | 60th day of pruning | ||||||
| Top | Middle | Bottom | Mean | Top | Middle | Bottom | Mean | |
| T0 | 3.99 ±0.55 | 3.21 ±0.06 | 3.12 ±0.22 | 3.44 ±0.47 | 3.11 ±0.43 | 3.10 ±0.64 | 3.10 ±0.27 | 3.10 ±0.05 |
| T1 | 4.32 ±0.76 | 3.24 ±0.15 | 3.46 ±0.15* | 3.67 ±0.57 | 3.19 ±0.75 | 3.12 ±0.47 | 3.17 ±0.84 | 3.16 ±0.03 |
| T2 | 4.29 ±0.48 | 3.61 ±0.21* | 3.31 ±0.30 | 3.73 ±0.50 | 3.18 ±0.83 | 3.16 ±0.32 | 3.24 ±0.69 | 3.19 ±0.04* |
| T3 | 4.23 ±0.48 | 3.54 ±0.19* | 3.27 ±0.28 | 3.68 ±0.49 | 3.28 ±0.90 | 3.25 ±0.18 | 3.27 ±0.91 | 3.24 ±0.03* |
| T4 | 4.53 ±0.72* | 3.50 ±0.01 | 3.48 ±0.25* | 3.83 ±0.60* | 3.14 ±0.83 | 3.16 ±0.42 | 3.12 ±0.01 | 3.14 ±0.02 |
| T5 | 4.63 ±0.73* | 3.59 ±0.02* | 3.62 ±0.23* | 3.94 ±0.59* | 3.40 ±0.53 | 3.31 ±0.13 | 3.29 ±0.98 | 3.33 ±0.05* |
| T6 | 4.01 ±0.01 | 3.99 ±0.28* | 3.59 ±0.19* | 3.86 ±0.23* | 3.28 ±0.42 | 3.08 ±0.43 | 3.05 ±0.76 | 3.13 ±0.12 |
| T7 | 4.45 ±0.09* | 4.32 ±0.28* | 3.91 ±0.22* | 4.22 ±0.28* | 3.32 ±0.19 | 3.20 ±0.14 | 3.17 ±0.91 | 3.23 ±0.07 |
| T8 | 4.76 ±0.52* | 4.02 ±0.16* | 3.78 ±0.28* | 4.18 ±0.51* | 3.49 ±0.25* | 3.18 ±0.06 | 3.16 ±0.57 | 3.27 ±0.18 |
| T9 | 5.20 ±0.67* | 4.24 ±0.12* | 4.06 ±0.31* | 4.50 ±0.61* | 3.51 ±0.23* | 3.28 ±0.79 | 3.25 ±0.12 | 3.34 ±0.14 |
| T10 | 3.87 ±0.24 | 4.22 ±0.62* | 3.34 ±0.33 | 3.81 ±0.44* | 3.53 ±0.47* | 3.46 ±0.54* | 3.41 ±0.32* | 3.46 ±0.06* |
| T11 | 4.08 ±0.26 | 3.71 ±0.14* | 3.50 ±0.18* | 3.76 ±0.29 | 3.45 ±0.63* | 3.38 ±0.93 | 3.32 ±0.25 | 3.38 ±0.06* |
Values expressed in %; *Significant @ P<0.05 (t-test)
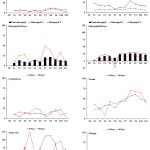 |
Figure 1: Effect of micronutrients on biochemical contents of mulberry leaves |
Discussion
Micronutrients have an impact on the mulberry plant in terms of quality, growth and yield,26 and contribute to the foremost part in numerous metabolic actions accountable for synthesis of proteins, sugars and enzymes, which leads to superior production of quality mulberry leaf.27. Machii and Katagiri28 and Suryanarayan and Shivashankar29 reported that increased contents of nitrogen and amino acids in mulberry leaves are nutritionally greater and are positively linked to silkworm development and growth. The present results opined that soil application of micronutrients supplemented the betterment of yield and quality in terms of proteins and carbohydrates, as these two biochemical constituents determines the feeding value of silkworm which in turn reflects upon the silk production.
Leaf moisture
Moisture content in mulberry leaves is a very important factor which influences silkworm growth, as it has an intimate relation to an easy ignition of leaves to silkworm, as high moisture make it more palatable to them. Micronutrients treated mulberry leaves revealed significant variations in moisture and moisture retention capacity. Yokoyama30 reported 64-83% moisture content in mulberry leaves. On the 45th and 60th day of pruning, the moisture capacity in the present study increased to 10.30% – 12.39% as the maximum in T8 treatment (CuSO4 10Kg/ha + ZnSO4 10Kg/ha + FeSO4 20Kg/ha) when compared to control. Higher moisture content in T8 treatment may be due to genetic character, and influence of balanced fertilizers combination which helped in uptake of available nutrients. During the study period, the tender leaves had more moisture content than middle and bottom leaves. Leaves possessing higher leaf moisture content are recognised as good quality leaves,31,32 and are considerably related to the silkworm growth and nutritional parameters33 The moisture content in mulberry leaves plays an important part in uplifting the nutritional levels, which in turn improves the scrumptiousness and digestibility of leaves by silkworms, feeding efficiency of silkworm larvae, increased growth rate, as well as quality development of cocoon.34,35 An optimum level of leaf moisture content is directly related to the growth of silkworm, since low leaf moisture content influences the assimilation and conversion efficiency of food (energetic parameters) to decrease. Sinha et al.36 reported that corresponding increased leaf growth and maturity can lead to a gradual decreased in the moisture content of mulberry leaves. The present findings correlated with the above facts. The enhancement of leaf moisture due to application of micronutrients might be due to enhancement of organic matter and water holding capacity in the soil, thereby, increasing the water absorption by plant.37 The current observations are related to the results of Babu et al.38 too. Increased leaf moisture content, and fresh leaf weight are due to the water retention capacity which steadily supplies moisture to the leaf. Further, microbial inoculants in the soil rhizosphere may also facilitate in the moisture accessibility, towards water uptake and added metabolic activities for upholding normal plant growth.
Leaf moisture retention
Moisture retention capacity also play a vital role, because silkworms prefer fresh leaves with high moisture for longer time.39 Micronutrients influences the moisture retention capacity of mulberry leaves due to water retention capacity of organic manures which steadily supplied the moisture.40-42 Increased moisture retention capacity in T8 treatment (CuSO4 10Kg/ha + ZnSO4 10Kg/ha + FeSO4 20Kg/ha) was 11.02% – 29.32% higher when compared to control on the 45th and 60th day of pruning. This may be due to increased stomata size due to uptake of water, and balanced mixture of zinc, copper and iron.
Chlorophyll
Chlorophyll content plays a vital role in computing the photosynthetic productivity of plant, and is a critical component in evaluating leaf quality. Total chlorophyll content was recorded high in T8 (CuSO4 10Kg/ha + ZnSO4 10Kg/ha + FeSO4 20Kg/ha) and T9 (CuSO4 15Kg/ha + ZnSO4 15Kg/ha + FeSO4 30Kg/ha) treated mulberry leaves on the 45th and 60th day of pruning, which increased to 21.87% and 26.25% when compared with control. Micronutrients significantly increased the levels of chlorophyll reflecting its impact on the increased qualitative parameters of leaf. The amplified volume of chlorophyll content in leaves specifies the photosynthetic effectiveness, the primary criterion for measuring photosynthetic proportion in mulberry.32 The positive effect of micronutrients on chlorophyll content of mulberry leaves might be attributed to the fact that nitrogen, an essential constituent of chlorophyll helps in harnessing more solar energy, and plays a greater role in improving the chlorophyll synthesis, an essential constituent of photosynthesis.43 Increased chlorophyll content of mulberry leaves be due to foliar nutrition.37,44 In the present study, increased chlorophyll content was obviously due to zinc which acted as a structural and catalytic components of protein, enzymes and as cofactors for normal development of pigment biosynthesis.45
Carbohydrate
Leaf quality determined by the presence of sugar, as the main source of energy, induces the silkworms to bite the leaves (biting factor) and to cherish it well, which in turn influences the healthy growth and development of silkworms. Carbohydrates, in mulberry leaves are present abundantly, and are stated to be the silkworm’s primary source of energy.46,47 High content of total sugar in mulberry leaf was accredited to the enhanced mineralization resulting in superior production of plant growth substances and enzyme activity due to soil application of micronutrients. The photosynthetic action aids in synthesis of carbohydrates in mulberry leaves, and principally the sugar content are in close relation with the silkworm health. The carbohydrate content significantly varied among the treatments and the highest carbohydrate content was found in the T10 (CuSO4 20Kg/ha + ZnSO4 20Kg/ha + FeSO4 40Kg/ha) and T5 (CuSO4 5Kg/ha + FeSO4 10Kg/ha) treated mulberry leaves which increased by 22.25% and 24.99% when compared to control on the 45th and 60th day of pruning respectively. This might be due to rapid conversion of starch to sugar. Further, optimum combination of micronutrients amplified nutrient uptake from soil, and caused the plant to drive additional sugars and extra exudates from its roots.
Protein
Leaf protein is a key element for silkworm nutrition, and approximately 70% of protein content of raw silk are biosynthesized directly from leaf protein, and 30% from the body tissue of silkworm.48,49 Protein content in mulberry leaves have a direct bearing on silkworm, mostly on larval growth with special reference to development of silk gland and cocoon characters.31 In the present study, the protein content was maximum in T9 (CuSO4 15Kg/ha + ZnSO4 15Kg/ha + FeSO4 30Kg/ha) and T8 (CuSO4 10Kg/ha + ZnSO4 10Kg/ha + FeSO4 20Kg/ha) treated mulberry leaves which increased by 60.56% and 70.69%, when compared with control. This was due to zinc in combination with copper and iron. Zinc and copper are taken up in the form of their respective ions, by the plants, and iron in the form of ferrous or ferric ions, which are needed for protein synthesis, and are involved in the activation of several enzyme systems. Further, the protein content of middle leaves was more when compared with top and bottom leaves, which was contradictory to the results of Murthy et al.50 but correlates with the findings of Singhvi et al.51 Protein, the core constituent of mulberry leaf, contributes to silk synthesis,52 and increase in the protein content is directly revealed on the leaf yield. Increased protein content might be due to the accessibility of adequate amount of nitrogen to the plants. Increase in crude protein was largely accredited to the soil application of micronutrients which were rapidly absorbed by the leaves, thereby activating plant metabolism, and thus leading to production of healthy green foliage, and the same was stated by Singhvi et al.51 too. Increased protein content in mulberry leaves due to micronutrient application was strongly supported by Sterling,53 through microorganisms, as it signifies increased nutritional status of mulberry leaves with regard to biochemical aspects.5
Free amino acid
Amino acids determine the leaf quality.54 Mulberry leaves, the significant constituent for silkworm nutrition are rich in amino acids.8,55 Amino acids help silkworm in food selection, and are utilised for the formation of haemolymph, development of silk glands and cocoon production. In the present study, the highest amino acid content was recorded in T8 (CuSO4 10Kg/ha + ZnSO4 10Kg/ha + FeSO4 20Kg/ha) and T4 (CuSO4 5Kg/ha + ZnSO4 5Kg/ha) treated apical mulberry leaves which may be due to the application of required amount and combined effect of zinc, copper and iron, and also by the age of the plant, growth stage and maturity.
Nitrogen
Nitrogen also determines leaf quality,54 and is the vital component of protein, nucleic acids, chlorophyll and growth hormones.56 The present study recorded maximum nitrogen content in T9 (CuSO4 15Kg/ha + ZnSO4 15Kg/ha + FeSO4 30Kg/ha) and T10 (CuSO4 20Kg/ha + ZnSO4 20Kg/ha + FeSO4 40Kg/ha) treated mulberry leaves, which corroborates the results of Rafiq et al.57. Nitrogen uptake from soil, assimilation and consumption via proliferated mulberry roots directly improve numerous strategic roles, like, transfer of energy, photosynthesis level, conversion of sugars, movement of nutrients within the plant cell, metabolic constituents, several physiological process, chlorophyll, and protein matters. Consequently, nitrogen is involved in production of leaf area, and net assimilation rate with regard to growth parameters like, leaf yield and leaf quality viz., moisture, chlorophyll ‘a’ and ‘b’, total sugar, soluble carbohydrate, reducing sugar and crude protein. Besides these, the nitrogen fixing microorganisms which increases the nitrogen accessibility might have increased the protein content in the leaves too in the present study.
Conclusion
The present investigation showed that the micronutrients improved the biochemical parameters of mulberry leaves, and indicated variations amongst the treatments due to the effect of micronutrients. Further, more research with more varied and different combination of treatments should be carried out to support the current findings in regard to the biochemical aspects of mulberry leaves so as to yield mulberry leaves of more quality and quantity.
Acknowledgment
The authors are thankful to the Department of Zoology, Scott Christian College, Nagercoil, Tamil Nadu, India for the help and support rendered.
Funding Sources
The authors received no financial support for this research.
Conflict of Interest
The authors declare no conflict of interest.
References
- Ravikumar C. Western ghats as a bivoltine region prospects, challenges and strategies for its development. Indian Silk. 1988; 26(9):39-54.
- Qader M.A. Improvement of nutritional quality of mulberry leaves. Bulletin of the Sericultural Experiment Station. 1995; 26(1):14-19.
- Sengupta K., Ray D., Singh B.D., Krishnaswami S. Studies on the effect of high dose nitrogen fertilization of soil, on the yield, chemical composition and nutritive value of mulberry leaf, as evaluated from rearing results. Indian Journal of Sericulture. 1972; 11(1):28-32.
- Lokanath R., Shivashankar K., Kasiviswanathan K. Effect of foliar application of magnesium and micronutrients to mulberry on the quality and production of cocoons. Indian Journal of Sericulture. 1986; 24:40-45.
- Subburathinam K.M., Sulochanachetty J. Effect of fortification of mulberry leaves with minerals to silkworm, Bombyx mori L. Indian Journal of Sericulture. 1991; 30(2):121-123.
- Venkataraman P., Murthy N.B., Rao K.J.V., Kamble C.K. Efficacy of foliar sprays of vermi wash and cow dung wash on biochemical and yield attributes and yield of mulberry (Morus alba L.). Karnataka Journal of Agricultural Sciences. 2009; 22(4):921-923.
- Vitti A.M., Nuzzaci A., Scopa G., Tataranni I., Sofo A. Hormonal response and root architecture in Arabidopsis thaliana subjected to heavy metals. International Journal of Plant Biology. 2014; 5:5226-5232.
CrossRef - Bose P.C., Singhvi N.R., Dutta R.K. Effect of micronutrients on yield and yield attributes of mulberry (Morus alba L.). Indian Journal of Agronomy. 1994; 39(1):97-99.
- Sinha U.S.P., Sinha A.K., Banerjee N.D., Prasad J., Chaudhary S.K., Suryanarayana N. Effect of micronutrients on the growth and leaf yield of Terminalia arjuna. Sericologia. 2006; 46(1):127-132.
- Bose P.C., Bindroo B.B. Effect of micronutrients on yield of mulberry in sub-tropical region. Journal of Crop and Weed. 2009; 5(2):142-143.
- Shilpashree K.G., Subbarayappa C.T. Effect of micronutrients on growth and yield of mulberry (Morus alba L.) and silkworm (Bombyx mori L.). The Mysore Journal of Agricultural Sciences. 2015; 49(2):167-170.
- Sowmya P., Narayanaswamy T.K. Influence of micronutrients on yield and yield attributing parameters of mulberry (Morus spp.) and silkworm (Bombyx mori L.). The Mysore Journal of Agricultural Sciences. 2015; 50(2):453-456.
- Vijayan K., Tikader A., Das K.K., Roy B.N., Pavan K.T. Genotypic influence on leaf moisture content and moisture retention capacity in mulberry (Morus spp.). Bulletin of Sericultural Research. 1996; 7:95-98.
- Shoof T.W., Lium B.W. Improved extraction of chlorophyll a and b from algae using dimethyl sulfoxide. Limnology and Oceanography. 1976; 21:926-927.
CrossRef - Hiscox J.D., Israelistam G.F. A method for extraction of chlorophyll from leaf tissue without maceration. Canadian Journal of Botany. 1979; 57:1332-1334.
CrossRef - Barnes J.D., Balaguer L., Manrique E., Elvira S., Davison A.W. A reappraisal of the use of DMSO for the extraction and determination of chlorophylls a and b in lichens and higher plants. Environmental and Experimental Botany. 1992; 32:85-100.
CrossRef - Arnon D.I. Copper enzymes in isolated chloroplasts. Polyphenoloxidase in Beta vulgaris. Plant Physiology. 1949; 24:1-15.
CrossRef - Loomis E.W., Shull A.C. Methods in plant physiology. McGraw- Hill Book Company, New York. 1937.
- Mccready R.M., Guggolz J., Silviera V., Owens H.S. Determination of starch and amylose in vegetables. Analytical Chemistry. 1950; 29:1156-1158.
CrossRef - Dubios M., Giles K.A., Hamilton T.K., Robeos R.A., Smith R. Calorimetric determination of sugars and related substances. Analytical Chemistry. 1956; 28:250-256.
CrossRef - Miller L.G. Use of dinitrosalicylic acid reagent for determination of reducing sugar. Analytical Chemistry. 1972; 31(3):426-428.
CrossRef - Wong S.Y. The use of persulfate in the estimation of nitrogen by the arnold-gunning modification of Kjeldahl’s method. Journal of Biological Chemistry. 1923; 55:427.
CrossRef - Lowry O.H., Rosenbrough N.J., Farr A.L., Randall R.J. Protein measurement with folin phenol reagent. Journal of Biological Chemistry. 1951; 193:265-267.
CrossRef - Spies J.R. Colorimetric procedure for amino acids and phenol In: Methods in enzymology. Colonick SP. and Kaplan NPO (Eds). 1955, 461-477.
- Jackson M.L. Nitrogen determination for soil and plant tissue In: Soil chemical analysis. Prentice-Hall of India, Pvt. (Ltd). New Delhi, India. 1973, 183-204.
- Chikkaswamy B.K., Paramanik R.C., Gopinath S.M., Shivashankar M. Effect of foliar nutrients on the growth, quality and yield of mulberry. Proceeding of the National Seminar on Soil Health and Water Management for Sustainable Sericulture, Bangalore, India. 2006, 95.
- Geetha T.K., Ramamoorthy K., Murugan N. Effect of foliar application of micronutrients on mulberry (Morus alba L.) leaf yield and silkworm (Bombyx mori L.) economic parameters. Life Sciences International Research Journal. 2016; 3(1):23-26.
- Machii H., Katagiri K. Varietal differences in nutritive values of mulberry leaves for rearing silkworm. Japan Agricultural Research Quarterly. 1991; 25:202-208.
- Suryanarayana N., Shivashankaramurthy T.C. Differences in amino acid contents in leaf blades of mulberry (Morus spp.) varieties. Advances in Plant Sciences. 2002; 15:475-481.
- Yokoyama T. Text book of tropical sericulture. Japan Overseas Cooperation Volunteers, Tokyo. 1974, 444-537.
- Bongale U.D., Chaluvachari. Evaluation of eight mulberry germplasm varieties by leaf biochemical and bioassay moulting studies. Sericologia. 1995; 35:83-94.
- Sujathamma P., Dandin S.B. Leaf quality evaluation of mulberry (Morus spp.) through chemical analysis. Indian Journal of Sericulture. 2000; 39:117-121.
- Rahmathulla V.K., Himanthraj M.T., Srinivasa G., Rajan R.K. Association of moisture content in mulberry leaf with nutritional parameters of bivoltine silkworm (Bombyx mori L.) Acta Entomologica Sinica. 2004; 47:701-704.
- Sastry C.R., Jolly M.S., Subramanyam M.R., Rao M.Y.R. Studies on the varietal differences in the loss of moisture from harvested mulberry leaves. Indian Journal of Sericulture. 1988; 27(53):85-91.
- Koul A., Darshan S., Gupta S.P. Seasonal fluctuations in leaf moisture characters and dry matter in mulberry in subtropics. Journal of Sericultural Science. 1996; 4:23-27.
- Sinha U.S.P., Sinha A.K., Srivastava P.P., Brahmachari B.N. Variation of chemical constituents in relation to maturity of leaves in mulberry varieties S1 and K2 under the agro-climatic conditions of Ranchi district. Indian Journal of Sericulture. 1993; 32:196-200.
- Rao D.M.R., Chikkanna, Vindhya G.S., Reddy M.M., Dasappa, Qadri S.M.H. Effect of green manure and seri-compost on soil health, leaf quality and quantity traits of mulberry under tropical conditions. Green Farming. 2011; 2(3):290-293.
- Babu C.M., Dandin S.B., Thippeswamy T., Renukeswarappa J.P. Nutritional status of mulberry leaf produced through organic farming and its impact on cocoon production. Indian Journal of Sericulture. 2013; 52(1):14-18.
- Pathak J.P.N., Iyer. Correlation between water contents of mulberry leaves, larvae and amount of urination in the spinning larvae of multivoltine race of Bombyx mori L. Indian Journal of Sericulture. 1988; 27:122-125.
- Rashmi K. Effect of organic manures and inorganic fertilizers on growth, yield and quality of mulberry leaf. M.Sc. (Sericulture) Thesis, University of Agricultural Sciences, Bangalore, India. 2005.
- Sunil S.H. Influence of organic based nutrient management on biochemical parameters of mulberry leaf and silkworm, Bombyx mori L. M.Sc. (Agricultural Biochemistry) Thesis, University of Agricultural Sciences, Bangalore, India. 2005.
- Shashidhar K.R. Department of Sericulture University of agricultural sciences Bangalore. Ph.D. (Sericulture) Thesis, University of Agricultural Sciences, Bangalore, India. 2009.
- Singhal B.K., Chakraborti S., Mala V.R., Sarkar A., Datta R.K. Photosynthesis for crop improvement in mulberry (Morus spp.) – A review. Sericologia. 2000; 40:27-55.
- Vijaya D., Yeledhalli N.A., Ravi M.V., Nagangoud A., Nagalikar V.P. Effect of fertilizer levels and foliar nutrients on M-5 mulberry leaf nutrient content, quality and cocoon production. Karnataka Journal of Agricultural Sciences. 2009; 22(5):1006-1012.
- Balashouri P., Prameeladevi Y. Effect of zinc on germination, growth, pigment content and phytomass of Vigna radiata and Sorghum bicolor. Journal of Ecobiology. 1995; 7:109-114.
- Hiratsuka E. Researches on the nutrition of the silkworm. Shangai Shkenjo Hoko Ku Technical Bulletin. 1917; 2:353-412.
- Horie Y. Quantitative requirement of nutrition for growth of silkworm Bombyx mori L. Japan Agricultural Research Quarterly. 1978; 12(4):211-217.
- Ito T. An approach to nutritional control mechanisms in silkworm Bombyx mori. Israel Journal of Entomology. 1972; 7:1-6.
- Sarker A.A., Haque M.R., Rab M.A., Absar N. Effect of feeding mulberry (Morus sp.) leaves supplemented with different nutrients of silkworm (Bombyx mori L.) Current Science. 1995; 69(2):185-188.
- Murthy V.N.Y., Ramesh H.L., Lokesh G., Munirajappa, Yadav D.B.R. Leaf quality evaluation of ten mulberry (Morus) germplasm varieties through phytochemical analysis. International Journal of Pharmaceutical Sciences Review and Research. 2013; 21(1):182-189.
- Singhvi N.R., Sarakar A., Datta R.K. Effect of seriboost on the mulberry leaf yield and some commercial characters of silkworm, Bombyx mori L. Central Sericultural Research and Training Institute, Mysore, India. 2000, 59.
- Kawase S., Michihiro K. Small molecular weight DNA of the silkworm. Bombyx mori. Insect Biochemistry. 1976; 6:355-362.
CrossRef - Sterling T.M. Transpiration: water movement through plants. Journal of Natural Resources and Life Sciences Education. 2005; 34(1):123.
CrossRef - Machii H. Varietal differences of nitrogen and amino acid contents in mulberry leaves. Acta Sericologica et Entomologica. 1989; 1:51-61.
- Ito T, Arai N. Nutrition of the silkworm Bombyx mori VIII, amino acid requirements and nutritive effects of various proteins. Bulletin of the Sericultural Experiment Station. 1965; 19:345-373.
- Barker A.V., Maynard D.N., Mills H.A. Variations in nitrate accumulation among spinach cultivars. Journal of American Society for Horticultural Science. 1974; 99:132-134.
CrossRef - Rafiq M.A., Ali A., Malik M.A., Hussain M. Effect of fertilizer levels and plant densities on yield and protein contents of autumn planted maize. Pakistan Journal of Agricultural Sciences. 2010; 47:201-208.