
Introduction
The main supply of fresh water, for home and agricultural needs in India, comes from groundwater ‘a crucial natural resource’47.Groundwater resources in different parts of India are virtually under severe continuous stress mainly as a result of the country’s fast urbanization, population increase, and related agricultural activities40. Increased groundwater-based irrigation has been a major factor in the country’s food security over the past 50 years (CGWB 2010). The amount and quality of water have both decreased in tandem with rising groundwater demand 24. India is consequently dealing with major problems caused by the declining quality of this significant natural resource41. While evaluating and categorizing the quality of elements like geology, the degree of chemical weathering of different types of rocks, the quality of restored water, and the interaction between water and rocks, and chemical characteristics of groundwater are essential factors12. Overuse of groundwater has an impact on its quality as well, especially in coastal areas where significant freshwater withdrawal causes seawater intrusion and a rise in groundwater salinity 45 (CGWB 2010). Periodic fluctuations in groundwater quality are also influenced by hydrologic parameters and temporal variations in the source and contribution of refreshed water 22 32 34. In addition to degrading the water quality, water pollution poses a threat to social progress, economic growth, and human health 44. Groundwater geochemical investigations are necessary to evaluate water quality fluctuations and determine the water’s appropriateness for diverse uses. Numerous geochemical techniques have proven effective in evaluating the groundwater quality throughout the previous ten years 50. In order to identify anthropogenic and natural sources that disturb quality of groundwater and to find interactions that occur within the aquifer, several recent researches have concentrated on assessing the natural concentrations of various ions and metals in groundwater 33 31. Numerous groundwater research works, in specific, have concentrated on evaluations of its appropriateness for drinking and irrigation 49 48 31. The most of previous research in the subject area was largely concentrated mainly on the groundwater’s geochemical evolution 48. These studies showed that excessive salinity and nitrate concentrations occasionally occur locally. In general, the hydro geochemical processes that change the chemical composition of groundwater are very variable throughout both time and geography. Therefore, thorough hydro geochemistry investigations are essential to determine, find, and assess the geochemical processes and their impact on groundwater quality 43.
Moreover, anthropogenic activities including increased use of pesticides and fertilizers as well as unchecked dumping of municipal, agricultural, and urban waste could endanger the composition of the groundwater in the studied area 48. The composition and concentration of different elements in groundwater are further altered by pesticide contamination, which is extremely erratic and impacted through a variety of mechanisms 27 47. Due to this, a number of researchers have concentrated on hydro geochemical characterization and anthropogenic groundwater contamination 33 44. Therefore, observing and evaluating the quality of groundwater is crucial for sustainable growth and suggest crucial data for water management.
The study area has a flat topography and a lot of irrigation-based farming. Monsoon (June to November) and winter (November to January) are the two main cropping seasons, with cropping intensities of 69 and 74%, respectively. The cultivation of cotton, sugarcane, cotton, and sorghum receives the majority of irrigation during these months. Pollution and the decline of groundwater resources are significant in the research area due to the extensive use of groundwater for agriculture. Any deterioration in the quality of groundwater would have serious negative effects because it is being dangerously exploited in the study region to meet rural needs. As a result, it is crucial to characterize the geochemical components and comprehend the hydro-geochemical processes that are going on in the region. Based on main ion chemistry, elemental ratios, and statistical correlations, the present study conducts a complete geochemical assessment of the groundwater in the research area and determines its suitability for irrigation and drinking.
Materials and Methodology
Study area
 |
Figure 1: Study area map of Afzalpur taluk |
The study region, Afzalpur Taluk, is situated in the northeast of Kalaburagi district, which borders the Indian state of Karnataka. The research area is located in the Survey of India (SOI) topo sheet no. 540 and is designated as area 63 C. It spans over a region of about 1056 square kilometers and located between latitudes N17º 56′ 14″ and E78º 39′ 34″ With splitting by river Bhima in the west. The region receives about 735 mm annual average precipitation mostly during south-west monsoon period. The coldest months (Nov. – Dec.) and hottest months (April to May) have temperature swings of about 44 oC. The area under examination is made up entirely of fractured basaltic rock with a black soil cover. The region is defined physio graphically by rolling topography, and extensive broad valleys interspersed with flat areas covered with black cotton soil. By far the most dominating geomorphic characteristic in the topography are broad valleys with flat-topped hills in between. In the north of the study region, the topography is undulating, and tale lands that resemble Deccan traps.
The primary source of groundwater recharge is rainfall, and the study region features several lakes, ponds, and dams that serve as significant sources of groundwater recharge. For home and agricultural use, groundwater is extracted. For the majority of the year, groundwater is the principal source of agriculture.
Hydrogeology of the Study Area
The geology of the study area contains Deccan trap, which primarily consists of tholeiitic lavas. Based on these features, mineralogical, chemical, and isotopic composition, a thorough stratigraphy has been presented 46. The lava flows in this region are tholeiitic in form and made up of olivine, pyroxene, and plagioclase phenocrysts. According to their average (wt. %), CaO2, MgO2, NaO2, and K2O abundances are 10.2, 6.2, 2.5, and 0.47%, respectively47. These compounds could be a source of dissolved SO42-, due to their oxidation, in the river. Soil carbonates are produced from calcite in basalts 27 47.
Research Methodology
The highest cations and anions in this study, viz, Ca2+, Mg2+, Na+, K+, HCO3–, SO42-, and Cl–, were chemically analyzed (table no. 1 and 2) and shown in mg/L, equivalent per million (epm), (which is equivalent to meq/L), and e.p.m 19. An appropriate level of accuracy for the chemical analysis was tested using the ion balance equation 43. Additionally, as shown in Table 1, all groundwater samples had reactivity error levels within the permitted range of 10% (Hem 1991). To accomplish these goals, the WATEQ4F program has been utilized to calculate the saturation level of groundwater with regard to specific minerals using a speciation model (b/Ball and Nordstrom 1992). In addition, Gibb’s plot was used to recognize the primary mechanisms controlling the groundwater geo-chemistry of the research part and to evaluate the useful source of dissolved chemical elements.
By drawing the main cations and anions in the Piper plot, hydro chemical facies interpretation was utilized to infer the flowing pattern and the source of geo-chemistry of groundwater (Piper 1953). SAR, RSC, Na%, residual sodium bicarbonate (RSBC), Permeability Index (P.I), potential salinity (P.S), salinity hazard, magnesium ratio (Mg R), Kelly’s ratio (KR), and chloro alkaline index were used to evaluate groundwater for irrigation purposes (CAI-1). For classifying groundwater suitability for irrigation, the Doneen permeability index 11 and the Wilcox diagram 59 were also used.
Mechanisms of Controlling Groundwater Chemistry
It’s vital to study the interaction of the lithology of the aquifer and water chemistry. Gibbs diagrams show dominating cations and anions against TDS values in the study area (Gibbs 1970). The ratio of cations (Na+ + K+) / (Na+ + K+ + Ca2+), and the anions, Cl– / (Cl– + HCO3–) serve as a function of TDS. The useful bases of dissolved elements, like, precipitation-dominance, rock-dominance, and evaporation-dominance, were evaluated using this diagram. Gibb’s diagram as depicted in Figure 2, revealed that as per the geo-chemical analysis the majority of samples in the study area fell under the type of rock-water interaction, while only a few samples found in the evaporation-dominance. This result indicated that chemical weathering of rock-forming minerals is affecting the quality of groundwater by dissolving the rock with movement, while the evaporation dominance in the sites indicated that the increase of ions Na+ and Cl– are with the increasing of the TDS.
 |
Table 1: Geo-chemical analysis of post-monsoon 2020 results of the study area |
 |
Table 2: Geo-chemical analysis of Pre-monsoon 2021 results of the study area. |
Table 3: Expressive statistics of analyzed data in groundwater and the recommended limits of WHO (2011) and IS: 10500 (BIS 2003) of each element for drinking purposes.
| Parameters | Post-monsoon | Pre-monsoon | WHO (2011) | BIS (2012) | ||||
| Min | Max | Avg | Min | Max | Avg | Max | Max | |
| pH | 6.3 | 8.1 | 6.7 | 6.1 | 7.4 | 6.3 | 6.5-8.5 | |
| EC µS/cm | 1054 | 3943 | 2387.7 | 1162 | 4398 | 2708.5 | 500 | — |
| TDS(mg/L) | 531.5 | 2148 | 1348.7 | 631 | 2487 | 1561.3 | 500 | — |
| Ca2+(mg/L) | 89.6 | 378.3 | 199.6 | 75.9 | 346.5 | 182.2 | 75 | 75 |
| Mg2+(mg/L) | 88.3 | 211.1 | 141.1 | 75.8 | 206.4 | 128.5 | 50 | 30 |
| Na+(mg/L) | 56.3 | 326.5 | 133.8 | 48.5 | 318.6 | 118.7 | 200 | — |
| K+(mg/L) | 1.24 | 35.5 | 15.9 | 1.06 | 31.5 | 13.47 | 200 | — |
| HCO3–(mg/L) | 114.3 | 641.4 | 372.6 | 103.8 | 587.4 | 332.2 | 500 | 200 |
| Cl–(mg/L) | 114.1 | 543.2 | 332.01 | 105.8 | 468.9 | 294.9 | 250 | 250 |
| SO4–(mg/L) | 121.1 | 393.6 | 230.4 | 104.3 | 326.9 | 207.8 | 250 | 200 |
| NO3–(mg/L) | 8.56 | 14.8 | 12.5 | 6.4 | 13.1 | 10.3 | 45 | 45 |
| TH(mg/L) | 187.2 | 541.8 | 340.7 | 161.8 | 433 | 298.5 | 100 | 300 |
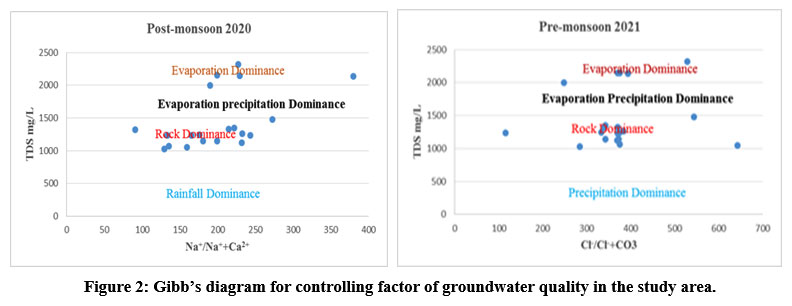 |
Figure 2: Gibb’s diagram for controlling factor of groundwater quality in the study area. |
Hydro Chemical Facies
Groundwater flowing pattern is showed in the piper trilinear diagram. This is a good tool for plotting out the main source of the geo-chemistry of groundwater, mainly used for hydro geo-chemical facies. Fig. 3 shows the Piper trilinear diagram. There were two main identified forms of hydro chemical water. These have different forms of Ca2+, Mg2+, and Cl– water. The research area’s groundwater samples are primarily of the Ca-Cl water type, which suggests that the water is a final result. A minority of the samples have Ca2+-Mg2+Cl– water types, which reveal that strong acid (Cl– and SO42-) is more effective than weak acid (Na+ + K+) and alkaline earth (Ca2+ + Mg2+) is more potent than both (HCO3- and CO32-).
 |
Figure 3: Piper trilinear diagram for the groundwater samples both post and pre-monsoon of the study area. |
Geochemical Modeling
All groundwater chemical reactions such as dissolution and precipitation, ion exchange, and adsorption by clay particles are calculated using geochemical models 30. The speciation model was used to determine the saturation index (SI) of minerals in the groundwater samples, . The SI of a specific mineral expresses how saturated the mineral is in relation to the environment. According to 13, the value of saturation index is expressed as follows:
Log KIAP = SI
IAP stands for the ion activity product of the dissociated chemical types in solution, while KSP stands for the mineral’s solubility product. The negative SI means that the groundwater is under saturated for that specific mineral. If SI is greater than 0, it is expected that the mineral has been dissolved to the saturation in the groundwater and cannot be dissolved further. A common ion effect or incongruent dissolution can also cause an oversaturation. Nearly all groundwater samples from the research region were oversaturated for calcite and dolomite and under saturated for anhydrite, gypsum, and halite.
Geochemical Evolution of Groundwater
Low dissolved ion concentrations in rainfall give groundwater its initial composition. Additional Ca2+, Mg2+, Na+, SO42- HCO3–, Cl–, and SiO2 are added into the water throughout its return journey to the ocean as a result of rock weathering and evaporation. The mineralogy of the rocks, with which water encounters during flow, and the speed of the water flow determine the concentrations of the ions in water. The cations are more abundant in the research region in the following order, Ca2+ > Mg2+ > Na+ > K+; whereas the anions were present in the following order, HCO3– > Cl- > SO42-. The breakdown of limestone, dolomite, gypsum, and anhydrite minerals, which make up the majority of the study area’s rocks, are the primary cause of the calcium and magnesium found in the groundwater. The cation exchange process also produces calcium ions 7. The concentration of calcium ions in the study area varies from 89.6 mg/L to 378.3 mg/L having a mean value of 199.6 mg/L for the post-monsoon period, and from 75.9 mg/L to 346.5 mg/L having a mean value of 182.2 mg/L for the pre-monsoon period, respectively. This shows that the concentration of Ca2+ ions in the studied region is comparatively higher than that of magnesium ions. Ca2+ + Mg2+ vs. (HCO3– + SO42-) is plotted in Fig 4a. The most of the samples, as shown in Figure 4a, are above the equiline, which indicated that the carbonate weathering process is the main mechanism distributing calcium and magnesium ions into groundwater. Groundwater samples from the research area’s plot of (Na+) vs. (Cl–) are shown in fig. 4b. The plot demonstrates that the Na+/Cl– ratios are >1, which normally means, sodium was released through silicate weathering. The silicate weathering is further verified by the HCO3– vs. Na+ plot in fig. 4c, all samples were below the equiline 14. This indicates that the carbonate and the silicate weathering are the two main processes taking place in the study area’s aquifer.
 |
Figure 4a: plot of (Ca2++Mg2+) vs. (HCO3–+SO42-) of the study area. |
 |
Figure 4b: plot of (Na+) vs (Cl–) of the study area |
 |
Figure 4c: plot of (HCO3–) vs (Na+) of the study area |
Drinking and Irrigation Water Quality
pH, EC, TDS, TH, RSC, RSBS, P.I., P.S., salinity hazard, magnesium ratio, %Na+, KR, and chloro alkaline index are a few of the metrics that can be used to determine, whether the groundwater is suitable for drinking and irrigation (CAI-10 as display in table 3 and 4).
Table 4: Irrigation water quality parameters of the study area. Post-monsoon 2020
| Sample | RSC | RSBS | P.I | P.S | SAR | Mg R | %Na+ | K.R | CAI-1 |
| S1 Dixanga | 226 | 143.1 | 103.05 | 410.1 | 0.184 | 39.48 | 32.33 | 130.0 | 297.9 |
| S2 Jevargi | 302.9 | 236.8 | 130.15 | 276.7 | 0.254 | 47.79 | 37.50 | 122.2 | 215.4 |
| S3 Allagi | 213.7 | 129.9 | 95.72 | 420.2 | 0.165 | 38.59 | 29.11 | 152.9 | 298.1 |
| S4 Hosur | 183.1 | 120.2 | 94.93 | 454.45 | 0.175 | 39.65 | 30.92 | 145.8 | 336.7 |
| S5 Mannur | 282.1 | 240.3 | 125.96 | 472.5 | 0.277 | 49.66 | 40.08 | 133.6 | 357.7 |
| S6 Mashal | 337.2 | 191.6 | 117.09 | 449.8 | 0.091 | 41.83 | 21.30 | 129.5 | 333.9 |
| S7 Gour | 483.5 | 279.7 | 158.19 | 343 | 0.335 | 52.13 | 44.46 | 99.0 | 233.6 |
| S8Udachan | 454.5 | 271.1 | 113.12 | 501.75 | 0.135 | 41.61 | 22.30 | 193.9 | 364.1 |
| S9Diggi ross | -146.2 | -50.2 | 48.73 | 353.85 | 0.164 | 54.15 | 26.03 | 195.0 | 274.9 |
| S10 Bankalga | 236.2 | 154.5 | 112.76 | 269.75 | 0.182 | 46.66 | 27.32 | 113.1 | 113.3 |
| S11Shirwad | 314 | 171.4 | 107.43 | 666.3 | 0.507 | 38.32 | 50.70 | 124.8 | 468.7 |
| S12 Afzalpur | 459 | 301.8 | 117.58 | 610.85 | 0.089 | 48.26 | 16.46 | 211.4 | 543.0 |
| S13 Atanoor | 114.5 | 57.6 | 80.21 | 454.5 | 0.221 | 45.23 | 31.78 | 157.1 | 364.8 |
| S14karbhosga | 314.3 | 157.3 | 117.00 | 389.9 | 0.269 | 33.49 | 35.69 | 89.11 | 267.7 |
| S15 Dannur | 782.8 | 483.2 | 194.39 | 351.15 | 0.325 | 36.89 | 41.02 | 93.53 | 243.6 |
| S16Chinmgera | 133.6 | 126 | 100.32 | 473.95 | 0.185 | 36.83 | 29.06 | 125.0 | 356.0 |
| S17Chodapur | 210.3 | 145.1 | 100.19 | 599.4 | 0.186 | 38.68 | 29.45 | 144.7 | 472.9 |
| S18Hasargundgi | 234.7 | 150.1 | 102.36 | 585.6 | 0.161 | 37.40 | 26.61 | 139.0 | 466.9 |
| S19Ghangapur | 207.9 | 137 | 93.42 | 500.55 | 0.170 | 42.75 | 27.30 | 173.1 | 373.3 |
| S20Bandarwad | 86.3 | 13.9 | 77.34 | 360.65 | 0.109 | 30.17 | 18.11 | 163.8 | 274.0 |
Table 5: Irrigation water quality parameters for study area. Pre-monsoon 2021
| Sample | RSC | RSBS | P.I | P.S | SAR | Mg R | %Na | K.R | CAI-1 |
| S1Dixanga | 137.2 | 112.5 | 101.29 | 342.3 | 0.185244 | 38.03 | 32.52 | 1.08 | 246.9 |
| S2 Jevargi | 368.6 | 223 | 130.25 | 247.55 | 0.243014 | 49.44 | 36.26 | 1.17 | 194.7 |
| S3 Allagi | 197.1 | 108.2 | 91.75 | 369.35 | 0.16594 | 40.46 | 28.68 | 1.49 | 258.1 |
| S4 Hosur | 61.2 | 66.2 | 85.0 | 431.85 | 0.164409 | 38.61 | 29.22 | 1.37 | 326.9 |
| S5 Mannur | 293.2 | 171.7 | 116.19 | 433.6 | 0.262322 | 47.03 | 38.56 | 1.13 | 326.2 |
| S6 Mashal | 123.5 | 131 | 104.38 | 424.3 | 0.088054 | 42.41 | 20.77 | 1.17 | 315.3 |
| S7 Gour | 264.1 | 202.7 | 141.49 | 318.4 | 0.369901 | 53.09 | 46.29 | 8.7 | 217.9 |
| S8 Udachan.Hutti | 355.8 | 251.4 | 114.06 | 443.15 | 0.136952 | 40.13 | 22.28 | 1.74 | 324.4 |
| S9 Diggi cross | -135 | -36 | 47.93 | 299.6 | 0.156402 | 57.37 | 25.00 | 1.88 | 237.3 |
| S10 Bankalga | 287.9 | 128.3 | 109.96 | 250.6 | 0.13477 | 48.12 | 21.54 | 1.02 | 105.2 |
| S11 Shirwad | 261.6 | 157 | 107.22 | 552.05 | 0.564093 | 40.22 | 53.30 | 1.15 | 387.7 |
| S12 Afzalpur | 390.3 | 263.9 | 111.81 | 533.1 | 0.078166 | 49.03 | 14.54 | 2.06 | 468.7 |
| S13 Atanoor | 263.3 | 57.8 | 80.84 | 378.85 | 0.219171 | 46.11 | 31.35 | 1.44 | 298.4 |
| S14 Karbhosga | 212.9 | 159.8 | 123.91 | 343.6 | 0.282057 | 33.74 | 36.56 | 7.6 | 236.2 |
| S15 Dannur | 688 | 449.5 | 200.63 | 312.95 | 0.304862 | 38.49 | 39.66 | 8.7 | 212.9 |
| S16 Chinmgera | 292.2 | 118.4 | 100.20 | 436.5 | 0.167386 | 36.22 | 27.03 | 1.18 | 327.2 |
| S17 Chowdapur | 280.5 | 153.6 | 110.15 | 557.25 | 0.196041 | 34.11 | 30.31 | 1.09 | 438.5 |
| S18Hasargundagi | 294 | 131.8 | 101.58 | 539.1 | 0.14663 | 35.57 | 24.72 | 1.25 | 426.5 |
| S19Ghanagapur | 234.8 | 127.8 | 93.97 | 441 | 0.164449 | 42.01 | 26.74 | 1.58 | 324.2 |
| S20Bandarwad | 128.2 | 22 | 78.93 | 323.55 | 0.103036 | 29.85 | 17.23 | 1.47 | 216.3 |
Drinking Water Quality
Suitability for drinking was assessed by comparing the groundwater samples of the research region w.r.t. the values of the accepted/permissible guidelines58. TDS of the study area varied between 531.5 mg/L to 2148 mg/L and the average value 1348.7 mg/L (post-monsoon 2020) and in pre-monsoon the TDS value was 631 mg/L to 2487 mg/L and the average value is 1561.3 mg/L. The TDS values exceeded the suggested permissible limit during both pre- and post-monsoon seasons. Nevertheless, composition of the most of cations and anions are high as per WHO guidelines for drinking purposes. Additionally, as indicated in Table 3, the TH of the study region varies from 161.8 to 433 mg/L in the pre-monsoon period to 187.2 to 541.8 mg/L in the post-monsoon period, having a mean value of 340.2 mg/L. According to 54 and as shown in tables 1 and 2, the analyzed results of TH showed, the groundwater of the study area falls under the very hard water type category. As a result, according to TDS and TH, hard water leads to greater detergent use during cleaning, and some research links it to heart disease 55. The following equation was used to determine the total hardness (TH) in accordance with 56. 3. 35. Ca2+ and Mg2+ concentrations are represented in mg/L as CaCO3 in the equation TH= 2.5 Ca2+ + 4.1 Mg2+ (8). The presence of soap action in water is caused based on the precipitation of Ca2+ and Mg2+ salts such as carbonate, sulphate, and chlorides. Scaling affects irrigation pipes, boilers, and cooking appliances due to hard water. The correlation among the various geo-chemical parameters was established, as shown in Tables 7 and 8, to assess the level of correlation among the various geo-chemical parameters impacting groundwater quality in the research area A strong association was observed between TH and Ca2+, Mg2+, and Cl–, respectively, which indicated that CaCl2 and MgCl2 are primarily responsible for the hardness of groundwater.
Table 6: Water Classes (After Sawyer and McCarthy, 1967).
| Total Hardness as CaCO3 (mg/L) | Classification of water |
| <75 | Soft |
| 75 to 150 | Moderately hard |
| 150 to 300 | Hard |
| >300 | Very hard |
Table 7: Correlation matrix for different water quality parameters in the study area of post-monsoon 2020.
| pH | TDS | Ca2+ | Mg2+ | Na+ | K+ | HCO3– | Cl– | SO42- | NO32- | |
| pH | 1 | |||||||||
| TDS | -0.393 | 1 | ||||||||
| Ca2+ | -0.033 | 0.603 | 1 | |||||||
| Mg2+ | -0.043 | 0.428 | 0.534 | 1 | ||||||
| Na+ | -0.242 | 0.247 | -0.024 | -0.226 | 1 | |||||
| K+ | 0.467 | -0.351 | -0.249 | -0.168 | -0.208 | 1 | ||||
| HCO3 | -0.094 | 0.079 | 0.204 | -0.042 | 0.032 | -0.033 | 1 | |||
| Cl– | -0.170 | 0.599 | 0.3333 | 0.466 | 0.247 | -0.034 | 0.223 | 1 | ||
| SO42- | -0.351 | 0.074 | 0.123 | -0.279 | 0.569 | -0.191 | 0.047 | 0.072 | 1 | |
| NO32- | -0.209 | 0.085 | 0.087 | 0.008 | -0.221 | -0.063 | 0.342 | 0.168 | -0.256 | 1 |
Table 8: Correlation matrix for different water quality parameters in the study area of Pre-monsoon 2021
| pH | TDS | Ca2+ | Mg2+ | Na+ | K+ | HCO3 | Cl– | SO42- | NO32- | |
| pH | 1 | |||||||||
| TDS | -0.518 | 1 | ||||||||
| Ca2+ | -0.125 | 0.528 | 1 | |||||||
| Mg2+ | -0.061 | 0.400 | 0.498 | 1 | ||||||
| Na+ | -0.160 | 0.288 | -0.038 | -0.184 | 1 | |||||
| K+ | 0.412 | -0.498 | -0.185 | -0.181 | -0.161 | 1 | ||||
| HCO3– | -0.114 | 0.127 | 0.338 | 0.020 | -0.054 | -0.135 | 1 | |||
| Cl– | -0.090 | 0.549 | 0.373 | 0.364 | 0.215 | 0.033 | 0.269 | 1 | ||
| SO42- | -0.345 | 0.173 | 0.127 | -0.368 | 0.445 | -0.173 | 0.080 | 0.072 | 1 | |
| NO32- | -0.148 | -0.058 | -0.027 | -0.022 | -0.091 | 0.016 | 0.429 | 0.149 | -0.302 | 1 |
Irrigation Water Quality
The impact of mineral content of the water on the soil and plants defines the suitability of groundwater for irrigation. The effect of salt on soils results in changes in soil permeability and structure, which have an impact on plant growth.
Residual Sodium Carbonate
The following equation represents residual sodium carbonate (RSC). It estimates the risks of carbonate and bicarbonate of irrigation water quality.
RSC is equal to (Ca2+ + Mg2+) – (HCO3– + CO32-).
Where, all ionic concentrations are measured in meq/L. Table 9 shows the RSC categorization of irrigation water 36. Water with more than 2.5 meq/L of RSC is not suitable for irrigation, but water with less than 1.25 meq/L is suitable for irrigation 57.
Table 9: Classification of water based on RSC (after Richards, 1954).
| RSC value | Water quality |
| <1.25 | Suitable |
| 1.25 to 2.5 | Marginal |
| >2.5 | Unsuitable |
According to Eaton 17, Na+ + HCO3– remains as a residue after evaporation and the pH level of soil tend to rise to 3(?? Not clear) if irrigation water includes more HCO3– + CO32- than their corresponding Ca2+ + Mg2+ 17. Water quality declines when total carbonate levels are higher than total calcium and magnesium levels 39. The computed RSC standards of the study regions groundwater samples ranged from -8.02 to 551.8 mg/L having a mean value of 102.06 mg/L and -8.5 to 604.2 mg/L having a mean values of 135.8 mg/L, respectively, in the post-monsoon period. Negative RSC suggests that sodium accumulation is improbable because there is more than enough calcium and magnesium than what can precipitate as carbonates 40. Therefore, groundwater is suitable for irrigation in the research region, and as shown in Figure 9, the study area’s minimum RSC values are spread in both the southeast and the centre.
Residual Sodium Bicarbonate (RSBC).
The following formula was used to compute residual sodium carbonate (RSBC) 9.
HCO3– – Ca2+ equals RSBC.
According to the RSBC standards proven by 9 and results revealed that the groundwater with RSBC up to 5 meq/L was considered suitable for irrigation 25. According to the values of RSBC in the research region, which varied from -4.0 to 527.7 mg/L having a mean value of 103.2 mg/L in the post-monsoon period and 4.3 to 550.5 mg/L having a mean value of 102.3 mg/L, groundwater was suitable for irrigation.
Permeability Index (P.I).
The permeability of the soil is impacted by long-term irrigation with high Na+, and HCO3– concentration water. The Class I and Class II types of water are considered for irrigation with 50-75% or having maximum penetrability, according to Doneen’s standards determined if water is suitable for irrigation based on permeability index (P.I) 11. As a result, water can be categorized by Class I, Class II and Class III. Class III type of water can only have at most permeability of 25% before it becomes unfit. Soil permeability is impacted by irrigation water usage, which raises the levels of Na+, Mg2+, and HCO3– in that soil 9.
When compared to the total ions in meq/L, the permeability index is used to measure how suitable water is for irrigation. It is represented,
P.I = (Na+ + HCO3) / (Ca2++Mg2++Na+) 100
The current study, groundwater samples’ P.I. ranged from 48.73 to 194.39% having a mean value of 109.50 in the post-monsoon period and from 47.93 to 200.63% having a mean value of 107.58% in pre-monsoon period. It was noted that all groundwater samples categorized as class II type. The P.I. values of existing type of groundwater irrigation suggest that it could be use beneficially for irrigation purpose.
Potential Salinity (P.S)
For determining whether water is suitable for irrigation purposes, Doneen proposed the crucial criterion known as “potential salinity”. It is defined as the sum of the contents of chloride and sulphate in meq/L.
Potential Salinity (P.I) = Cl– + ½ SO4 2-
Doneen 10 categorized the irrigation water into three classifications based on the possible salinity, as showed in Table 10. The analysis of most of the groundwater samples in the research region have shown potential salinities ranging from 1.4 to 75.8 meq/L, with mean value of 24.38 meq/L in the post-monsoon period, and from 3.1 meq/L to 397.9 meq/L, with a mean value of 82.42 meq/L in the pre-monsoon period. This indicates high potential salinity levels. However, it is discovered that the groundwater of the research region is classified as Class III for irrigation purposes, therefore the groundwater should be used in cases where the soil has a high permeability 18.
Table 10: Categorization of irrigation water quality using potential salinity index.
| Water category | Class-1 | Class-2 | Class-3 |
| Soil of low permeability | <3 | 3.5 | >5 |
| Soil of medium permeability | <5 | 5-10 | >10 |
| Soil of high permeability | <7 | 7-15 | >15 |
Sodium Adsorption Ratio (SAR).
The amount of Na+ present in the soil is thought to be a main indicator of how the soil will react with other elements and lose permeability. Because sodium (alkali) adsorption ratio is directly associated to the adsorption of Na+ in soil and is an essential factor to determine its suitability for irrigation. It is considered to be a better indicator of sodium (alkali) hazard from irrigation water. Calculated SAR can be calculated by the equation as shown below.
SAR: Na+/ [(Ca2+ Mg2+)/2]1/2
Where all ionic concentrations are expressed in meq/L. The research area’s SAR varies from 0.98 to 5.9, with a mean value of 2.0 in the post-monsoon season, and from 0.9 to 5.7, with a mean value of 2.0 in the pre-monsoon period. The SAR values in studied region were determined to be 10 and thus categorized as S1 i.e. excellent for irrigation (Todd and Mays 2005 and Richards 1954). The research area’s southeastern and central regions show a concentration of SAR, which indicated groundwater in these regions is perfect for irrigation.
Salinity Hazard.
The total Na+ concentration is the most essential factor for the salinity tolerance of plants and water availability. The quickest way to assess the salinity hazard is to measure the EC, which is measured in (µS/cm), because there is a direct association between EC and the Na+ concentration of water 6. US Salinity Laboratory Staff 36, categorized irrigation water into four classes based on sodium concentration, as shown in table 11. In the post-monsoon period, it was discovered that the EC values of the research region varied from 1054 to 3943 µS/cm with a mean value of 2387.75 µS/cm, and from 1162 to 4398 S/cm with a mean value of 2708.5 µS/cm, which is regarded as C4 high salinity hazard class in pre-monsoon 2021. The US salinity diagram, which plots the SAR versus EC as shown in fig. 12, was used to rate irrigation waters. All groundwater samples from the study area falls under suitable C4-S2 group, which means more salinity or average sodium type. Because of this, crops with tolerance to clay, sandy loam, and loamy sand soil textures can be grown using groundwater of the C4-S2 class (Kanwar and Kanwar 1969). These requirements lead to the conclusion that the research area’s groundwater is suitable for irrigation.
Table 11: Salinity hazards of irrigation water based on EC values (Richards, 1954).
| EC of irrigation water (μS/cm) | Salinity Class | Salinity Hazards |
| 100 – 250 | C1 | very low |
| 250 – 750 | C2 | Low |
| 750 – 2250 | C3 | Medium |
| 2250 – 4000 | C4 | High salinity |
Magnesium Ratio
Most water samples have balance between calcium and magnesium. The index of magnesium hazard is a ratio that was proposed by (Paliwal 1972). This suggests that high magnesium hazard values > 50% have a negative impact on crop productivity due to increased soil alkalinity and impact on agricultural yield.
![]()
Where the concentration of total cations is expressed as meq/L.
Magnesium hazard values in the research region ranged between 30.17 and 54.15%, with a mean value of 42.60 % in the post-monsoon season, and between 29.85 and 57.37 %, with a mean value of 42%, i.e. magnesium hazard ratio 50%, which is considered as for irrigation.
Sodium Percentage (%Na+)
Due to the fact that Na+ reacts with soil, which reduces its permeability, sodium is a major ion used to classify irrigation water. It was calculated as %Na+.
![]()
Whereas, according to Wilcox, all ionic concentrations are represented in meq/L, Na+ is a common indicator to determine a natural water’s suitability for irrigation purposes 59. When irrigation water has a high Na+ concentration, clay particles adsorb Na+, which displaces Mg2+ and Ca2+ ions. This reduction in permeability caused by the exchange of Na+ in water for Ca2+ and Mg2+ in soil finally leads to poor internal drainage and such soil is typically hard when dry (Collins and Jenkins 1996, Saleh 1999). The study area’s % Na+ values range from 16.46 to 50.70% with a mean value of 30.19% in the post-monsoon and from 29.85 to 57.37% with a mean value of 30.13% in the pre-monsoon period. These values fall into the good to permissible category, demonstrating that the groundwater in the studied area is suitable for irrigation.
Kelly’s Ratio (KR)
Kelly’s ratio is used to categorize the water for irrigation purposes. A Kelly’s index (>1) suggests that the water is too salty21. Water with KR (1) is therefore considered for irrigation. The following formula was used to determine KR, where all ions are represented in meq/L.

In this study, KR values ranged from 1.4 to 11.3 meq/L with a mean value of 3.0 meq/L in the post-monsoon period and from 1.4 to 10.5 meq/L with a mean value of 3.0 meq/L in the pre-monsoon period, which is 1. The research area’s groundwater is therefore unsuitable for irrigation.
Ion-Exchange Processes.
It is crucial to recognize the changes in chemical composition that groundwater experiences as it travels through the subsurface 1. The chloro alkaline index-1 was calculated, as proposed by 38, to identify ion exchange between the groundwater and its environment during residence. The CAI-1 index’s value may be either positive or negative. If the result is positive, it describes how the ions from water Na+ and K+ and the ions from rocks Mg2+ and Ca2+ exchange. In addition, if the index is negative, it signifies that water’s Mg2+ and Ca2+ ions are exchanging with rock-derived Na+ and K+ ions, indicating chloro alkaline disequilibrium. The following formula was used to determine the chloro alkaline index-1.
Chloro-alkaline index = Cl– (Na+ + K+) / Cl–
Where all ionic compounds were measured in meq/L. The groundwater samples of the research area were used to determine the chloro alkaline index-1, and discovered that all of the CAI-1 values are Negative. The CAI-1 values ranged from 1.0 to 6.5 meq/L with average of 2.6 meq/L in post-monsoon and 0.6 to 6.6 meq/L with average value of 2.7 meq/L. The results indicated that all of the groundwater samples display indirect Base Exchange reaction.
Conclusion
The groundwater in the studied area is brackish and exceedingly hard. The composition of main ions depicted following order. Na+ is followed by Ca2+, Mg2+, K+, SO42-, Cl–, and HCO3–. Strong acids outperform weak acids, while alkali earth outperforms other alkalis. Genetic water types with the chemical composition Ca-Cl– and Ca2+ – Mg2+ – Cl– predominate in groundwater. The results of saturation index showed that all groundwater samples from the research region were under saturated with respect to sulphate minerals and more saturated with respect to carbonate minerals. According to Gibb’s plot, the chemical weathering of rock-forming minerals is the predominant process, where there is interaction between the rock chemistry and percolating underground waters. The research area’s southern and central regions have concentrated groundwater that is good and acceptable for irrigation, according to the irrigation parameters. The major ion composition of groundwater indicated that the water is unfit for human consumption.
Acknowledgments
The authors are grateful to Gulbarga University, Kalaburagi for financial assistance to completion of research work. The authors would like to thank to MSV laboratory Bellary for providing the laboratory facility for the research work.
Conflict of Interest
There is no conflict of interest.
References
- Al-Ahmdi, M. E. (2013). Hydro chemical characterization of groundwater in wadi Sayyah, Western Saudi Arabia . Applied Water Science. 3, 721-732.
- Appelo, C.A.J., & Postma, D. (2005). Geochemistry, groundwater and pollution. Balkema, Rotterdam, The Netherlands, 649pp.
- Ball, J.W., & Nordstrom, D.K. (1992). Geochemical model to calculate speciation of major, trace and redox elements in natural waters. Report, U.S. Geological Survey, International Groundwater Modeling Center, U.S.A.
- Chandu, S. N., Subbarao, N.V., & Prakash, S. R. (1995). Suitability of groundwater for domestic and irrigation purposes in some part of Jhansi District, U. P. Bhujal Newa, 10, 1, 12-17.
- Chhabra, R. (1996). Soil salinity and water quality. A.A. Balkema Publishers, U.S.A. 284pp. Kanwar, J.S., & Kanwar, B.S. (1969). Quality of irrigation waters. Trans. 9th Intern. Congr. Soil Sci.1, 391-403.
- Collins, R., & Jenkins, A. (1996). The impact of agricultural land use on stream chemistry in the middle hills of the Himalayas, Nepal. J. Hydrology, 185,71-86.
- Dasaram, B., & Ramesh, S.L. (2007). Assessment of groundwater quality in structurally deformed granitic terrain in Hyderabad, India.. Environmental Monitoring and Assessment, 113, 117-127.
- Gupta, S.K. , & Gupta, I.C. (1987). Management of saline soils and water. Oxford and IBH Publication Coy, New Delhi, India, 399pp.
- Doneen, L.D. (1961). The influence of crop and soil on percolating water. Proceedings of Groundwater Recharge Conference, California, U.S.A.
- Doneen, L.D. (1964). Notes on water quality in agriculture. In Davis, C.A., Water Science and Engineering, University of California.
- Domenico PA (1972) Concepts and models in groundwater hydrology. McGraw-Hill, New York.
- Deutsch, W.J. (1997). Groundwater geochemistry: fundamentals and applications to contamination. Lewis Publishers, New York, , U.S.A, 221pp.
- Datta, P.S., & Tyagi, S.K. (1996). Major ion chemistry of groundwater in Delhi area: chemical weathering processes and groundwater flow regime. J. Geol. Soc. India. 47,179-188.
- Gibbs, R.T. (1970). Mechanisms controlling world’s water chemistry. Science, vol., 170, 1088-1090.
- Gupta, S.K. , & Gupta, I.C. (1987). Management of saline soils and water. Oxford and IBH Publication coy, New Delhi, India, 399pp.
- Eaton, E.M. (1950). Significance of carbonate in irrigation water. Soil Sci. 69, 12-133.
- El-Nakhal, H.A., & Ashour, M.M. (1986). Water quality of the area west of Karak City, Jordan. Qatar Univ. Sci. Bull, 6, 273-285.
- Fetter, W.C. (2001). Applied hydrogeology. 4th ed. Prentice-Hall, Inc. 598pp. Saether, O.M., & De-Caritat, P. (1997). Geochemical processes, weathering and groundwater recharge in catchments. Balkema, Rotterdam. The Netherlands, 400pp.
- Hem, J.D. (1991). Study and interpretation of chemical characteristics of natural Water. (3rd ed). Book 2254: Scientific publ. Jodhpur, India.
- Kelly, W.P. (1951). Alkali soils- their formation properties and reclamation. 3rd ed. Reinhold publication, New York, U.S.A, 92pp.
- Laluraj CM, Gopinath G (2006) Assessment on seasonal variation of groundwater quality of phreatic aquifers—a river basin system. Environ Monit Assess 117:45–57.
- Mahapatra SS, Sahu M, Patel RK, Panda BN (2012) Prediction of water quality using principal component analysis. Water Qual Expo Health 4:93–104. doi:10.1007/s12403-012-0068-9.
- Nandimandalam JR (2012) Evaluation of hydro geochemical processes in the Pleistocene aquifers of Middle Ganga Plain, Uttar Pradesh, India. Environ Earth Sci 65:1291–1308.
- Oladeji, O.S., Adewoye, A.O., & Adegbola, A.A. (2012). Suitability assessment of groundwater resources for irrigation around Otte Village, Kwara State, Nigeria. Int. J. of Applied Sciences and Engineering Research, Vol. 1, Issue 3, 434-445.
- Paliwal, K.V. (1972). Irrigation with saline water. Monogram No.2 (new series). I A R I, New Delhi, 198pp.
- Pawar N. J., Kale V. S., Atkinson T. C., and Rowe P. J. (1988) Early Holocene waterfall tufa from semi-arid Maharashtra Plateau (India). J. Geol. Soc. India 32, 513–515.
- Prasanna MV, Chidambaram S, Senthil KG, Ramanathan AL, Nainwal HC (2011) Hydrogeochemical assessment of groundwater in Neyveli Basin, Cuddalore District, South India. Arab J Geosci 4:319–330.
- Paliwal, K.V. (1972). Irrigation with saline water. Monogram No.2 (new series). I A R I, New Delhi, 198pp.
- Piper, A.M. (1953). A graphical procedure in geochemical interpretation of water analyses. Trans. Am. Geophys. Union . 25, 914-923.
- Plummer, L.N. (1984). Geochemical modeling: A comparison of forward and inverse method. In: Hitchon, B., & Wallick, E.I. (Eds.). Proceeding of First Canadian Conference of Hydrogeology: Partial application of groundwater geochemistry. National Water Well Association, Canada, Worthington, OH, U.S.A.
- Ramesh K, Elango L (2011) Groundwater quality and its suitability for domestic and agricultural use in Tondiar river basin, Tamil Nadu, India. Environ Monit Assess. doi:10.1007/s10661-011- 2231-3.
- Raju NR (2006) Seasonal evaluation of hydro-geochemical parameters using correlation and regression analysis. Curr Sci 91(6):820–826.
- Raju NJ (2007) Hydrogeochemical parameters for assessment of groundwater quality in the upper Gunjanaeru River basin, Cuddapah district, Andhra Pradesh, South India. Environ Geol 52:1067–1074.
- Rouxel M, Molenat J, Ruiz L, Legout C, Faucheux M, Gascuel- Odoux C (2011) Seasonal and spatial variation in groundwater quality along the hillslope of an agricultural research catchment (Western France). Hydrol Process 25(6):831–841.
- Raghunath, H.M. (2007). Groundwater. 3rd ed., New age International Publishers, 504pp.
- Richards, L.A. (1954). Diagnosis and improvement of saline and alkaline soils. US Department of Agriculture Hand Book, 60pp.
- Saleh, A., Al-Ruwaih, F. M., & Shehata, M. (1999). Hydrogeochemical processes operating within the main aquifers of Kuwait. J. Arid Environments, 42,195-209.
- Schoeller, H .(1977). Geochemistry of groundwater. In groundwater Studies- An international guide for research and practice (ch. 15, p.p. 1-18) .Paris : UNESCO.
- Sundaray, S.K., Nayak, B.B. , & Bhatta, D. (2009). Environmental studies on river waters quality with reference to suitability for agricultural purposes: Mahanadi river estuarine system, India- a case study, Environmental Monitoring and Assessment, 155, 227-243.
- Satyanarayanan, M., Balaram, V., Al Hussin, M. S., Al Jemaili, M. A., Rao, T.G., Mathur, R., Satapathy I, Syed TH (2015) Characterization of groundwater potential and artificial recharge sites in Bokaro District, Jharkhand (India), using remote sensing and GIS-based techniques. Environ Earth Sci. doi: 10.1007/s12665-015-4474-8.
- Sharma ND, Patel JN (2010) Evaluation of groundwater quality index of the urban segments of Surat city India. Int J Geol 4:1–4.
- Sawyer CN, McCarty DL (1967) Chemistry of sanitary engineers, 2nd edn. McGraw-Hill, New York, p 518.
- Saether, O.M., & De-Caritat, P. (1997). Geochemical processes, weathering and groundwater recharge in catchments. Balkema, Rotterdam. The Netherlands, 400pp.
- Selvam S, Manimaran G, Sivasubramanian P, Balasubramanian N, Seshunarayana T (2013) GIS-based evaluation of water quality index of groundwater resources around Tuticorin coastal city. Environ Earth Sci, South India. doi:10.1007/s12665-013-2662-y.
- Singh K, Singh D, Hundal HS, Khurana MPS (2013) an appraisal of groundwater quality for drinking and irrigation purposes in southern part of Bathinda district of Punjab, northwest India. Environ Earth Sci. doi: 10.1007/s12665-013-2272-8.
- Sophiya MS, Syed TH (2013) Assessment of vulnerability to sweater intrusion and potential remediation measures for coastal aquifers: a case study from eastern India. Environ Earth Sci 70(3):1197–1209. doi:10.1007/s12665-012-2206-x.
- Subbarao K. V. and Hooper P. R. (1988) Reconnaissance map of the Deccan Basalt Group in the Western Ghats, India. In Deccan Flood Basalts (ed. K. V. Subbarao), pp. 69–90, Geological Society of India.
- Subbarao K. V., Bodas M. S., Khadri S. R. F., Bean J. E., Kale V., Widdowson M., Hooper P. R., and Walsh J. N. (2000) FieldExcursion Guide to the Western Deccan Basalt Province. Penrose Deccan 2000.
- Sukeshwala R., Avasia K., and Gangopadhyay M. (1972) Observations on the occurrence of secondary minerals in the Deccan Traps of western India. The Indian Mineralogist 13, 50–68.
- Syed TH, Lakshmi V, Paleologos E, Lohmann D, Mitchell K, Famiglietti JS (2004) Analysis of process controls in land surface hydrological cycle over the continental United States. J Geophys Res 109:D22105. doi:10.1029/2004JD004640.
- Shukla G, Kumar A, Bhanti M, Joseph PE, Taneja A (2006) Organochlorine pesticide contamination of groundwater in the city of Hyderabad. Environ Int 32:244–247. Saha D, Dhar YR, Sikdar PK (2008) Geochemical evolution of groundwater in the Pleistocene aquifers of South Ganga Plain Bihar. J Geo Soc Ind 71:473–482.
- Saha D, Alam F (2014) Groundwater vulnerability assessment using DRASTIC and Pesticide DRASTIC models in intense agriculture area of the Gangetic plains. Environ Monit Assess, India. doi:10.1007/s10661-014-4041-x.
- Subramani T, Elango L, Damodarasamy SR (2005) Groundwater quality and its suitability for drinking and agricultural use in Chitar River Basin, Tamilnadu, India. Environ Geol 47:1099–1110.
- Sawyer, G.N., & McCarthy, D.L. (1967). Chemistry of sanitary engineers, 2nd ed., Mc Grow Hill, New YPRK, 518PP.
- Schroeder, H.A. (1960). Relations between hardness of water and death rate from certain chronic and degenerative diseases in the United States, J. Chron. Disease. 12,586-591.
- Todd, D.K., & Mays, L.W. (2005). Groundwater hydrology. John wiley & sons, Inc, 3rd ed., 636 pp.
- Taqveem, A.K., & Abbasi, A.M. (2013). Synthesis of parameters used to check the suitability of water for irrigation purposes. International J. of Environmental Science, vol.3, no.6, 2031-2038.
- WHO. (2008). Guidelines for drinking-water quality [Electronic Source]: incorporations, 3rd ed. WHO, Geneva, 515pp.
- Wilcox, L.V. (1955). Classification and use of irrigation waters. US Department of Agriculture, Washington. D.C, 19pp.
- Xiao J, Jin ZD, Zhang F, Wang J (2012) Solute geochemistry and its sources of the ground waters in the Qinghai Lake Catchment, NW China. J Asian Earth Sci 52:21–30.