
Introduction
Bread wheat (Triticum aestivum L.) is an annual crop from the Poaceae family. It is a staple food in many countries. It supplies nutrients to nearly 2.5 billion people constituting 36% of the global population. Globally, wheat is cultivated over 217 million hectares with a production of 752 million tonnes and productivity of 3.5 tonnes/ha1. According to the fourth advance estimate 2021-22, India stands second in wheat production with 106.84 million tonnes2 from 30 million hectares.However, these wheat production trends need to be maintained despite several biotic and abiotic factors, of which drought is one of the major constraints to wheat productivity3.The intensity of drought has increased due to global warming and climate change, which has negatively impacted crop growth and yield resulting in the decline of wheat production4. More than one million people are facing the food crisis, which is expected to double by 20505. Mitra (2001)6 emphasized drought as a matter of great concern for the breeders, resulting in yield loss due to dwindling water resources and increasing drought intensity. This has necessitated developing and identifying the genotypes with sustainable yield potential under drought conditions. Nouri et al. (2011)7recognized that the relative yield performance of genotypes in drought-stressed and favourable environments helps to identify the desirable genotypes under rainfed conditions. Many researchers trust in selecting genotypes under both favourable and unfavourable conditions7,8,9,10,11,12. Identifying component traits contributing to drought tolerance is an inevitable step in the wheat improvement program. Many surrogate traits for drought tolerance have been identified in wheat, which includes traits related to vegetative growth, agronomic parameters, water use efficiency, and photoprotection. However, their associations with yield are poorly understood. This may be due to the fact that wheat is grown under very different climatic conditions across the world and hence faces different drought scenarios13. Therefore, there is a need to identify location-specific traits for drought tolerance.Various drought tolerance indices have been identified based on the potential yield (Yp) under restricted irrigation and yield under water stress conditions (Ys).The stress susceptibility index (SSI) was used by Fischer and Maurer (1978)14 to measure yield stability, which caused the changes in potential and actual yields in variable environments. SSI was also used to examine drought-resistant genotypes of wheat by researchers like Clarke et al.,199215and Guttieri et al.,200116. According to Guttieri et al.,200116, genotypes with SSI less than 1 are more resistant todrought stress conditions and vice-versa. According to Fernandez (1992)17, the StressTolerance Index (STI) is used to find the genotypes with high yield under stress and non-stress environments. Rosielle and Hamblin (1981)18 stated that stress tolerance (TOL) is the difference between stress and irrigated environments, and mean productivity (MP) is the average yield of genotypes under stress and non-stress conditions. Geometric mean productivity (GMP) describes the relative performance. The yield index (YI)(Gavuzzi et al., 1997)19and yield stability index (YSI) suggested by Bouslama and Schapaugh (1984)20are the other yield-based estimates that evaluate the stability of genotypes in both stress and non-stress conditions. Many researchers have used them to screen drought-tolerant wheat genotypes. A significantly positive correlation between grain yield and GMP, MP and STI under stress and non-stress conditions signifying their effectiveness for screening drought-tolerant bread wheat genotypes, was reported by Sio-Se Mardeh et al. (2006)10, Safarnejad (2004)21,Sanjari et al. (2006)22, Farshadfar and Sutka (2003)23 and Geravandi et al. (2010)24.Hessadi (2006)25reported the suitability of GMP, MP, harmonic mean (HM) and STI indices in selecting high-yielding barley cultivars under drought conditions. Emmer wheat is considered to have drought tolerance. So the present study was aimed to evaluate the drought tolerance in emmer based hexaploid wheat to predict drought tolerance traits and suitable genotypes tolerant to drought stress.
Materials and Methods
In the present study, 64 wheat genotypes, including 53 emmer-based doubled haploid lines and 11 Indian cultivars were used in the experiment to assess their drought tolerance. Eleven cultivars used as checks for rainfed, restricted irrigation and irrigated conditions in peninsular and central zones of India, were used in this trial. A trial comprising of 3 replications and two treatments, viz.,rainfed (RF) and restricted irrigation (RI), was constituted at Agharkar Research Institute’s experimental farm located at Hol, Tal-Baramati, Dist-Pune, in the Peninsular zone of India (Lattitute-18.04° N,Longitude -74.21° E, altitude-548.6m) in 2019-20 cropping season. The trial was sown in Mid-November with lattice design. The gross plot size was 3m x 3 rows, 0.23m apart(2.07 sq. m.), and the net plot size was 2 m x 3 rows, 0.23 cm apart (1.38 sq.m.). The recommended dose of fertilizers was used as prescribed for rainfed and restricted irrigation. The field was irrigated immediately after sowing. Two different irrigation treatments were given. For rainfed conditions, irrigation was given only once at the time of sowing, whereas for restricted irrigation conditions, one additional irrigation was given 42 days after sowing. Data were collected on various phenological and physiological characteristics related with drought tolerance.Yield (YLD) and biomass (BIOM) were recorded in g/plot and harvest index (HI)in percentage. Primary yield contributing traits like productive tillers permeter (PT/M), grain number per spike (GR/S) were counted, plant height (HT) was measured in cm, grain weight per spike (GW/S), and 1000 kernel weight (TKW) were recorded in grams. Phenological traits like days to heading (DTH), days to maturity (DTM), and grain fillingduration (GFD) were recorded in days. Physiological parameters such as canopy temperature (CT), Chlorophyll content (SPAD) and Normalized difference vegetation index (NDVI) were also recorded atanthesis. CT indirectly measures the evaporative cooling of the plants under drought, which influence the plants’ photosynthetic efficiency. Lower values indicated cooler canopies. Canopy temperature was recorded thrice by using a hand-held infrared thermometer. Chlorophyll content was recorded on three flag leaves by Minolta SPAD-502 chlorophyll meter and expressed in terms of SPAD units. NDVI was measured using a FieldScout NDVI CM-1000 meter. An average of three readings was used for statistical analysis. The higher the value is, the more photosynthetic efficiency.Eight selection indices for stress tolerance, including harmonic mean (HM), mean productivity (MP), geometric mean productivity (GMP), tolerance (TOL), yield index (YI), yield stability index (YSI), stress tolerance index (STI), stress susceptibility index (SSI) were studied. These stress indices were calculated using the following formulas
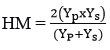
Harmonic mean (HM)26
Mean Productivity (MP) 18,27
![]()
Geometric mean productivity (GMP)17
![]()
Tolerance (TOL) 18,27
![]()
Yield index (YI) 28,19
![]()
Yield stability index (YSI) 20
![]()
Stress tolerance index (STI)17
![]()
Stress susceptibility index (SSI)14
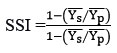
where Ys and Yp are the mean yield of genotypes under rainfed and restricted irrigation conditions respectively and Ys ̅and Yp ̅are the mean yield of all genotypes under stress and non-stress conditions. The genotypes with high values of HM, MP, GMP, YI, YSI and STI are more desirable. The genotypes with low values of TOL are more stable in two different conditions. The genotypes with SSI < 1 are likely to be more resistant to drought stress conditions. The data were subjected to analysis of variance followed by LSD tests for means comparisons using Agrobase software and Principal component analysis (PCA) and cluster analysis was computed using STAR software. Pearson’s correlation coefficient was determined using R studio.
Results
The results of ANOVA for YLD, PT/M, GR/S, GW/S, TKW, DTH, DTM, GFD, BIOM, HT, CT, NDVI, SPAD and HI in RF and RI environments indicated that genotypic differences were the significant source of variance for these traits (P<0.001)(Table 1). In case of yield under rainfed condition superior genotypes DH 807, DH 989, DH 554, DH 431 are at par with the highest yielding check NI 5439, NIAW 1415, DPW 621-50 and MACS 6222 and better performing than remaining seven check varieties at 0.05 level of significance (P<0.05). Under restricted irrigation condition, the genotypes DH 807, DH 430 and DH 435 were best performing lines with higher yield levels than all check varieties at 0.05 level of significance (P<0.05). (Table 2).The response of genotypes at each condition varied based on agronomic, yield contributing, and physiological traits.Biomass was highest in C 306 in both RF and RI, whereas lowest in DH 66 and DH 173 under RF and RI, respectively. HI values were highest in DH 807 for RF and RI conditions (Table 2). Tolerance indices were calculated based on the yield of genotypes as shown in Table 3.The lowest TOL was found in DH 989, followed by DH 560, NI 5439 and DH 995. Hence, these genotypes had a lower yield reduction under RFconditions. SSI was highest in DH 66 and lowest in DH 989. A greater TOL value was observed in DH 430, followed by DH 435, DH 66, DH 417, and DH 931,indicating that these genotypes had a more significant yield reduction under rainfed conditions and higher drought sensitivity. The highest HM, MP, STI andGMP indices were observed in DH 807. The highest YI was observed in NI 5439,NIAW 1415, DPW 621-50, MACS 6222, DH 807 and higher YSI in DH 989. DH 66 showed the lowest YI as well as YSI.
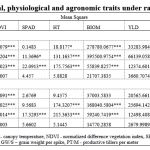 |
Table 1: Mean squares for morphological, physiological and agronomic traits under rainfed and restricted irrigation condition |
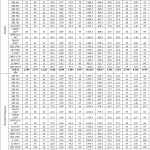 |
Table 2: Mean comparison of yield and other traits under rainfed and restricted irrigation conditions for selected genotypes and checks. |
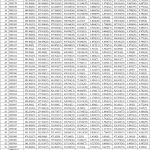 |
Table 3. Tolerance Indices of wheat genotypes under rainfed and restricted irrigation conditions. The numbers in the parenthesis are the genotype ranks for each index. |
The correlation coefficients between yield under rainfed as well as restricted irrigation and various surrogative traits along with other quantitative drought tolerance indices were calculated to assess the most desirable drought tolerance criteria (Fig 1, Table 4). In the present study, a significant positive correlation was found between the surrogate traits like GFD, SPAD, HT, BIOM, HI, TKW, GW/S and PT/M and Yp whereas DTH, DTM and CT were negatively correlated. Similarly, a significant positive correlation was seen between NDVI, HT, BIOM, HI, TKW, GR/S, GW/S, PT/M and Ys. DTH, DTM and CT showed negative correlation with Ys.A positive correlation was observed between height, biomass, grain yield, harvest index, thousand kernel weight, grain weight per spike and resistance indices like HM, MP, STI, GMP, YI and YSI under rainfed and restricted conditions which suggest that these parameters are suitable for selecting genotypes under drought conditions. NDVI and productive tillers per meter were positively correlated with HM, MP, STI, GMP, YI and YSI under RF conditions, and SPAD was positively correlated with these indices under restricted irrigation conditions.CT showed a positive association with TOL and SSI under rainfed conditions and a positive association with SSI under RI conditions. NDVI showed a negative correlation with TOL and SSI under RF conditions. These results specify that the genotypes with low CT and high NDVI usually have high-stress tolerance under rainfed conditions. The check variety NI 5439, which had a low TOL and SSI also had low CT and high NDVI under RF conditions. Height was significantly positively correlated with HM, MP, STI, GMP and YI under both conditions and YSI under RF conditions only. A perfect positive correlation was observed between YI and grain yield under rainfed conditions, which suggests this parameter is suitable for selecting genotypes under drought conditions.In this study, a general linear regression of grain yield under drought stress on YSI revealed a positive correlation between this criterion with a similar coefficient of determination (R2 = 0.381) (Fig 2).The drought tolerant indices produced a genotype performance order. The selection based on a combination of indices may grant a more useful criterion for improving drought resistance of wheat, although correlation coefficients are useful to find the degree of overall linear association between any two attributes 7,29,30.Thus, a better approach than correlation analysis, such as a biplot, was used to identify superior genotypes for both stressed and non-stressed environments.Principal component analysis (PCA) reduces the dimensionality of large data sets that are otherwise difficult to interpret and helps increase interpretability31. A PCA was performed to identify drought-tolerant/ susceptible genotypes.
Table 4: Simple correlation coefficient between yield, tolerance indices and traits.
| Traits | Yield | HM | MP | TOL | STI | SSI | GMP | YI | YSI |
| DTH (RF) | -0.28*** | -0.46*** | -0.49*** | -0.35** | -0.49*** | -0.18ns | -0.47*** | -0.33** | 0.18ns |
| DTH (RI) | -0.46*** | -0.39** | -0.42*** | -0.39** | -0.43*** | -0.23ns | -0.40*** | -0.26* | 0.23ns |
| DTM (RF) | -0.24*** | -0.46*** | -0.49*** | -0.33** | -0.49*** | -0.15ns | -0.47*** | -0.34** | 0.15ns |
| DTM (RI) | -0.44*** | -0.37** | -0.41*** | -0.47*** | -0.41*** | -0.30* | -0.39*** | -0.22ns | 0.30* |
| GFD (RF) | 0.01ns | -0.22ns | -0.23ns | -0.09ns | -0.21ns | 0.00ns | -0.23ns | -0.18ns | 0.00ns |
| GFD (RI) | 0.19** | 0.18ns | 0.17ns | -0.06ns | 0.19ns | -0.09ns | 0.17ns | 0.18ns | 0.09ns |
| CT (RF) | -0.44*** | -0.45*** | -0.42*** | 0.27* | -0.43*** | 0.37** | -0.44*** | -0.49*** | -0.37** |
| CT (RI) | -0.26*** | -0.37** | -0.36** | 0.22ns | -0.34** | 0.31* | -0.36** | -0.41*** | -0.31* |
| NDVI (RF) | 0.44*** | 0.32** | 0.29* | -0.39** | 0.28* | -0.47*** | 0.30* | 0.40*** | 0.47*** |
| NDVI (RI) | -0.03ns | -0.06ns | -0.08ns | -0.23ns | -0.10ns | -0.22ns | -0.07ns | 0.01ns | 0.22ns |
| SPAD (RF) | -0.02ns | 0.14ns | 0.16ns | 0.25* | 0.14ns | 0.15ns | 0.15ns | 0.06ns | -0.15ns |
| SPAD (RI) | 0.27*** | 0.46** | 0.46** | 0.04ns | 0.45*** | -0.14ns | 0.46*** | 0.41*** | 0.14ns |
| HT (RF) | 0.47*** | 0.49*** | 0.48*** | -0.13ns | 0.46*** | -0.27* | 0.48*** | 0.49*** | 0.27* |
| HT (RI) | 0.26*** | 0.32* | 0.32* | -0.01ns | 0.30* | -0.11ns | 0.32* | 0.30* | 0.11ns |
| BIOM(RF) | 0.89*** | 0.73*** | 0.70*** | -0.42*** | 0.70*** | -0.62*** | 0.72*** | 0.80*** | 0.62*** |
| BIOM(RI) | 0.66*** | 0.61*** | 0.61*** | 0.05ns | 0.58*** | -0.16ns | 0.61*** | 0.55*** | 0.16ns |
| YLD(RF) | 1.000*** | 0.96*** | 0.94*** | -0.36** | 0.94*** | -0.62*** | 0.95*** | 1.00*** | 0.62*** |
| YLD(RI) | 1.000*** | 0.90*** | 0.94*** | 0.35** | 0.92*** | 0.04ns | 0.92*** | 0.75*** | -0.04ns |
| HI (RF) | 0.73*** | 0.77*** | 0.77*** | -0.10ns | 0.78*** | -0.32** | 0.77*** | 0.75*** | 0.32** |
| HI (RI) | 0.76*** | 0.64*** | 0.67*** | 0.38** | 0.68*** | 0.17ns | 0.65*** | 0.50*** | -0.17ns |
| TKW (RF) | 0.31*** | 0.48*** | 0.51*** | 0.36** | 0.49*** | 0.16ns | 0.50*** | 0.35** | -0.16ns |
| TKW (RI) | 0.61*** | 0.55*** | 0.59*** | 0.37** | 0.57*** | 0.15ns | 0.57*** | 0.42*** | -0.15ns |
| GR/S (RF) | 0.16* | 0.04ns | 0.01ns | -0.23ns | 0.04ns | -0.21ns | 0.03ns | 0.09ns | 0.21ns |
| GR/S (RI) | 0.01ns | -0.05ns | -0.06ns | -0.06ns | -0.02ns | -0.01ns | -0.05ns | -0.03ns | 0.01ns |
| GW/S (RF) | 0.40*** | 0.50*** | 0.52*** | 0.14ns | 0.52*** | -0.04ns | 0.51*** | 0.43*** | 0.04ns |
| GW/S (RI) | 0.41*** | 0.48*** | 0.50*** | 0.20ns | 0.52*** | 0.06ns | 0.49*** | 0.39** | -0.06ns |
| PT/M (RF) | 0.46*** | 0.29* | 0.25* | -0.47*** | 0.26* | 0.51*** | 0.27* | 0.40*** | 0.51*** |
| PT/M (RI) | 0.15* | 0.05ns | 0.04ns | -0.14ns | 0.03ns | -0.12ns | 0.05ns | 0.09ns |
0.12ns |
*p<0.05, **p<0.01, ***p<0.001, ns-Non significant
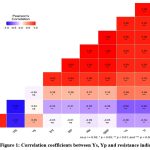 |
Figure 1: Correlation coefficients between Ys, Yp and resistance indices |
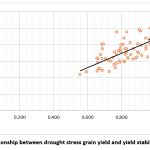 |
Figure 2: Relationship between drought stress grain yield and yield stability index (YSI) |
The first two PCAs accounted for 99.7%, PC1-70.9 % and PC2-28.8 %, respectively (Fig 3). A close relation was observed between HM, GMP, STI and MP, indicating that they are approximately the same in the ranking of genotypes. A close angle between Ys and YI indicated that YI is identical to Ys in the ranking of genotypes (yield under stress conditions). The angle between GMP, HM, MP, STI, YI and YSI is an acute angle showing their close relationship with each other. Positive correlations were found between GMP, HM, STI and MP. These indices were also positively correlated with Ys (yield under stress) and Yp (Yield under RI). TOL and SSI were strongly and positively correlated with each other, indicating that these indices can categorize the susceptible genotypes (i.e. DH 66, DH 227, DH931, DH 62, DH 942, DH 875, DH 134, DH 179).TOL and SSI showed a negative correlation with Ys, GMP, HM, MP, STI, YI and YSI based on which DH 989, DH 554, both tolerant genotypes could be distinguished. These genotypes performed well under rainfed and restricted irrigation, showing better performance than HD 2781 but below NI 5439 check varieties. A positive correlation was found between yield under rainfed and restricted irrigation, demonstrating that the genotypes under rainfed conditions could perform well under restricted irrigation. The check varieties NI 5439, NIAW 1415, DPW 621-50 and genotype DH 989 were the most stable genotypes under unfavourable environments, while DH 807, DH 430, DH 435,MACS 6222 and DH 417 were highly adapted to restricted irrigation (Fig 3).Cluster analysis showed that the genotypes based on GMP, MP, HM, STI, YI, YSI,TOL and SSI tended to group into four groups with 6, 6, 25 and 27 genotypes, respectively (Fig 4). The cluster analysis illustrated that the first group consisting of DH 554, DH 989, HD 2781, NI 5439, DPW 621-50 and NIAW 1415 exhibited higher MP, HM, GMP, and STI. It was considered the most desirable cluster for both growth conditions with low SSI and TOL and high YSI, indicating their stability in performance. These results substantiate our previous findings derived from PCA. The second group (DH 417, DH 430, DH 435, DH 431, DH 807 and MACS 6222) showed genotypes with higher TOL, SSI and lower YSI values. Thus these genotypes were sensitive to drought and suitable for restricted irrigation conditions. The third group comprised mostly genotypes with high SSI and TOL values with low YSI and YI, indicating their poor performance under stress conditions. The fourth group was a moderate performer based on Yp, Ys, and the indices ranking.
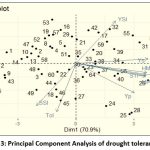 |
Figure 3: Principal Component Analysis of drought tolerance indices |
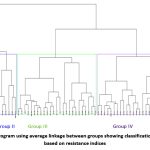 |
Figure 4: Dendrogram using average linkage between groups showing classification of genotypes based on resistance indices. |
Discussion
Several agronomic and physiological traits influence grain yield response in wheat. Variation due to genotypes was significant for all traits in two conditions, viz., rainfed and restricted irrigation, which suggested that the magnitude of differences in genotypes was sufficient to provide some scope for selecting genotypes to improve drought tolerance. The mean comparison of traits observed in this study showed that DH 807 had the highest grain yield and harvest index under RI conditions which is similar to the inference drawn by Donald and Hamblin (1976)32that genotypes with higher HI exhibit higher yields. The present study showed a significant positive correlation of grain yield with agronomic traits like TKW, HI, BIOM, PT/M, GW/S and physiological traits like NDVI and a negative correlation with CT. Similar results were reported by Foulkes et al. (2007)33, Lopes et al. (2012)34, Beche et al. (2014)35, Chen and Hao (2015)36, Zhang et al. (2016)37, and Gao et al. (2017)38. The yield contributing traits like BIOM, PT/m, GR/S, and GW/S indicated that supportive irrigation during the reproductive phase enhances the yield and plays a key role in affecting the above traits. Moayedi et al. (2009)39 and Garcia del Moral et al. (2005)40also noted similar results. GMP, MP, HM, YI and STI were significantly correlated with yield under both conditions (Table 4),indicating that these parameters are suitable to screen drought tolerant,high-yielding genotypes like DH 989. Similar results were reported by Fernandez (1992)17, Mohammadi et al. (2003)41, Golabadi et al. (2006)29, Sio-Se Mardeh et al.(2006)10, Mohammedi et al. (2010)12, and Nouri et al. (2011)7. Accordingly, these parameters were suitable for discriminating the best genotypes under both conditions. Mohammadi et al. (2010)12 found that GMP, MP, and STI were positively correlated to yield under moderate stress. According to our study, the check genotype NI 5439 had high YI and YSI, which had a highly significant positive correlation with grain yield under rainfed conditions (r = 1.0 and 0.62 for grain yield and YI and YSI under rainfed conditions, respectively); hence these two parameters signify good tolerance to rainfed condition (Table 4). YSI was a valuable index for discriminating drought resistance from drought-susceptible genotypes12.A significant positive correlation was found between TOL and GY under restricted irrigation (P<0.01), but this correlation was negative under rainfed conditions (Fig 1), indicating that the genotype with high GY under restricted irrigation had a high reduction in yield under the rainfed condition as revealed in DH 430. Similar results were reported by Nouri et al. (2011)7and Mohammadi et al. (2010)12, who showed that selection based on TOL would result in yield reduction under rainfed conditions. SSI was used by Clarke et al. (1992)15to evaluate drought tolerance in wheat genotypes. He noted a year-to-year variation in SSI for genotypes and their ranking pattern. Bansal and Sinha (1991)42 used SSI and GY as stability parameters to identify drought-resistant genotypes in wheat. In this research, DH 989 and check NI 5439 had the lowest SSI, and therefore, these genotypes have low drought susceptibility and high yield stability in both conditions, whereas DH 66 followed by DH 227with SSI higher than the unit, can be identified as having high susceptibility to drought. Similar results were reported by Golabadi et al. (2006)29, Talebi et al. (2009)30 and Nouri (2011)7, who showed that SSI could be a more useful index in discriminating better genotypes under rainfed conditions. In the present study, SSI and TOL showed a significant negative correlation with Ys (r = -0.62and -0.36, respectively). Larger SSI and TOL values represent relatively more sensitivity to stress. Hence smaller SSI and TOL values are preferred. Selection based on these two criteria identifies genotypes with high yield potential under non-stressed conditions and low yield under stressed conditions (Fernandez,1992)17. PCA was performed to evaluate the relationships between yield (Ys and Yp) and stress tolerance indices. The correlation coefficient among any two indices was approximated by the cosine of the angle between their vectors. Thus, r = cos 180° = -1, cos 0° = 1,and cos 90° = 0 (Yan and Rajcan, 2002)43. The most prominent relations revealed by the biplots were (i) a strong negative association of TOL and SSI with YI,HM, GMP, MP and STI as indicated by the large obtuse angles between their vectors, (ii) a positive association of YSI with YI, HM, GMP, MP, STI and Yp with SSI and TOL as indicated by their acute angles, (iii) near to zero and non-significant correlation of Yp with SSI and YSI as indicated by the perpendicular vector. These results obtained from biplots confirmed the correlation analysis. The observation noted are in accordance with those reported by Fernandez (1992)17 in mung bean and Golabadi et al. (2006)29 as well as Nouri et al. (2011) 7in durum wheat. In the present study, the check NI 5439 had the highest yield under RF condition, which exhibited high GFD, BIOM, HI and PT/M, high NDVI and low CT, and the highest values for YI and YSI and low values for SSI and TOL. DH 989 and DH 554 were selected as the most drought tolerant genotypes based on average ranks of stress indices. Finally, GMP and STI can be used to select drought-tolerant genotypes. The traits such as CT, NDVI, biomass, HI, productive tillers/meter, grain weight/spike and TGW are suitable for selecting the best genotypes under rainfed and restricted irrigation conditions as these parameters are strongly correlated with HM, MP, STI, GMP, YI, SSI and TOL. These parameters are useful for discriminating genotypes that have higher stability and lower susceptibility to stress conditions.
Conclusion
Yield and yield contributing traits under rainfed and restricted irrigation were independent. STI, GMP and MP were used to identify tolerant genotypes that produced high yields under both conditions. Based on YI and YSI, resistant genotypes could be discriminated which remain stable under different conditions and produce high grain yield under stress. The TOL value for genotypes was higher, yielding only under irrigated conditions. This study indicated that some genotypes reduced grain yield under drought stress while others were tolerant to drought, which showed genetic variability for drought tolerance in this material which can be utilized by the breeders for the development of genotypes with better drought tolerance in assistance with the selection indices and physiological parameters. This could help to mitigate the disaster of climate change by developing a climate-smart and resilient variety1.
Acknowledgement
The authors are thankful to Director, Agharkar Research Institute, G.G. Agarkar Road, Pune 411004, Maharashtra, India for providing all the facilities for conducting the experiment and GCP (Generation Challenge Programme) Project for providing the emmer based hexaploid wheat lines.
Conflict of Interest
The authors declare that there is no conflict of interest regarding the publication of this paper.
Ethical Standard
The experiment conducted complies with the laws.
References
- Erenstein O., Jaleta M., Mottaleb K.A., Sonder K., Donovan J., Braun H.J. Global Trends in Wheat Production, Consumption and Trade. In: Reynolds M.P., Braun H.J. (eds) Wheat Improvement. Springer, Cham. 2022;47-66. https://doi.org/10.1007/978-3-030-90673-3_4
- Fourth Advance Estimates of Production of Foodgrains for 2021-22. Report, Directorate of Economics and Statistics, Department of Agriculture and Farmers Welfare, Ministry of Agriculture and Farmers Welfare, Government of India. 2022;1-2. https://eands.dacnet.nic.in/Advance_Estimates.htm
- Richards R.A. Drought. In: Reynolds M.P., Braun H.J. (eds) Wheat Improvement. Springer, Cham. 2022;417-432. https://doi.org/10.1007/978-3-030-90673-3_23
- Saeideh D., Ali D., and Bahram H. Evaluation of grain yield indices in hexaploid wheat genotypes inresponse to drought stress. Archives of Agronomy and Soil Science, 2015;6(3):397–413. http://dx.doi.org/10.1080/03650340.2014.936855
- Axton M., Vogan K., Bahcall O., Niemitz E., Feliciano P. The cup half empty. Nat Genet. 2009;41:6–7.
- Mitra J. Genetics and genetic improvement of drought resistance in crop plants. Crop Sci. 2001;80:758–762.
- Nouri A., Etminan A., Teixeira da Silva J.A., Mohammadi R. Assessment of yield, yield-related traits and drought tolerance of durum wheat genotypes (Triticumturjidumvar. durumDesf.). Aust J Crop Sci. 2011;5 (1): 8-16.
- Byrne P.F., Bolanos J., Edmeades G.O., Eaton D.L. Gains from selection under drought versus multilocation testing in related tropical maize populations. Crop Sci. 1995;35: 63-69.
- Rajaram S., Van Ginkle M. Mexico, 50 years of international wheat breeding. In Bonjean AP, and Angus WJ (eds) The world Wheat Book, A History of Wheat Breeding, Paris, France. Lavoisier Publishing. 2001;579-604.
- Sio-Se Mardeh A., Ahmadi A., Poustini K., Mohammadi V. Evaluation of drought resistance indices under various environmental conditions. Field Crop Res. 2006;98: 222-229.
- Najafian G. Drought tolerance indices, their relationships and manner of application to wheat breeding programs. In: Mohammadi R, Haghparast R (Eds) Plant Science in Iran. Middle Eastern and Russian Journal of Plant Science and Biotechnology. 2009;3(Special Issue 1) 25-34.
- Mohammadi R., Armion M., Kahrizi D., Amri A. Efficiency of screening techniques for evaluating durum wheat genotypes under mild drought conditions. Journal of Plant Production. 2010; 4(1): 11-24.
- Monneveux P., Jing R., Misra S.C. Phenotyping for drought adaptation in wheat using physiological traits. Front Physiol. 2012;3:1-12. doi: 10.3389/fphys.2012.00429. PMID: 23181021; PMCID: PMC3499878.
- Fischer R.A., Maurer R. Drought resistance in spring wheat cultivars. I. Grain yield response. Aust. J. Agric. Res., 1978; 29:897-912.http://dx.doi.org/10.1071/AR9780897
- Clarke J. M., De Pauw R.M., Townley-Smith T.M. Evaluation of methods for quantification of drought tolerance in wheat. Crop Sci.1992;32:728-732.
- Guttieri M.J., Stark J.C., Brien K., Souza E. Relative sensitivity of spring wheat grain yield and quality parameters to moisture deficit. Crop Sci. 2001;41:327-335.
- Fernandez G.C.J.–Effective selection criteria for assessing stress tolerance. In: Kuo C. G., (ed.) Proc. Int. Sym. Adaptation of Vegetables and Other Food Crops in Temperature and Water Stress, Publication, Tainan, Taiwan.1992;257-270.
- Rosielle A.A., Hamblin J. Theoretical aspects of selection for yield in stress and non-stress environments. Crop Sci J. 1981;21: 943-946.
- Gavuzzi P., Rizza F., Palumbo M., Campaline R.G., Ricciardi F.L., Borghi G. Evaluation of field and laboratory predictors of drought and heat tolerance in winter cereals. Plant Sci.1997;77: 523-531
- Bouslama M., Schapaugh W.T. Stress tolerance in soybean. Part 1: evaluation of three screening techniques for heat and drought tolerance. Crop Sci J.1984;24: 933-937
- Safarnejad A. Characterization of somaclones of alfalfa (Medicagosativa L.) for drought tolerance. J AgricSci Technol. 2004;6:121–127.
- Sanjari A.G., Vallizadeh M., MajidiHervan E., Shiri M.R. Evaluation of response of new wheat cultivars to various drought stress conditions for grain yield and some other agronomical and physiological traits. J Agric Sci. 2006;16:97–112.
- Farshadfar E., Sutka J. Multivariate analysis of drought tolerance in wheat substitution lines. J Cereal Res. 2003;31:33–40.
- Geravandi M., Farshadfar M., Kahrizi D. Evaluation of drought tolerance in bread wheat advanced genotypes in field and laboratory conditions. J Seed Plant Improv. 2010; 26:233–252.
- Hessadi P. Selection for drought resistance in lines of barley in Kermanshah region. J Agric Sci.2006;1:143–153.
- Kristin A.S., Serna R.R., Perez F.I., Enriquez B.C., Gallegos J.A.A., Vallejo P.R., Wassimi N., Kelley J.D. Improving common bean performance under drought stress. Crop Sci. 1997;37:43-50.
- Hossain, A.B.S., Sears A.G., Cox T.S., Paulsen G.M. Desiccation tolerance and its relationship to assimilate partitioning in winter wheat. Crop Sci. 1990;30, 622-627.
- Lin C.S., Binns M.R., LefkovitchL.P.. Stability analysis: where do we stand? Crop Sci. 1986; 26: 894-900.
- Golabadi M., Arzani A., Maibody SAM. Assessment of drought tolerance in segregating populations in durum wheat. Afr J Agric Res.2006;5:162-171.
- Talebi R. Effective selection criteria for assessing drought stress tolerance in durum wheat (Triticum durum Desf.). General and Applied plant physiology. 2009;35(1-2):64-74.
- Jolliffe I.T., Cadima J. Principal component analysis: a review and recent developments. Phil. Trans. R. Soc. A .2016;374:1-16 20150202. http://dx.doi.org/10.1098/rsta.2015.0202
- Donald C.M., Hamblin J. The Biological Yield and Harvest Index of Cereals as Agronomic and Plant Breeding Criteria. Advances in Agronomy.1976;28:361-405. http://dx.doi.org/10.1016/S0065-2113 (08)60559-3
- 33. Foulkes M. J., Sylvester-Bradley R., Weightman R., Snape J.W. Identifying physiological traits associated with improved drought resistance in winter wheat. Field Crops Res. 2007; 103:11–24. doi: 10.1016/j.fcr.2007.04.007
- Lopes M. S., Reynolds M. P., Manes Y., Singh R. P., Crossa J., Braun H. J. Genetic yield gains and changes in associated traits of CIMMYT spring bread wheat in a “historic” set representing 30 years of breeding. Crop Sci. 2012; 52:1123–1131. doi: 10.2135/cropsci2011.09.0467
- Beche E., Benin D., Da Silva C. L., Munaro L. B., Marchese J. A. Genetic gain in yield and changes associated with physiological traits in Brazilian wheat during the 20th century. Eur. J. Agron. 2014; 61:49–59. doi: 10.1016/j. eja.2014.08.005
- Chen X., Hao M. D. Low contribution of photosynthesis and water-use efficiency to improvement of grain yield in Chinese wheat. Photosynthetica. 2015; 53:519–526. doi: 10.1007/s11099-015-0147-9
- Zhang, Y., Xu W., Wang W., Dong H., Qi X., Zhao M. Progress in genetic improvement of grain yield and related physiological traits of Chinese wheat in Henan Province. Field Crops Res. 2016;199:117–128. doi: 10.1016/j. fcr.2016.09.022
- Gao F., Ma D., Yin G., Rasheed A., Dong Y., Xiao Y. Genetic progress in grain yield and physiological traits in Chinese wheat cultivars of southern Yellow and Huai Valley since 1950. Crop Sci. 2017;57: 760–773. doi: 10.2135/cropsci2016.05.0362
- Moayedi A.K., Boyce A.N., Barakbah S.S., Ghodsi M. Tillering Behaviors of Promising Durum wheat Genotypes and Bread Wheat Cultivar under Different Water Deficit Conditions. In: Mohammadi R, Haghparast R (Eds) Plant Science in Iran. Middle Eastern and Russian Journal of Plant Science and Biotechnology. 2009; 3 (Special Issue 1): 15-19.
- García del Moral L.F., Rharrabti Y., Elhani S., Martos V., Royo C. Yield Formation in Mediterranean durum wheats under two contrasting water regimes based on path-coefficient analysis. Euphytica. 2005; 146:213-222.
- Mohammadi R., Farshadfar E., Aghaee M., Shutka J. Locating QTLs controlling drought tolerance criteria in rye using disomic addition lines. Cereal Res Comm. 2003; 31: 257-263.
- Bansal K.C., Sinha S.K. Assessment of drought resistance in 20 accessions of Triticumaestivumand related species Total dry matter and grain yield stability. Euphytica.1991; 56: 7-14.
- 43. Yan W., Rajcan I. Biplot analysis of test sites and trait relations of soybean in Ontario. Crop Sci. 2002; 42: 11-20.