
Introduction
Genotypes and environment effects refers to the different response of genotypes evaluated over number of locations or years and this cross over interactions affects the breeding progress under crop improvement program as makes it difficult to identify the really promising genotypes (Karimizadeh et al. 2023). The estimation and proper usage of interaction effects had been highlighted by the breeders for the development and release of high-yielding stable genotypes (Azam et al. 2023). Moreover, the yield being quantitative trait can be significantly affected by cross over significant genotypes and environment interaction effects (Hossain et al. 2023). This demands there searchers to be more careful in evaluation process and identifying genotypes to be better in terms of yield and adaptability particularly for the targeted environmental conditions (Mohammadi et al. 2023). On the other hand, this interaction effects also provide opportunities to select genotypes that interact positively with a particular location (specific adaptation) or perform well in most of the environmental conditions (general adaptation) (Taleghani et al. 2023). Numerous analytic techniques have been developed over the recent past to take advantage of the genotype × environment interactions and to assist the breeders to identify the cultivars for their better adaptation in specific environmental conditions (Saremirad et al. 2022; Saeidnia et al. 2023). Broadly there are two approaches for modelling the effects of G, E and their interactions. Parametric methods defined the stability indices considered the interaction effects and the normal distribution of errors, thought their robust assurance might not be applicable for situations when these assumptions are not fulfilled (Pour-Aboughadareh et al. 2019; Shojaei et al. 2021). Apart from the BLUP based analytic measures good number of non-parametric methods considered the ranks of genotypes as per their performance in each environment had been proposed to interpret and describe the responses of genotypes to various environmental conditions Sharif et al. 2021. The current study was carried out to observe association, if any, among the measures considered the Additive Main and Multiplicative Interaction (AMMI), Best Linear Unbiased Predictor (BLUP) and Non parametric approaches for the wheat genotypes evaluated at number of locations in the north hills zone of the country in last cropping season.
Materials and Methods
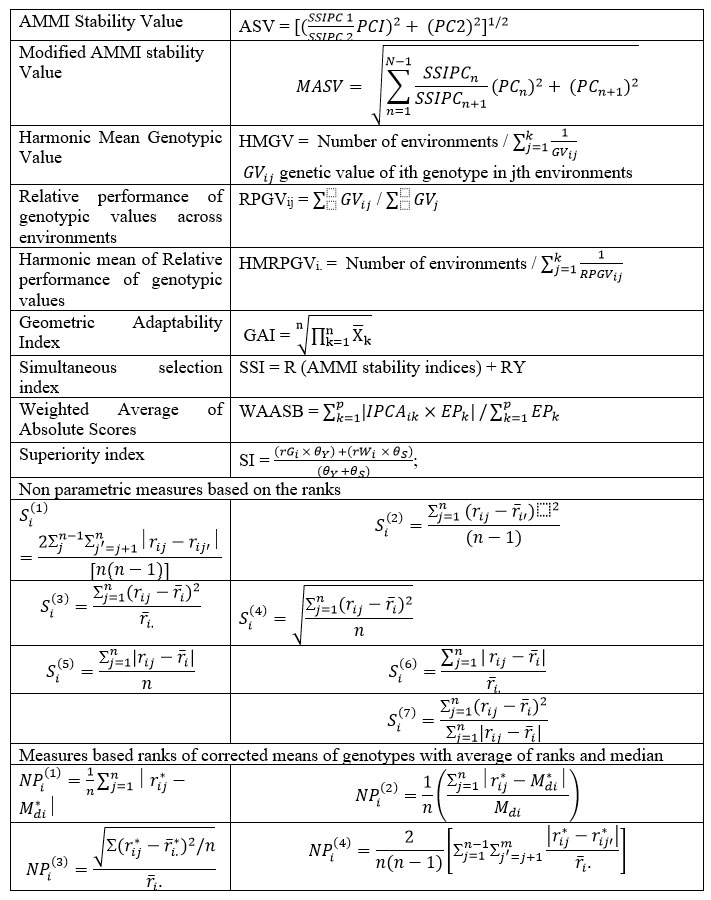
Promising nine wheat genotypes were evaluated under advanced varietal trials at major nine locations of the north hills zone of the country during 2022-23 cropping season under rain fed conditions reflected in table 1. Randomised Block deigns with four replications were laid out in research fields of plot size 3.5 x 1.20 meter to accommodate ample number of plants as inner six rows were harvested for yield recording. Sowing of seeds in fields were completed during second fortnight of October and recommended dose of fertilizers 60:30:20 (N:P:K) for the zone was applied thoroughly in fields. The recent analytic measures as per BLUP, Non parametric measures and AMMI based measures had been mentioned below for ready reference as (Zali et al. 2012; Olivoto et al. 2019; Vineeth et al. 2022)
Recent and popular software’s viz. Meta-R, AMMIsoft 1.0 and SAS 9.3 software’s were used to analyse the research data generated under multi location evaluation of wheat genotypes.
Table 1: Detail about the parentage of evaluated wheat genotypes and locations of the field trials
| Code | Genotype | Parentage | Location | Latitude | Longitude | Altitude | Soil type |
| NHRF101 | VL907 | DYBR1982-83842AB VD50/VW9365// PBW343 |
Malan | 32°08 ‘ N | 76°35’E | 846 | Silty clay loam |
| NHRF102 | VL2041 | NESSER/ SAULSKU32/ MACS6240// HS507 |
Shimla | 31°10 ‘ N | 77°17’E | 2276 | Silty clay loam |
| NHRF103 | VL3028 | SUP152/BAJ#1/ 4/BAJ#1/3/ KIRITATI// ATTILA*2/ PASTOR/5/ SUP152/BAJ#1 |
Bajaura | 31°50’N | 77°9’E | 1103.85 | Silty clay loam |
| NHRF104 | HPW484 | PBW677mutant/ GW322//BAJ#1(Trombay) |
Almora | 29° 35 ‘ N | 79° 39 ‘E | 1610 | Silty clay loam |
| NHRF105 | HPW349 | NAC/TH.AC//3*MIRLO/ BUC/4/2*PASTOR |
Majhera | 29° 16′ N | 80° 5′ E | 1532 | |
| NHRF106 | HS691 | HS484/KLE/BER/ 2*FL-8/DONSK-POLL |
Gaja | ||||
| NHRF107 | VL892 | WH542/PBW226 | Khudwani | 33° 70′ N | 75°10′ E | 1590 | |
| NHRF108 | HS692 | ZANDER-33/HD2932//HS484 | Wadura | 21° 18′ N | 77° 41′ E | 508 | |
| NHRF109 | HS562 | OASIS/ SKUAZ//4*BCN/ 3/2*PASTOR |
Imphal | 24°81° N | 93°93 E | 786 |
Results and Discussion
ANOVA has partitioned the total sum of squares into effects of environments, interactions and genotypes with respective shares of 21.3%, 12.7% and 2.6% respectively (Table 2). Interaction effects were further partitioned into three components and first two components had accounted for 93.5% of total interactions sum of squares in AMMI analysis of nine genotypes at nine locations (Mohammadi et al. 2020a).
Table 2: ANOVA for yield and significance of interaction principal components by AMMI.
| Source | Degree of freedom | Sum of squares | Mean Sum of squares | Share of factors (%) | IPCA’s share (%) | Cumulative total of interaction components |
| Treatments | 80 | 81762.79 | 1022.03 | 36.60 | ||
| Genotypes (G) | 8 | 5851.72 | 731.46 | 2.62 | ||
| Environments (E) | 8 | 47605.43 | 5950.68 | 21.31 | ||
| GxE interactions | 64 | 28305.64 | 442.28 | 12.67 | ||
| IPC1 | 15 | 24897.37 | 1659.82 | 87.96 | 87.96 | |
| IPC2 | 13 | 1570.65 | 120.82 | 5.55 | 93.51 | |
| IPC3 | 11 | 1274.59 | 115.87 | 4.50 | 98.01 | |
| IPC4 | 9 | 340.85 | 37.87 | |||
| IPC5 | 7 | 162.23 | 23.18 | |||
| IPC6 | 5 | 51.04 | 10.21 | |||
| IPC7 | 3 | 8.88 | 2.96 | |||
| Residual | 1 | 0.04 | 0.04 | |||
| Error | 396 | 141656.33 | 357.72 | |||
| Total | 476 | 223419.12 | 469.37 |
Performance of genotypes based on Simultaneous Selection Index
Measures from the AMMI analysis were compared with the average yield for each genotype in all environments; these are shown in Table 3. VL907, HS562, HPW484 genotypes had achieved the higher yield as compared to other ones as ranked in top three genotypes. Least values of IPC1 had been observed for HS691, HPW484, VL2041 whereas genotypes HS562, HS692, VL907 had exhibited minimum values of IPC2 in the recent study. Lower values of IPC3 measure had pointed by HS562, HPW349,VL3028 genotypes. AMMI analysis based measure while considering first two interactions components had expressed the desirability of HPW484, HS562, VL2041as least values would be suitable for stable performance of wheat genotypes (Mohammadi et al. 2020b). Moreover the genotypes HS562, HPW484, VL2041 had been identified by least values of MASV measure as observed from the table3 (Jędzura et al. 2023). Moreover, simultaneous selection index (SSI) was also computed by considering yield and stable behaviour of the evaluated genotypes. The genotypes were ordered as per the SSI values for each of the indices derived from the AMMI analysis, with the highest ranking going to the genotype with the highest yield and stability and the lowest ranking going to the genotype with the lowest yield and instability (Hilmarsson et al. 2021). Simultaneous selection index while considering the higher yield values with their stable performance had ranked the evaluated genotypes. HS562, HPW484, VL2041 were found as least ranked genotypes. The genotypes with stable performance may not be high-yielders as stability alone is not a suitable selection criterion therefore Simultaneous Selection Index, a single non-parametric measure is suggested as the phenotypic characteristics and stability both included in a single selection measure by summing the rankings of the stable performance measure and average yield of genotypes. High SSI is seen to be least stable with low yield, whereas low SSI is thought to be most stable with high yield. Values of ssiMASV had selected HS562, HPW484, VL2041 while ssiWAASB measures found the suitability of HPW484, HS562, HS691 wheat genotypes. Ranks of the evaluated genotypes as per the superiority index mentioned the minimum values of HPW484, HS691, HS562 genotypes.
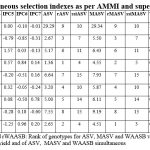 |
Table 3: Simultaneous selection indexes as per AMMI and superiority measures. |
Behaviour of genotypes as per BLUP and Non parametric measures
The BLUP values of the genotypes over the locations had been utilized for calculation of analytic measures i.e. HMGV, RPGV, and HMRPGV to determine the degree of agreement among the analytic measures for choosing stable and high-yielding genotypes (Taleghani et al. 2023). More average values as per the BLUP of genotypes had expressed by HS562, VL2041, HPW484 while the consistent yield exhibited by HS562, VL2041, HS691 genotypes as evident from the CV measure. Large values of GAI measure had obtained by HS562, VL2041, HPW484 genotypes whereas the next measure HMGV also settled for these genotypes. Measures RPGV and RPGV*Meanb had found the suitability of HS562, VL2041, HPW484 genotypes based on their BLUP at individual locations. Last two analytic measures HMRPGV and HMRPGV*Meanb had favourd the HS562, VL2041, HPW484 genotypes in the present study. Non parametric measure Si1 pointed for VL892, HS562, VL3028 whereas as per Si2 measure HS562, VL3028, VL892 while values of Si3 had settled forHS562, VL3028, VL892 and genotypes HS562, VL3028, VL892 pointed by Si4. Measure Si5 had observed the suitability of HS562, VL3028, VL2041 genotypes. Measures Z1 and Z2 represented the normalised values of Si1 & Si2 as tests for their significance had been put forward in literature. Significant differences among the genotypes ranks as per their yield performance across the locations had been express by sum of Z1 values and non significant differences among the genotypes ranks as per Z2 values as observed by Saremirad and Taleghani, 2022. Next composite non parametric measures considered the ranks of genotypes as per yield and their corrected yield values for ranking their behaviour among the considered locations of the zone (Pour-Aboughadareh et al. 2019). Lower values of NPi(1) had selected HS562, VL3028 genotypes whereas NPi(2) had favoured VL892, HS562 and NPi(3) had settled for VL892, HS562 genotypes while VL892, HPW349 wheat genotypes had been pointed by last measure NPi(4) .
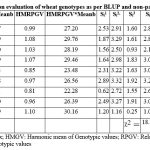 |
Table 4: Performance of multi location evaluation of wheat genotypes as per BLUP and non-parametric measures. |
Multivariate hierarchical clustering as per Ward’s method
The advantage of two ways hierarchical cluster analysis, based on genotypes and various measures has been discussed. By dividing genotypes and measures into homogeneous groups, interactions within groups would be minimized as mentioned by Mostafavi and Saremirad, 2021. Multivariate hierarchical clustering of evaluated and considered measures had been carried out as per Ward’s method as similar performers were grouped together in same group (Khalid et al. 2023). One genotype VL907 was placed in separate group and others performed in similar fashion as per considered measures of this study. Measure Interaction principal component IPC1 had divided others in two groups at the first node of bifurcation. ASV, MASV, WAASB, HMPRGV, non parametric measures along with composite non parametric measure were placed together while analytic measure as per BLUP of genotypes i.e. Meanb, GAI, HMGV, RPGV, HMGV*Meanb, RPGV*Meanb, interaction principal components IPC2, IPC3, IPC4, IPC5, IPC6, IPC7, non parametric measures along with composite non parametric. Further at the second node of classification the measures in first group had been further in five clusters while the measures of bigger group had partitioned into seven clusters.
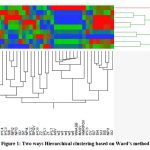 |
Figure 1: Two ways Hierarchical clustering based on Ward’s method. |
Biplot analysis based on first two principal components
First two significant components had accounted for 55.5% of the total variation among the evaluated genotypes and considered measures in the study (Table 5). Respective share of these components were 30.5% and 25% whereas the MASV, ASV, WAASB were major contributors for the first while the more share had augmented by RPGV*Mean, Mean, Meanb, GAI, HMRPGV*Mean, NPi(4) for second one. Wheat genotypes VL907, HS562 and VL892 VL907 had more contributions in respective components.
Table 5: Loadings of measures and wheat genotypes based on principal components
| Measure | PC1 | PC2 | Measure | PC1 | PC2 | Genotype | PC1 | PC2 |
| Mean | 0.069 | 0.302 | GAI | -0.114 | 0.297 | VL907 | 0.701 | 0.379 |
| IPC1 | 0.199 | 0.158 | HMGV | -0.127 | 0.281 | VL2041 | -0.091 | 0.284 |
| IPC2 | -0.017 | -0.081 | RPGV | -0.126 | -0.023 | VL3028 | -0.236 | 0.048 |
| IPC3 | -0.049 | 0.105 | RPGV*Mean | -0.106 | 0.300 | HPW484 | -0.077 | 0.266 |
| IPC4 | -0.119 | 0.118 | HMRPGV | 0.156 | 0.033 | HPW349 | 0.189 | -0.383 |
| IPC5 | 0.047 | -0.037 | HMRPGV*Mean | -0.121 | 0.293 | HS691 | 0.032 | -0.052 |
| IPC6 | -0.125 | 0.133 | Si1 | 0.171 | 0.102 | VL892 | -0.019 | -0.707 |
| IPC7 | -0.039 | -0.171 | Si2 | 0.192 | -0.052 | HS692 | 0.123 | -0.060 |
| ASV | 0.236 | 0.085 | Si3 | 0.197 | -0.060 | HS562 | -0.622 | 0.225 |
| MASV | 0.240 | 0.102 | Si4 | 0.205 | -0.065 | % share of measures (55.50%) | 30.47% | 25.03% |
| W2 | 0.233 | 0.082 | Si5 | 0.203 | -0.070 | |||
| W3 | 0.236 | 0.082 | Si6 | 0.075 | 0.183 | |||
| W4 | 0.236 | 0.081 | Si7 | 0.196 | -0.057 | |||
| W5 | 0.236 | 0.082 | Z1 | -0.171 | -0.102 | |||
| W6 | 0.236 | 0.082 | Z2 | -0.192 | 0.052 | |||
| WAASB | 0.236 | 0.082 | NPi (1) | 0.201 | -0.072 | |||
| Meanb | -0.106 | 0.297 | NPi (2) | 0.068 | 0.187 | |||
| SD | -0.004 | 0.163 | NPi (3) | 0.065 | 0.197 | |||
| CV | 0.118 | -0.252 | NPi (4) | 0.073 | 0.260 |
The symmetrical singular value partitioning method was used to display the biplot of PC1 against PC2 for both genotypes and measurements as this method is useful for understanding how genotypes and adaptability or stability measures would interact. In the biplot graph, close genotypes and environments show positive relations and stable genotypes are located close to the biplot’s origin (Saeidnia et al. 2023). Shorter rays of measures IPC2, IPC5, IPC3, SD contribute less to joint effects of genotypes and measures effects as comparison to CV, Z1, IPC1, HMGV, RPGV*Meanb, GAI, Meanb (Figure 2) . Genotypes observed at far places VL892, HS562, VL902 from the origin in biplot analysis would express the least stable behaviour as compared to genotypes placed near to origin. The nature of G × E is governed by the angle between the genotype and the environmental vectors: it is positive for acute angles, insignificant for straight angles, and negative for obtuse angles (Taleghani et al. 2023). Z1 measure showed direct association with RPGV, IPC2, IPC7 measures while NPi (1) expressed tight direct relation with Si1 ,Si3 ,Si4 ,Si5 ,Si6 ,Si7 measures. WAASB, ASV, MASV measures had exhibited very tight association as rays corresponding to these measures overlapped. The direct association maintained with HMPRVG, Si1 and IPC1 values. Direct tight association of NPi(4) had observed with mean, NPi(2), NPi(3) and Si6, NPi(1). IPC6 & IPC4 had maintained the direct association with Z2 values of genotypes on one side and tight relation with BLUP based analytic measures HMGV, RPGV, HMPRVG*Meanb, GAI, Meanb, RPGV*Meanb values. AMMI analysis based measures ASV, MASV had maintained ninety degree angles with BLUP based analytic measures. CV showed straight line angles with BLUP based analytic measures whereas values of Z1 expressed with ASV, MASV measures.IPC7, IPC2 had same type of relation with NPi(4) and mean values of genotypes over the locations in this study.
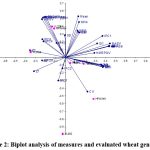 |
Figure 2: Biplot analysis of measures and evaluated wheat genotypes |
Biplot analysis of measures and genotypes based on first two components had observed the five clusters of the measures (Figure 3). Measures IPC2, IPC7, RPGV and Z1 had placed in first cluster in the first quadrant. Second quadrant had found the clustering of CV measure with non parametric measures Si2,Si3,Si4 ,Si5 ,Si7 along with first composite non parametric measure NPi(1) of this study. Composite non parametric measures observed with average yield of genotypes with Si6 and second adjacent cluster was consisted of ASV, MASV, HMPRVG, WAASB, IPC1, Si1 measures. Fifth and largest cluster grouped BLUP based analytic measures Meanb, GAI, RPGV*Meanb, HMPRVG*Meanb, Z2, IPC3, IPC4, IPC6, SD etc.
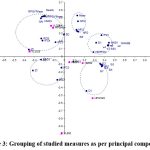 |
Figure 3: Grouping of studied measures as per principal components. |
Conclusion
ANOVA has partitioned the total sum of squares into environments, interactions and genotypes effects for nine wheat genotypes evaluation under advanced varietal trials at major locations of the north hills zone of the country under rain fed conditions. Least values of AMMI stability measure had expressed the desirability of HPW484, HS562, VL2041 whereas HS562, HPW484, VL2041 had been identified by least values of Modified AMMI Stability Value. Higher values of BLUP based analytic measures had found the suitability HS562, VL2041, HPW484 genotypes. Composite non parametric measure NPi(2) had favoured VL892, HS562 and NPi (3) had settled for VL892, HS562 genotypes while VL892 HPW349 wheat genotypes had been pointed by last measure NPi(4). Ward’s method of hierarchical clustering had placed VL907 in separate group as compared to others. Shorter rays of measures IPC2, IPC5, IPC3, SD contribute less to joint effects of genotypes and measures effects in the biplot analysis as comparison to CV, Z1, IPC1, HMGV, RPGV*Meanb, GAI, Meanb. NPi (1) expressed tight direct relation with Si1 ,Si3 ,Si4Si5 ,Si6 ,Si7 measures in the biplot analysis. PC6 and PC4 had maintained the direct association with BLUP based analytic measures. CV measure had clustered with non parametric measures Si2, Si3Si4Si5Si7 along with NPi (1) whereas the adjacent cluster was consisted of ASV, MASV, HMPRVG, WAASB, IPC1, Si1 measures.
Acknowledgement
The authors of the manuscripts had sincerely acknowledged the hard work of the staff working at locations of north hills zone of the country under coordinated wheat and barley improvement program.
Funding Sources
No separate funding was utilised for the study
Conflict of Interest
Authors disclosed no conflict of interest including any financial, personal or other relationships with other people or organizations that can influence their work.
Data Availability Statement
Data used uploaded on website
Ethics Approval Statement
No animals or humans used in experimentations.
Authors’ Contribution
Ajay Verma Field layout, Data Analysed, manuscript preparation
G Singh : Mobilised resources, manuscript preparation
B S Tyagi : Monitored field trials and execution, manuscript preparation
References
- Azam G., Hossain M.A., Sarker U., Alam A.K.M.M., Nair R.M., Roychowdhury R., Ercisli S. and Golokhvast K.S. Genetic Analyses of Mungbean [Vignaradiata (L.) Wilczek] Breeding Traits for Selecting Superior Genotype(s) Using Multivariate and Multi-Traits Indexing Approaches.Plants.2023;12: 1984.
CrossRef - Hilmarsson H.S., Rio S., Sánchez J.I. Genotype by environment interaction analysis of agronomic spring barley traits in Iceland using AMMI, factorial regression model and linear mixed model.Agronomy.2021;11(3):499.
CrossRef - Hossain A., Sarker U., Azam M.G., Kobir M.S., Roychowdhury R., Ercisli S., Ali D., Oba S., Golokhvast K.S. Integrating BLUP, AMMI, and GGE Models to Explore GE Interactions for Adaptability and Stability of Winter Lentils (Lens culinarisMedik.).Plants.2023;12: 2079.
CrossRef - Jędzura S., Bocianowski J. and Matysik P. The AMMI model application to analyze the genotype–environmental interaction of spring wheat grain yield for the breeding program purposes. Cereal ResearchCommunications. 51: 197–205.
CrossRef - Karimizadeh R., Pezeshkpour P., Mirzaee A., Barzali M., Sharifi P., Safari Motlagh, M.R. Stability analysis for seed yield of chickpea (Cicerarietinum L.) genotypes by experimental and biological approaches. Vavilov Journal of Genetics and Breeding. 2023; 27(2):135-145.
CrossRef - Khalid A., Hameed A. and Tahir M.F. Estimation of genetic divergence in wheat genotypes based on agro-morphological traits through agglomerative hierarchical clustering and principal component analysis. Cereal Research Communications.2023;51: 217–224.
CrossRef - Mohammadi , Sadeghzadeh B., Ahmadi M.M., Amri A. Biological interpretation of genotype × environment interaction in rainfed durum wheat.Cereal Res. Commun. 2020 a;48(4):547-554. DOI 10.1007/s42976-020-00056-7.
CrossRef - Mohammadi R., Jafarzadeh J., Poursiahbidi M. M., Hossein H. & Ahmed A. Genotype-by-environment interaction and stability analysis for grain yield in durum wheat using GGE biplot and genotypic and environmental covariates. Agric. Res. 2023; 6: 1–11.
CrossRef - Mohammadi R., Sadeghzadeh B., Poursiahbidi M., Ahmadi M.M. Integrating univariate and multivariate statistical models to investigate genotype × environment interaction in durum wheat. Ann. Appl. Biol. 2020 b;178(3):450-465.
CrossRef - Mostafavi K. and Saremirad A. Genotype—environment interaction study in corn genotypes using additive main effects and multiplicative interaction method and GGE- biplot method. J. Crop Prod. 2021;14: 1–12.
- Olivoto T., Lucio A.D.C., da Silva J.A.G., Marchioro V.S., de Souza, V.Q. Mean performance and stability in multi-environment trials I: Combining features of AMMI and BLUP techniques. Agron.J. 2019; 111(6):2949-2960.
CrossRef - Pour-Aboughadareh A., Yousefian M., Moradkhani H., Poczai P., Siddique K.H.M . STABILITYSOFT: a new online program to calculate parametric and non- parametric stability statistics for crop traits. Applied Plant Science.2019;7:e-1211.
CrossRef - Saeidnia, F., Taherian, M. and Nazeri, S.M. Graphical analysis of multi-environmental trials for wheat grain yield based on GGE-biplot analysis under diverse sowing dates. BMC Plant Biol. 2023;23: 198.
CrossRef - Saremirad A. and Taleghani D. Utilization of univariate parametric and non-parametric methods in the stability analysis of sugar yield in sugar beet (Beta vulgaris) hybrids. J. Crop Breed.2022;14: 49–63.
CrossRef - Sharif, P., Abbasian, A. and Mohaddesi, A. Evaluation the mean performance and stability of rice genotypes by combining features of AMMI and BLUP techniques and selection based on multiple traits. Plant Genet. Res. 2021; 7: 163–180.
CrossRef - Shojaei S.H., Mostafavi K., Omrani A., Omrani S., Mousavi S.M.N., Illes A., Bojtor, C., Nagy J. Yield stability analysis of maize (Zea mays L.) hybrids using parametric and AMMI methods. Hindawi Sci. 2021:5576691.
CrossRef - Taleghani D., Rajabi A., Saremirad A., Fasahat P. Stability analysis and selection of sugar beet (Beta vulgaris) genotypes using AMMI, BLUP, GGE biplot and MTSI. Sci Rep. 2023;13: 10019.
CrossRef - Vineeth T. V., Prasad , Chinchmalatpure A. R., Lokeshkumar B. M., Kumar S., Ravikiran K. T. and Sharma P. C. Weighted average absolute scores of BLUPs (WAASB) based selection of stable Asiatic cotton genotypes for the salt affected Vertisols of India. Indian J. Genet.Plant Breed. 2022; 82: 104–108;
CrossRef - Zali H., Farshadfar E., Sabaghpour S.H., Karimizadeh R. Evaluation of genotype×environment interaction in chickpea using measures of stability from AMMI model. Ann. Biol. Res. 2012; 3(7):3126- 3136.