Introduction
Soil is fundamental and basic resource for agricultural practice. Consequently, soil structural stability is a potential indicator for wide variety of choices to which it is used for ranging from agricultural to engineering considerations. This is because the structural stability of soil influences its nutrient retention and supply, water storage and transmission, aeration propensity, strength and trafficability and capacity to support foundations (Obi, 2000). According to Ogbodo (2012), the soil serves as the natural media that provides the physical and chemical environment for crop production. The primary purpose of soil is to hold and provide water and nutrients to plants, permit gas exchanges to and from their roots, as well as mechanical support. As corroborated by Ekpe (2002), soil structural stability strongly correlates with fertility, infiltration rate, flow of air or water and degree of ramification of network of roots. Furthermore, in assessing of soil structural stability the two major factors of interests are size, stability of aggregates, shaping or orientation of the aggregates (Ekpe, 2002).
Soil structural stability to a great extent determines its ability to resist wind or water erosion, rupture, disintegration or be puddled during mechanical manipulation (Biswas and Mukherjee, 2008). This also correlates to soil productivity. There had been no suitable and practical alternative to soil for crop production. As a result, the necessity of using soil for the production of crops is inevitable (Ogbodo, 2012). However, with the emerging challenges involved in safe and/or conservative use of soil for higher productivity and associated degradation, fertility loss and quality deterioration, it has become imperative that sound system be evolved in ensuring sustainable structural stability for higher soil productivity. There had been number of conservative approaches to enhance and sustain soil structural stability put in place by farmers which included mulching, zero tillage, minimum tillage (Obi, 2000) and fallowing, shifting cultivation and other organic wastes based amendments. In as much as these practices no doubt improve the structure of soil, they do not give consideration to quality assurances or predictive indices for assessment of soil structural stability under different land use systems. Furthermore, evaluation of structural stability of soil under different uses had not been studied extensively in Abakaliki agroecology. It is hoped that this study would attempt to evolve a sustainable predictive indices for assessment of soil structural stability under different uses. The objective of this work was to assess structural stability of soil under different land uses using some predictive indices in Abakalik agroecological environment.
Materials and Methods
Study Area
The study was carried out at Ebonyi State Capital, Abakaliki Urban. The area is located by 06o 41N and longitude 08o65/E in South east of the derived savannah zone of Nigeria. The area experiences a bimodal pattern of rainfall spread from April to July and September to November. The peak periods are normally in July and September while there is a break experienced during August. This is commonly referred to as “August break”. The minimum annual rainfall is 1700 mm and maximum is 2000 mm. The minimum and maximum temperatures range from 27oC to 31oC for rainy and dry seasons, respectively. The relative humidity during rainy season is 80% which declines to 60 % in dry periods. The soil is derived from successive marine deposits from cretaceous and tertiary periods. According to FDALR (1985), Abakaliki agricultural zone is underlain by sedimentary rock and consists of brown olive shales and mudstone from ASU river and associated with sandstone, fine sand, mudstone and grained soil. The soil is unconsolidated up to 1m depth and belongs to the order ultisol classified as Typic haplustult (FDALR, 1985). The area is characterized by growth of shrubs, herbs and medium to tall trees, native vegetation, grasses and sometimes referred to as “derived savanna”.
Location and Identification of Land Uses
Forest predominantly dominated by planted Gmelina arborea was located at Azu-ugwu, Abakaliki urban. The Gmelina trees are about 8m tall and had lasted for more than ten (10) years. Continuously cultivated farm land was located at Azuiyiokwu, Abakaliki within the metropolis. The tillage system practiced was mound method and the crops grown in the land included inter crop of yam/ cassava and maize /vegetables. The soil had been under continuous intensive cultivation for more than six (6) years. The third identified land use was cattle paddock and is located within the Ebonyi State University, Abakaliki Animal Science experimental farm. There had been no any form of cultivation in the place. The fourth land use was fallow land located at Abofia, Okpaugwu, Abakaliki. The area had a history of previous cultivation of yam, cassava and maize. However, the land had been under fallow for more than three years. Thus the land uses considered were viz: forest land, farm land, cattle paddock and fallow land.
Soil Sampling
Auger and core samples were collected at 0-20 cm soil depth, respectively at each of five sampling points in each land use. Core sampler was used to collect samples for analysis of bulk density, total porosity and hydraulic conductivity. Auger sampler was used to collect soil samples for determination of particle size distribution, aggregate stability, mean weight diameter and dispersion ratio. Auger samples were further composited before determination of parameters while mean values were used for total porosity, bulk density and hydraulic conductivity computations.
Laboratory Methods
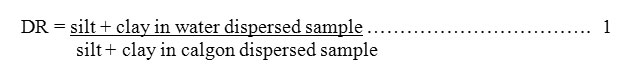
Dispersion ratio was determined as outlined by Nidi Kizza et al., (1984) as follows:
where
DR = Dispersion ratio
Bulk density was determined using Blake and Hartage (1986) method. Total porosity determination was done according to Obi (2000) procedure. Kemper and Roseanau (1986) method was used to determine aggregate stability x as follows:
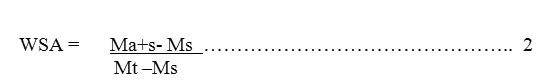
where
Ma + S mass of resistant aggregate plus sand(g)
MS = Mass of sand fraction alone (g)
Mt = total mass of sieved soil (g)
Mean weight diameter (MWD) was calculated using the formular:

where
MWD = Mean weight diameter
Xi = Mean diameter of each size fraction
Wi = Proportion of the total sample weight
Hydraulic conductivity was determined (Obi 2000) as follows:

where
K = Hydraulic Conductivity
Q = Mean of amount of water collected
A = Area of core containing soil sample
T = Time interval of water collection
AH = Constant height of water level (constant head)
L = Length of core containing sample
Particle size distribution was determined using hydrometer method (Gee and Bauder, 1986).
Data Analysis
Data were subjected to coefficient of variation and variability was ranked as little variation (% CV <20), moderate variation (%CV > 20-50) and high variation (%CV >50) according to Awe to (1982). Standard deviation was also used to compare data.
Results and Discussion
Table 1 shows effect of different land use on particle size distribution. Sand fraction generally had little variation (%CV<8) among the different land uses. Percent sand fraction was highest under cattle paddock and slightly varied from that obtained in forest land. There were lower sand fractions in farmland and fallow land compared to other land uses. Conversely, higher silt fractions were recorded under farm land and fallow land than in forest land and cattle paddock. Silt fractions moderately (%CV>26) varied among the land uses. Farm land had highest percent clay fraction when compared with those of other land uses, respectively. This was 18, 27 and 27% higher compared to forest land, cattle paddock and fallow land, respectively. Clay fraction had little variation (%CV<7) among the land uses. The textural class varied from sandy loam for forest land and cattle land to clay loam for farm land and sandy clay loam for fallow land, respectively.
The lower sand fraction obtained under farmland compared to those of other land uses could be attributed to mechanical manipulation as well as continuous disturbance of soil. This could have caused illuviation of silt and clay fractions leaving low sand fraction on the surface. However, dominance of silt fraction does not encourage structural stability of soil. Soils dominated by silt and clay fractions are impervious, impermeable, puddled and are subjected to alternate drying and wetting cycles which do not promote stability of aggregates.
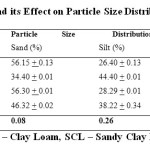 |
Table 1: Land uses and its Effect on Particle Size Distribution of Soil. |
Land Uses and its Effect on Soil Structural Stability
Land uses and its effect on soil structural stability is presented in Table 2. Bulk density highly varied (%CV > 172) among the different land uses. Highest bulk density was obtained under forest land compared to those of other land uses. However, the bulk density of farmland was lowest when compared with those of other land uses. The bulk density followed a low trend of farmland>cattle paddock> fallow land> forest land in stabilization of soil structural stability. Total porosity had an inverse relationship with bulk density. The total porosity moderately varied (%CV >30) among the different land uses with highest value obtained under farmland and least in forest land. The trend of high values obtained in total porosity in the different land uses is forestland>cattle paddock>fallow land and farmland. Mean weight diameter highly varied (%CV >112) among the different land uses. The mean weight diameter of farmland was lower than those obtained in other land uses. The mean weight diameter of the different land uses followed a higher value trend of forestland > cattle paddock> fallow land > farmland. Highest value of MWD was obtained in cattle paddock while lowest value was recorded in farm land. The trend of performance in terms of stabilizing the soil structure is cattle paddock > fallow land > forest land > farm land. The aggregate stability values highly varied (%CV > 245) among the different land uses.
Dispersion ratio highly varied (%CV > 80) among the different land uses. The value for dispersion ratio was highest under forest land compared to those of other land uses. The least value was obtained in farmland. The trend of dispersion ratio in stabilizing soil structural stability is forest land > fallow land > cattle land > forest land. Hydraulic conductivity highly varied (%CV > 112) among the different land uses with cattle paddock giving the highest value. Least value was obtained in farmland. Hydraulic conductivity values were in the order of cattle paddock > fallow land> forestland> farmland for the different land uses and in stabilizing soil structure.
The lowest bulk density obtained in farm land could be attributed to pulverization, disaggregation and loosening effect due to continuous cultivation of soil. This observation is in line with the report of Obi (2000) that the primary purpose of tillage was to loosen the soil. However, in other land uses where the bulk density appreciated, the reason could be that the soil under the land uses is in natural state and least disturbed. Anikwe (2006) noted that high bulk density was better in terms of assessment of soil structural stability. The bulk densities in these land uses fell within non-limiting values for soil productivity (Arshad et al., 1996). Consequently, forestland and fallow land based on their bulk densities could be rated as being more stable and could withstand disruptive forces. Similarly, high total porosity recorded in farmland could be due to more available micro pores in the soil. More available pores encourage high water transmission, aeration, root growth and proliferation. According to Obi (2000), soils with less than 30% porosity are limiting to productivity. As a result all the porosities obtained in the different land uses are above the limiting values for soil productivity. The porosities for cattle paddock >fallow land> forestland could be rated as better and promote more stable soil structure. These porosities can also encourage moderate water transmission and besides, discourage droughtiness. Higher value for mean weight diameter in forestland could be attributed to enrichment from decomposed leaf falls. Similarly, cattle paddock and fallow land also gave higher values for mean weightm diameter and this suggests improvements from cattle dung and additions from vegetations and network of roots. Researchers such as Anikwe (2006) and Obi (2000) have reported that higher values of mean weight diameter were good for soil structural stability.
Aggregate stability also followed the revise of trend as observed in mean weight diameter in assessment of the soil structural stability of the different land uses. Higher values of aggregate stability had been noted to increase soil structural stability (Anikwe, 2006 and Obi, 2000). Nwite (2013) reported that high values of aggregate stability had positive impact on structure of soil as they reduced its mechanical breakdown.
Higher dispersion ratio in forest land indicated that leaf falls and sloughed off roots are better “soil conditioners” than cattle dung, shrubs, herbs or grasses in cattle paddock and fallow land. Since dispersion ratio indicates rate of soil resistance to disaggregation or dispersion. Higher values are considered as best in terms of soil structural stability. The highest hydraulic conductivity obtained in cattle paddock could be due to more available bio pores as a result of microbial activity and effect of cattle dung. High hydraulic conductivity promote effective water transmission and encourage good aeration. Generally, all the values of hydraulic conductivity for the different land uses could be rated as moderately high (Anikwe, 2006). The higher the hydraulic conductivity, the better it is for good soil structural stability.
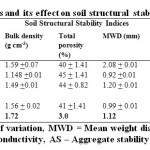 |
Table 2: Land Uses and its effect on soil structural stability. |
Conclusion
This study has indicated that some predictive indices could be used to assess soil structural stability under different land uses. Land uses affected distribution of soil particle size distribution and textural class. Sand fraction was predominantly higher in different land uses than silt and clay fractions, except for farmland. The various indices used for assessing soil structural stability under different land uses indicated that soils subjected to least use in terms of their disturbance had better structural stability than continuously cultivated farmland. Generally, the different land uses could be rated in the order of forestland > cattle paddock > fallow land > farmland in terms of their structural stability stabilization as indicated by the predictive indices.
References
- Arshad, M.A., Lowery, B. and Grossman, B. (1996). Physical Tests for monitoring soil quality. In: Doran, J.W., Jones, A.J. (Eds). Methods for Assessing Soil Quality Special Publication No 49. Madison, WI, 49: 56-89.
- Anikwe, M.A.N.(2006). Soil Quality Assessment and Monitoring: A Review of Current Research Efforts, Nigeria. 208pp.
- Aweto, A.O. Variability of Upper Scope Soils Development under sandstones in southwestern Nigeria. J. Geographine 1982;5: 27-37.
- Biswas, T.D. and Mukherjee, S.K. Textbook of Soil Science. 2nd ed. Tata McGraw-Hill Publishing Company Ltd., New Delhis 422pp.(2008).
- Blake, G.R. and Hartge, K.H. (1986). Bulk Density In: Klute, A. (ed). Methods of Soil Analysis Part 1. Physical and Mineralogical Methods. American Society of Agronomy, Madison, W1, USA.
- Ekpe, I. I. The effects of Shelter belt on soil Physical Properties in the Dry Northern Nigeria. M.S.c Dissertation, UDUS 84pp. (2002).
- Federal Department of Agricultural land Resources (FDALR) (1985). Resonance Soil Survey of Anambra State, Nigeria Soil Reprot, Kaduna, 3p.
- Gee, G.N. and Bauder, J.W. Particle Size Analysis. In: Klute, A. (eds). Methods of Soil Analysis. Part 1. Physical and Microbiological Methods. American Society of Agronomy 1986;9:383-411.
- Kemper, W.D. and Rosenan, R.C. Aggregate Stability and Size Distribution. In: Klute A. (ed). Methods of Soil Analysis. Part 1. American society of Agronomy 1986;9: 425-440.
- Ndii Kizza, P.J.W. Bigger, H.M., Selina, J.H., Genuchitem, J.J. H, Daridson, W. J.I.M. and Nelson, D.R. The equivalence of two conceptual models for describing ion exchange during transport through aggravated oxisoils. Water Resource 1984;20:1123-1130.
CrossRef - Nwite, J.N. Evaluation of the Productivity of a Spent Automobile Oil-Contaminated Soil Amended with Organic Wastes in Abakaliki Southeastern Nigeria 2013;130pp.
- Obi, M.E. Soil Physics: A Compendium of Lecturers. Nsukka, Atlanto, publishers, Nigeria 2000;148pp.
- Ogbodo, E.N. Alternative Media and Mixes Suitable for Growing Container Vegetables 2013;22(2):308–315.
- Smith, C.W., Johnson, M.A. and Lovenrntz, S.I.(1998). Assessing the Compaction Susceptibility of South Africa forestry Soils, 11: Soil Properties affecting compatibility and compressibility. Soil Tillage Research 1998;43: 33-56.