Introduction
Maize (Zea mays L.) is one of the most important crop in Ethiopia and is grown across 13 agro-ecological zones. It is the first crop in production more than any other cereal crop in the country. Over half of all Ethiopian farmers grow maize, mostly for subsistence, with 75% of all maize produced in the country is consumed as human food.
According to a 2012 FAO report, Ethiopia is the fourth largest maize producing country in Africa, and first in the East African region. It is also significant that Ethiopia produces non-genetically modified (GMO) white maize, the preferred type of maize in neighbouring markets (CSA, 2013). Based on area of production major cereals in the country, teff ranked first, followed by maize, sorghum and wheat, respectively, whereas maize ranks first in total grain production, followed by teff, wheat and sorghum (CSA, 2014).
Hybrid cultivars have been contributing immensely in increasing area allotted for maize production and productivity of maize per unit area of production (Kanagarasu, 2010). In Ethiopia, the average yield in kilogram per hectare at national level was increased by 4.8% in 2012-2013 (CSA, 2013). Out of the total grain crop area, 79.38% (9,848,745.96 hectares) was under cereals of which 16.08% was occupied by maize (1,994,813.80 hectares). Cereals contributed 85.81% (583,522.561 tons) of the grain production from which maize made up 25.81% (21583522.56 tones). Maize yield was also increased from 5.41% (3.059 tons per hectare) to 6.37% (3.254 tons per hectare in 2012-2013 (CSA, 2014). Ethiopia’s current national maize yield is 3.25 metric tons per hectare, 28% above the developing world average of 2.5 MT/ha. The ‘developed’ world, however, result with average yields of 6.2 MT/ha, with some countries actually exceeding 10 MT/ha (CSA, 2013). The above results show progress of maize production in Ethiopia for own consumption and/or economic benefits. The benefits are results of the use of improved maize varieties, particularly conventional type of hybrids.
Currently, concentrated efforts are underway in the country by different maize research institutions to move more toward the use of hybrids varieties. To fulfill this aim, combining ability studies have prime importance in maize hybrid development since it provides information for the selection of parents and also provides information on the nature and magnitude gene actions. The two types of combining ability, general (GCA) and specific (SCA) have been recognized in genetic studies. General combining ability relates to additive gene effects, while specific combining ability reflects the non-additive gene actions (Sprague and Tatum, 1942). GCA is average performance of a parent in a series of crosses and SCA designates those cases in which certain combinations perform relatively better or worse than would be expected on the basis of average performance of parents. The GCA includes additive and additive × additive variances, while SCA is responsible for non-additive genetic variances (Ibni Amin Khalil, 2010). In specific combining ability; dominance or epistatic effects of genes are commonly involved in maize (Rahman, 2013). With this aim in mind, this research was conducted with the objective to study heterosis and combining ability in maize (Zea mays L.) for yield and yield related traits in eastern Ethiopia.
Materials and Methods
Planting Materials
The experimental materials comprised of 28 F1 hybrids obtained from a cross between 8 inbred lines in a diallel fashion plus the parental lines and one standard check (BH 660). The description of the lines is depicted in table 1. All the lines have been developed by Haramaya University Maize Research Program, Ethiopia. F1 hybrids have been obtained by crossing in 8 x 8 diallel mating design in the main cropping season of 2010.
Methods
The 28 F1 hybrids plus the parental lines were tested in 2011/2012 and 2012/13 cropping seasons for two years at Haramaya University main campus (Raare research site) using randomized complete block design with three replication. Each plot consisted of four rows with row length of 5.1m. Tow Seeds were sown per hill and at 4-5 leaf stage thinned to one plant per hill. The distance between rows and between plants with in the row was maintained at 0.75m and 0.30m, respectively. At sowing, P2O5 at the rate of 46kg/ha in a form of DAP and 35 kg/ha of N in a form of urea was applied. At about booting stage, 35 kg/ha N was also applied. All other field management practices including stalk borer and armyworm control were done as required. Data were collected from the middle two rows leaving the end hills. Data were collected on days to maturity, ear length, ear diameter, number of rows per ear, number of kernel rows per ear, 1000 kernel weight (g) and grain yield in t/ha. Before analysis of the data, both grain yield and 1000 kernel weight were adjusted to 12.5% moisture content.
Statistical Analysis
All data were subjected to simple analysis of variance to see the existence of genetic variability whether there are differences between the tested genotypes before running combining ability analysis.
Analysis of variance for general combining ability (GCA) and specific combining ability (SCA)
was done following Method II, Model I as suggested by Griffing (1956).
Heterosis expressed as increase or decrease of F1 hybrid value over mid-parent (relative heterosis), better parent (heterobeltiosis) and over the best commercial check (standard heterosis) were calculated for each character using the following formulas suggested by Hayes et al. (1955).
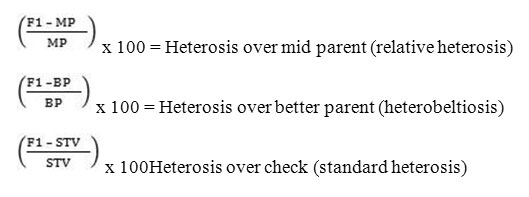
Where: F1=mean performance of F1, MP = mean mid-parental value = (P1 + P2)/2, P1= mean performance of parent one, P2 = mean performance of parent two, BP= mean performance of better parent, CC= mean performance of the best commercial check.
Results and Discusions
Effect of Genotypes on the Genetic Variation of Maize
The analysis of variance showed highly significant differences between the genotypes for grain yield, days to maturity and yield component traits indicating there is sufficient genetic variation among the tested genotypes. Several maize researchers also found statistically significant differences between the genotypes for grain yield and yield related traits in their study on heterosis and combining ability of maize (Dagne et al., 2007; Amiruzzaman et al., 2010;
Table 1: List of Lines used in the Study.
|
No. |
Inbred line |
Kernel color |
Maturity type |
|
1. |
AL-165 |
White |
Late |
|
2. |
Al-173 |
White |
Late |
|
3. |
AL-183 |
White |
Late |
|
4. |
AL-186 |
White |
Late |
|
5. |
AL99-AL-119 |
White |
Late |
|
6. |
AL99-AL-151 |
White |
Late |
|
7. |
AL99-AL-270 |
White |
Late |
|
8. |
AL99-AL-79 |
White |
Late |
Source: Haramaya University Maize Research Program
Amanullah et al., 2011 and Shushay et al., 2014). Days to maturity and grain yield showed statistically highly significant difference between the genotypes in their response to seasonal variation/year of testing. Significant interaction between genotype and year of testing was detected for 1000 kernel weight and grain yield indicating the need for testing varieties/genotypes over locations and seasons in order to see their performance under the different environments (Table 2). Similar result was also noticed by Dagne et al., 2007).
Table 2: Mean Squares due to Grain Yield and Yield Components of Maize (Zea mays L.) in Eastern Ethiopia.
| Source of variation | d.f. | DM | EL (cm) | ED (cm) | KRE | KR | TKWT (g) | GY t/ha) |
| Replication | 2 | 320.73 | 6.25 | 0.205 | 3.17 | 248.14 | 938.91 | 0.87 |
| Genotype (G) | 35 | 3536.46** | 6.68** | 0.23** | 3.10** | 59.89** | 29012.82** | 15.39** |
| Year (Y) | 1 | 19.40** | 0.18 | 0.02 | 0.02 | 10.23 | 573.63 | 87.70** |
| G x Y | 35 | 9.36 | 2.36 | 0.07 | 1.58 | 18.10 | 1779.20* | 3.25** |
| Error | 142 | 11.26 | 1.86 | 0.14 | 2.06 | 23.56 | 1109.12 | 1.23 |
*, ** = significant at 0.05 and 0.01 level of significant, respectively and d.f. = degrees of freedom, DM = Days to maturity; EL = Ear length; ED = Ear diameter; KRE = Kernel rows per ear; KR = Kernels per row; TKWT = Thousand kernel weight; GY = Grain yield
Mean Performance of Genotypes F1 Hybrids and Parents
There were significant differences between the genotypes for grain yield (table 3). The yield of the crosses ranged from 7.15 – 10.15 kg/ha. Top yielding crosses were L1 x L4 (10.15 t/ha), L1 x L5 (10.05t/ha), L7 x L8 (10.04 t/ha), L3 x L8 (9.60t/h), L3 x L5 (9.55t/ha), L1 x L7 (9.48 t/ha), L3 x L6 (9.16 t/ha, L3 x L7 (9.01 t/ha) produced over 9 t/ha of grain per hectare, whereas the yield of lines ranged from 4.53-6.12 t/ha (Table 3).
Table 3: Mean performance of maize crosses and lines for grain yield and yield components of maize (Zea mays L.) in eastern Ethiopia.
| No. | Crosses |
Ear length (cm ) |
Ear diameter (cm) |
Kernel rows per ear |
Kernels per row |
Thousand kernel weight (g) |
Grain yield (t/ha) |
| 1 | L 1 x L 2 |
16.55 |
4.14 |
14.00 |
33.00 |
373.00 |
8.33 |
| 2 | L 1 x L 3 |
17.33 |
3.98 |
12.00 |
36.00 |
366.67 |
3.83 |
| 3 | L 1 x L 4 |
16.67 |
4.17 |
12.00 |
32.00 |
390.00 |
10.15 |
| 4 | L 1 x L 5 |
17.20 |
4.26 |
12.00 |
34.00 |
396.00 |
10.07 |
| 5 | L 1 x L 6 |
16.67 |
3.85 |
12.00 |
34.00 |
371.33 |
7.88 |
| 6 | L 1 x L 7 |
16.71 |
4.23 |
12.00 |
38.00 |
361.00 |
9.48 |
| 7 | L 1 x L 8 |
16.19 |
3.99 |
12.00 |
31.00 |
383.00 |
8.67 |
| 8 | L 2 x L 3 |
16.67 |
4.55 |
12.00 |
37.00 |
394.00 |
8.91 |
| 9 | L 2 x L 4 |
17.31 |
4.45 |
12.00 |
32.00 |
3.61.17 |
8.28 |
| 10 | L 2 x L 5 |
17.21 |
4.62 |
12.00 |
38.00 |
395.67 |
8.94 |
| 11 | L 2 x L 6 |
17.41 |
3.38 |
12.00 |
37.00 |
386.00 |
8.40 |
| 12 | L 2 x L 7 |
17.28 |
3.86 |
12.00 |
38.00 |
407.67 |
8.31 |
| 13 | L 2 x L 8 |
16.61 |
4.38 |
14.00 |
37.00 |
369.17 |
7.88 |
| 14 | L 3 x L 4 |
16.92 |
3.98 |
12.00 |
30.00 |
390.00 |
8.73 |
| 15 | L 3 x L 5 |
18.04 |
4.24 |
12.00 |
40.00 |
407.67 |
9.55 |
| 16 | L 3 x L 6 |
16.92 |
4.34 |
12.00 |
38.00 |
335.83 |
9.16 |
| 17 | L 3 x L 7 |
16.54 |
4.42 |
12.00 |
40.00 |
389.83 |
9.01 |
| 18 | L 3 x L 8 |
17.42 |
4.08 |
12.00 |
41.00 |
408.33 |
9.60 |
Table 3(B): Mean performance crosses and lines …
| No. | Crosses | EL (cm) | ED (cm) | KR per ear | KPR | TKWT weight (g) | GY (t/ha) |
| 19 | L 4 x L 5 | 16.62 | 4.34 | 12 | 39 | 375.67 | 8.35 |
| 20 | L 4 x L 6 | 17.54 | 4.13 | 12 | 34 | 397.5 | 8.31 |
| 21 | L 4 x L 7 | 17.17 | 3.9 | 10 | 37 | 378.5 | 7.15 |
| 22 | L 4 x L 8 | 17.38 | 4.49 | 12 | 31 | 391.33 | 7.33 |
| 23 | L 5 x L 6 | 17.54 | 4.28 | 12 | 37 | 367.5 | 8.52 |
| 24 | L 5 x L 7 | 16.58 | 4.28 | 10 | 34 | 387.83 | 8.1 |
| 25 | L 5 x L 8 | 17.21 | 4.21 | 14 | 36 | 371.33 | 8.85 |
| 26 | L 6 x L 7 | 18.08 | 4.26 | 12 | 37 | 387.67 | 8.89 |
| 27 | L 6 x L 8 | 17.5 | 4.21 | 10 | 38 | 390.83 | 7.71 |
| 28 | L 7 x L 8 | 17.08 | 4.23 | 12 | 33 | 338.33 | 10.04 |
| 29 | L 1 (Line 1) | 14.52 | 3.87 | 12 | 31 | 139 | 4.84 |
| 30 | L 2 (Line 2) | 14.21 | 4.29 | 14 | 36 | 254.67 | 5.22 |
| 31 | L 3 (Line 3) | 14.95 | 4.28 | 12 | 34 | 245.83 | 6.12 |
| 32 | L 4 (Line 4 | 14.83 | 4.24 | 12 | 39 | 208.67 | 4.53 |
| 33 | L 5 (Line 5) | 15.33 | 4.32 | 12 | 36 | 287.5 | 5.45 |
| 34 | L 6 (Line 6) | 14.08 | 4.4 | 12 | 35 | 225.17 | 5.36 |
| 35 | L 7 (Line 7) | 16.04 | 4.09 | 12 | 38 | 180.5 | 5.48 |
| 36 | L 8 (Line 8) | 14.51 | 4.44 | 10 | 27 | 332.5 | 5.33 |
| LSDP0.01 | 2.056 | 0.387 | 1.638 | 7.317 | 50.2 | 1.67 | |
| CV% | 8.22 | 8.96 | 12,210 | 13.68 | 9.55 | 13.96 |
Statistically significant differences (LSD at P0.01 level of significance) have been observed for all yield related traits (Table 3). Days to maturity ranged from 157-173. Almost all the hybrids were relatively earlier that the parents. L8 was the latest to reach maturity, where as the hybrid L2 x L3 was the fastest to mature. Ear length ranged from 14.08-18.08cm. Inbred lines exhibited shorter ear length compared to the hybrids. Ear diameter ranged from 3.38-4.49 cm; average kernel rows per ear ranged from 10 – 12; kernels per row from 27 – 41 and 1000 kernel weight from 138 – 408 grams obtained by L1 and L3 x L5, respectively. The top yielding hybrids also showed medium to high values for yield components.
Heterosis for Yield and Yield Related Traits
Percent (%) mid-parent (MPH), better parent (BPH) and standard heterosis (STH) were computed for grain yield and related traits (table 4). STH was considered only for grail yield. The top ten high yielding crosses significant and high MPH, BPA and standard heterosis compared to the remaining crosses. MPH for grain yield ranged from 42.9 to 116.6%, for BPH from 33.4 to 113.3% and for standard STH from -8.9 to 29.9% (Table 4). Amiruzzaman et al., (2010) in their study on combining ability and heterosis for yield and yield components reported similar result. Rodrigo et al., (2012) also reported statistical significant heterosis for yield and different agronomic traits in their study on genetic divergence among maize hybrids and correlations with heterosis and combining ability
Table 4: Heterosis (%) for yield related traits and grain yield of maize (Zea mays L.) in eastern Ethiopia.
| Cross | Days to maturity | Ear length | Ear diameter | Rows/ear | Kernels/row | 1000 KWT | Grain yield | ||||||||
| MPH | BPH | MPH | BPH | MPH | BPH | MPH | BPH | MPH | BPH | MPH | BPH | MPH | BPH | STH | |
| L1 x L2 | -19 | -10 | 12.4 | 8.8 | 1.5 | -3.7 | 6.9 | -2.3 | -2.7 | 5.4 | 84.8 | 40.9 | 67.1 | 64.2 | 6.1 |
| L1 x L3 | -13.8 | -6 | 14.8 | 13.8 | -2.3 | -7.4 | 3 | -12.3 | 12.4 | 7.4 | 90.6 | 49.2 | 61.1 | 49.5 | 12.5 |
| L1 x L4 | -11.1 | -3 | 10.8 | 9.4 | 2.8 | -1.7 | 6.1 | -12.3 | -7.6 | -17.9 | 51.6 | 86.9 | 116.6 | 113.3 | 29.3 |
| L1 X L5 | -12.9 | -5 | 12.5 | 12.2 | 4 | -1.5 | 0 | -12.3 | 1.5 | -3.3 | 85.7 | 37.7 | 95.7 | 89.8 | 28.3 |
| L1 x L6 | -14.7 | -8 | 10.9 | 9.5 | -6.9 | -13.3 | 8.6 | 2.8 | 3.3 | -3.3 | 103.9 | 64.9 | 54.5 | 49.4 | 0.4 |
| L1 x L7 | -17.5 | -9 | 6.8 | 4.3 | 6.1 | 3.3 | 1.5 | -12.3 | 10.4 | 0 | 126.6 | 100.6 | 83.7 | 77.5 | 20.8 |
| L1 x L8 | -19 | -8 | 9.9 | 6.4 | -2.2 | -11 | 4.6 | -14.8 | 6.9 | 14.1 | 62.9 | 15.5 | 73.9 | 69.2 | 10.4 |
| L2 x L3 | -23.9 | -13 | 14.3 | 11.8 | 6.2 | 6.1 | -9.4 | -15 | 3 | 1.4 | 4 | 48.9 | 58.4 | 49.6 | 13.5 |
| L2 x L4 | -14.4 | -6 | 19.2 | 16.3 | 4.3 | 3.8 | -4 | -10 | -12.2 | -18.7 | 2.1 | 36.5 | 71.4 | 65.2 | 5.5 |
| L2 x L5 | -9.4 | -4 | 16.5 | 12.7 | 7.3 | 7 | -4 | -10 | 9.8 | 3.7 | 2.9 | 37.6 | 69 | 66 | 13.9 |
| L2 X L6 | -19.8 | -11 | 20.1 | 17 | 0.8 | -0.5 | 4.2 | -7.5 | 21.7 | 2.8 | 4.5 | 45.8 | 60.2 | 58 | 7 |
| L2 x L7 | -20.9 | -10 | 14.2 | 8.2 | -8 | -10.3 | -6.6 | -12.5 | 2.2 | -6.6 | 36.7 | 54 | 56.6 | 53.3 | 5.9 |
| L2 x L8 | -6.8 | -3 | 15.7 | 11.6 | 0.3 | -1.4 | 11.4 | -2.5 | 2.3 | 0.9 | -3.1 | 11 | 50.7 | 48.8 | 0.4 |
| L3 x L4 | -2.5 | 0 | 13.6 | 13.2 | -6.6 | -7 | -8.1 | -2.9 | -20.2 | -23 | 8.1 | 58.6 | 63.9 | 49 | 11.2 |
| L3 x L5 | -12.7 | -7 | 19.2 | 17.9 | -1.4 | -1.9 | -5.4 | -5.4 | 11.5 | 10.6 | 4.1 | 41.8 | 65.1 | 59.3 | 21.7 |
| L3 x L6 | -14.6 | -7 | 13.7 | 13.2 | 0 | -1.4 | 5.7 | 0 | 18.9 | 8.5 | -10.9 | 36.6 | 59.6 | 53 | 16.7 |
Table 4 (B): Heterosis (%) for yield related traits and grain yield of maize (Zea mays L.) in eastern Ethiopia …
| Ear length | Ear diameter | Rows/ear | Kernels/row | 1000 KWT | Grain yield | ||||||||||
| MPH | BPH | MPH | BPH | MPH | BPH | MPH | BPH | MPH | BPH | MPH | BPH | MPH | BPH | STH | |
| L3 x L7 | -19 | -8 | 6.7 | 3.2 | 5.5 | 3.3 | -5.4 | -2.8 | 9.6 | 4.8 | 27.6 | 58.6 | 55.3 | 49.8 | 14.8 |
| L3 X L8 | -8.5 | -5 | 18.3 | 16.8 | -6.4 | -8.3 | 7.2 | 2.8 | 8.7 | 20.2 | 5.1 | 22.8 | 67.7 | 60.8 | 22.3 |
| L4 x L5 | -5 | -2 | 10.3 | 8.6 | 1.4 | 0.5 | -10.8 | -10.8 | 6.7 | -0.9 | 2.5 | 30.7 | 67.3 | 58.1 | 6.4 |
| L4 x L6 | -15.3 | -6 | 18.4 | 18.3 | -4.4 | -6.3 | 5.7 | 0 | 5.2 | -12.1 | 13 | 38.3 | 68 | 59.7 | 5.9 |
| L4 x L7 | -21.4 | -8 | 11.2 | 7.3 | -6.5 | -8.2 | -13.5 | -11.1 | -0.9 | -6.8 | 34.9 | 31.7 | 42.9 | 33.4 | -8.9 |
| L4 x L8 | -16 | -8 | 18.5 | 17.4 | 3.5 | 1.2 | -4.3 | -8.3 | -20 | -22.6 | 7.7 | 17.7 | 48.7 | 40.6 | -6.6 |
| L5 x L6 | -13.7 | -6 | 16.4 | 14.7 | -1.8 | -2.8 | -5.7 | -10.8 | -11.8 | -24.9 | -3.9 | 27.8 | 57.8 | 57 | 8.5 |
| L5 x L7 | -18.1 | -7 | 5.7 | 3.4 | 1.4 | -1.2 | -16.2 | -16.2 | -3 | -11 | 24.6 | 34.9 | 48.2 | 47.9 | 3.2 |
| L5 X L8 | -19.5 | -11 | 15.3 | 12.6 | -3.9 | -5.3 | 10.2 | 2.8 | 0.6 | 0 | -5.8 | 926.6 | 64.2 | 63.1 | 12.7 |
| L6 x L7 | -13.1 | -6 | 17.3 | 13.2 | 0.2 | -3.3 | 0 | -5.4 | 19.5 | -1.8 | 91.1 | 72.2 | 64 | 62.9 | 13.2 |
| L6 x L8 | -11.1 | -5 | 19.4 | -13.5 | -4.8 | -4.3 | -1.5 | -13.5 | 16 | 6.1 | 40.2 | 17.5 | 44.2 | 25.3 | -1.8 |
| L7 x L8 | -13.8 | -5 | 11.8 | -2.8 | -0.9 | -4.9 | 1.5 | -2.8 | -8.5 | -12.3 | 24.2 | 1.8 | 85.8 | 84.4 | 27.9 |
| L1 = Line 1, L2 = Line 2, L3 = Line 3, L4 = | Line 4, L5 = Line 5 | , L6 = Line 6 | , L7 = | Line 7, L8 = line 8, MPH = mid-parent | |||||||||||
| heterosis, BPH = Better parent heterosis, STH = standard heterosis | |||||||||||||||
Both mid-parent and better parent heterosis for days to maturity are negative for all the crosses. For this trait, mid-parent heterosis ranged from -2 to -13% and better parent heterosis -5 to -23%. This showed that hybrids tend to be earlier in maturity compared to their parents. In this study, ear diameter, number of rows per ear and number of kernels per row showed low/negligible level of heterosis, whereas ear length and 1000 kernel weight produced relatively high and positive heterosis. The range of mid-parent and better parent heterosis for ear length was 5.7 to 20.1% and -13% to 18.3%, respectively, whereas mid-parent and better parent heterosis for 1000 kernel weight was -5.8 to 126.6% and 1.8 to 100.6%, respectively (table 4). Praveen Kumar et al., (2014) in their study on heterosis for grain yield and its component traits in maize (Zea mays L.) also reported positive and significant heterosis for yield component traits. Similarly findings were reported by Dagne et al. (2009), Amnnullah et al., (2011) and Ali et al., (2014) in their study on maize.
Variances due to general combining ability (GCA) and specific combining ability (SCA) estimates
The analysis of combining ability variance components was estimated to determine precisely the importance of additive and dominance components in the inheritance of the traits under study. Mean squares due to GCA and SCA for different traits of maize (Zea mays L.) in 8 x 8 diallel crosses are presented in table 5. The mean squares due to GCA for days to maturity, ear diameter, member of kernels per row, 1000 kernel weight and grain yield were significant, indicating the importance of additive genetic variance in controlling these traits. Similar results were reported by other authors in their study on heterosis and combining ability for yield and yield related traits in maize (Dagne et al., 2007; Alam et al., 2008; Aliu et al., 2008; Amiruzaaman et al., 2010; Melkamu, 2013). The mean squares due to SCA were also significant for days to maturity, ear length, member of kernels per row and 1000 kernel weight indicating the importance of non-additive genetic variance in controlling these traits. GCA: SCA for days to maturity showed that both additive and non-additive gene actions played a role in conditioning days to maturity, number of kernels per row and 1000 kernel weight.
Table 5: Mean squares for general combing ability (GCA) and specific combing ability (SCA) for yield and yield related traits in maize.
alsa
| Traits | Mean squares | |||
| GCA (9) | SCA (45) | Error (198) | GCA: SCA | |
| DA | 7.18** | 10227.84** | 2.54 | 0.001 |
| EL (cm) | 2.44 | 7.74** | 1.98 | 0.315 |
| ED (cm) | 0.43* | 0.18 | 0.13 | 2.389 |
| KRE | 5.29 | 2.55 | 1.98 | 2.075 |
| KR | 105.64* | 48.45** | 22.73 | 0.022 |
| TKWT (g) | 10679.52** | 33596.14** | 0.013 | 0.318 |
| GY/ha (kg) | 4.45** | 18.13 | 1.63 | 0.245 |
Estimates of general combining ability of lines for yield and yield related traits
Inbred lines L1, L3, L5 and L7 had good general combining ability for grain yield and these lines may be successfully used in hybrid formation or as component for synthetic cultivar formation. For days to maturity, most of the lines (L2, L3, L4, L5 and L8) showed negative general combining ability effects for the trait indicating that they may be good sources of genes for earliness. Lines 2, 3 and L5 showed good general combining ability for most of the traits studied (table 6).
Table 6: Estimates of GCA effects of lines for grain yield and yield components in maize (Zea mays L.) at Haramaya, eastern Ethiopia.
|
Line |
Traits |
||||||
|
DM |
EL (cm) |
ED (cm) |
KR |
KRE |
TKWT |
GY(t/ha) |
|
| Line 1 |
0.871* |
-0.350** |
-0.169** |
-0.008 |
-1.946** |
-21.692** |
0.165 |
| Line 2 |
-0.379 |
-0.186** |
0.092** |
0.625** |
0.371 |
5.908 |
-0.195 |
| Line 3 |
-0.363 |
0.041* |
0.011 |
-0.008 |
1.038** |
4.708 |
0.459 |
| Line 4 |
-0.996* |
-0.005 |
-0.011 |
-0.308** |
-0.646* |
-3.542 |
-0.408 |
| Line 5 |
-0.779* |
0.175** |
0.082** |
-0.075** |
1.054** |
13.975 |
0.185 |
| Line 6 |
0.771 |
0.194** |
0.021* |
0.192** |
0.738* |
-4.992 |
-0.184 |
| Line 7 |
1.038** |
0.221** |
-0.068** |
-0.242** |
1.288** |
-12.508** |
0.048 |
| Line 8 |
-0.163 |
-0.091 |
0.042* |
-0.175** |
-1.896** |
18.142 |
-0.070 |
| SE(gi) |
0.784 |
0.0289 |
0.0019 |
0.0289 |
0.3315 |
18.0809 |
0.0238 |
| SE (gi-gj) |
1.792 |
0.0660 |
0.0043 |
0.0662 |
0.7576 |
41.3277 |
0.0544 |
*, ** significant at 0.05 and 0.01 level of significant, respectively; DA = days to maturity; EL = ear length; ED = ear diameter; KRE = Kernel rows per ear; KR = Kernels per ear; TKWT = thousand kernel weight; GY = grain yield
Estimates of specific combining ability of crosses for yield and yield related traits
Estimates of specific combining effects are depicted in table 7. Most of the crosses exhibited negative values of specific combining ability effects for days to maturity indicating that these specific crosses have good genes for earliness. Several of the crosses showed good specific combining effects for yield and yield component traits. Twelve selected hybrids from the tested hybrid combonations had positive specific combining ability for most of yield related traits and over 10% standard heterosis for grain yield (table 8). Some of these identified hybrids may be released for commercial production of the maize crop after testing and verifying their performance at 2-3 locations for about two more years.
Table 7: Estimates of SCA effects for days to maturity, yield components nd agrain yield of maize (Zea mays L.) in 8 x 8 diallel crosses.
| No |
Cross |
DM | EL (cm) | ED (cm) | KR | KRE | TSW | GY (tons) |
| 1 |
L 1 x L 2 |
-3.043 |
0.50 |
-0.01 |
0.63 |
-1.25 |
40.24 |
0.42 |
| 2 |
L 1 x L 3 |
-1.393 |
1.05 |
-0.09 |
-0.07 |
1.75 |
35.10 |
0.27 |
| 3 |
L 1 x L 4 |
-1.259 |
0.43 |
0.12 |
0.23 |
-0.74 |
66.69 |
2.45 |
| 4 |
L 1 x L 5 |
-1.143 |
0.78 |
0.12 |
0.00 |
-0.60 |
55.17 |
1.18 |
| 5 |
L 1 x L 6 |
-1.526 |
0.23 |
-0.23 |
0.73 |
-0.12 |
49.47 |
-0.04 |
| 6 |
L 1 x L 7 |
-1.1793 |
0.25 |
0.24 |
0.17 |
3.16 |
46.65 |
1.33 |
| 7 |
L 1 x L 8 |
-3.593 |
0.04 |
-0.11 |
-0.23 |
-0.65 |
39.00 |
0.63 |
| 8 |
L 2 x L 3 |
-6.976 |
0.22 |
0.22 |
-1.03 |
-0.07 |
34.84 |
0.71 |
| 9 |
L 2 x L 4 |
-3.009 |
0.91 |
0.14 |
-0.07 |
-3.39 |
10.25 |
0.95 |
| 10 |
L 2 x L 5 |
1.607 |
0.63 |
0.22 |
-0.30 |
0.75 |
27.24 |
1.01 |
| 11 |
L 2 x L 6 |
-4.609 |
0.82 |
0.04 |
-0.23 |
0.70 |
36.54 |
0.84 |
| 12 |
L 2 x L 7 |
-4.043 |
0.66 |
-0.39 |
-0.47 |
0.35 |
65.72 |
0.52 |
| 13 |
L 2 x L 8 |
2.657 |
0.30 |
0.01 |
0.80 |
2.70 |
-3.43 |
0.21 |
| 14 |
L 3 x L 4 |
3.307 |
0.29 |
-0.25 |
-0.10 |
-5.72 |
40.29 |
0.74 |
| 15 |
L 3 x L 5 |
-2.076 |
1.23 |
-0.08 |
0.00 |
2.41 |
40.44 |
0.97 |
| 16 |
L 3 x L 6 |
-2.126 |
0.09 |
0.08 |
0.40 |
1.06 |
-12.43 |
0.95 |
| 17 |
L 3 x L 7 |
-3.393 |
-0.31 |
0.25 |
0.17 |
2.01 |
49.09 |
0.56 |
Table 7(B): Estimates of SCA effects …
|
No |
Cross |
DM | EL (cm) | ED (cm) | KR | KRE | TSW | GY (tons) |
|
18 |
L 3 x L 8 |
0.307 |
0.88 |
-0.21 |
0.77 |
6.03 |
36.94 |
1.27 |
|
19 |
L 4 x L 5 |
1.057 |
-0.14 |
0.04 |
-0.37 |
2.93 |
16.69 |
0.64 |
|
20 |
L 4 x L 6 |
-3.326 |
0.76 |
-0.11 |
0.70 |
-1.25 |
57.49 |
0.97 |
|
21 |
L 4 x L 7 |
-5.093 |
0.36 |
-0.25 |
-0.53 |
0.36 |
46.00 |
-0.43 |
|
22 |
L 4 x L 8 |
-5.226 |
0.89 |
0.23 |
-0.27 |
-2.12 |
28.19 |
-0.13 |
|
23 |
L 5 x L 6 |
-1.876 |
0.58 |
-0.05 |
-0.87 |
-0.12 |
9.97 |
0.58 |
|
24 |
L 5 x L 7 |
-3.309 |
-0.40 |
0.04 |
-1.10 |
-4.00 |
37.82 |
-0.08 |
|
25 |
L 5 x L 8 |
-5.609 |
0.53 |
-0.14 |
1.17 |
1.51 |
-9.33 |
0.80 |
|
26 |
L 6 x L 7 |
0.041 |
1.08 |
0.08 |
-0.03 |
-0.187 |
56.62 |
1.09 |
|
27 |
L 6 x L 8 |
-0.159 |
0.81 |
-0.08 |
-0.10 |
3.16 |
29.14 |
0.03 |
|
28 |
L 7 x L 8 |
0.074 |
0.36 |
0.03 |
0.33 |
-1.55 |
-15.85 |
2.13 |
L1 = Line 1, L2 = Line 2, L3 = Line 3, L4 = Line 4, L5 = Line 5 , L6 = Line 6 , L7 = Line 7, L8 = line 8; DA = days to maturity; EL = ear length; ED = ear diameter; KRE = Kernel rows per ear; KR = Kernels per ear; TKWT = thousand kernel weight; GY = grain yield
Table 8: Selected F1 hybrids based Specific Combining Ability Effects for Yield, Yield component Traits and Standard Heterosis for Yield.
|
Specific combining ability effects for yield related traits |
||||||||
|
Ear length |
Ear |
Kernel rows |
Kernels |
Thousand kernel |
||||
| No. | Crosses |
(cm ) |
diameter (cm) |
per ear |
per row |
weight (g) |
||
|
(t/ha) |
STH |
|||||||
| 1 | L 1 x L 4 |
0.78 |
0.12 |
0.00 |
-0.60 |
55.17 |
10.15 |
29.30 |
| 2 | L 1 x L 5 |
0.25 |
0.24 |
0.17 |
3.16 |
46.65 |
10.07 |
28.30 |
| 3 | L7 x L8 |
0.36 |
0.03 |
0.33 |
-1.55 |
-15.85 |
10.04 |
27.90 |
| 4 | L 3 x L 8 |
0.88 |
-0.21 |
0.77 |
6.03 |
36.94 |
9.60 |
22.30 |
| 5 | L 3 x L 5 |
0.88 |
-0.21 |
0.77 |
6.03 |
36.94 |
9.55 |
21.70 |
| 6 | L 1 x L 7 |
0.25 |
0.24 |
0.17 |
3.16 |
46.65 |
9.48 |
20.80 |
| 7 | L 3 x L 6 |
0.09 |
0.08 |
0.40 |
1.06 |
-12.43 |
9.16 |
16.70 |
| 8 | L 3 x L 7 |
-0.31 |
0.25 |
0.17 |
2.01 |
49.09 |
9.01 |
14.08 |
| 9 | L 2 x L 5 |
0.63 |
0.22 |
-0.30 |
0.75 |
27.24 |
8.94 |
13.90 |
| 10 | L 2 x L 3 |
0.22 |
0.22 |
-1.03 |
-0.07 |
34.84 |
8.91 |
13.50 |
| 11 | L 6 x L 7 |
1.08 |
0.08 |
-0.03 |
-0.187 |
56.62 |
8.89 |
13.20 |
| 12 | L 5 x L 8 |
0.53 |
-0.14 |
1.17 |
1.51 |
-9.33 |
8.85 |
12.70 |
STH = Standard heterosis
References
- Alam, A.K.M.M., S. Ahmed, M. Begum and M.K. Sultan, 2008. Heterosis and combining ability for yield and its contributing characters in maize. Bangladesh J. Agric. Res. 33(3) 375-379.
CrossRef - Asif Ali, Hidayat ur Rahman, Liaqat Shah, Kashif Ali Shah, Shamsur Rehman, 2014. Heterosis for grain yield and its attributing components in maize variety Azam using line × tester analysis method, Academia Journal of Agricultural Research 2(11): 225-230, November 2014 DOI: http://dx.doi.org/10.15413/ajar.2014.0143.
- Aliu S., Fetahu Sh., Salillari A., 2008. Estimation of heterosis and combining ability in maize
- (Zea mays L. ) for ear weight using the diallel crossing method, Latvian Journal of Agronomy, No.11, LLU.
- Amanullah, S. Jehan, M. Mansoor and M. A. Khan., 2011. Heterosis studies in diallel crosses of maize. Sarhad J. Agric. 27(2): 207-211.
- M. Amiruzzaman, M.A. Islam, L. Hassan and M.M. Rohman, 2010. Combining Ability and Heterosis for Yield and Component Characters in Maize, Academic Journal of Plant Sciences 3 (2): 79-84.
- CSA (Central Statistical Agency), 2013. Agricultural sample survey. Report on farm management practices. Private peasant holdings, Meher season. Stat. Bull. Addis Ababa, Ethiopia. pp. 6-9.
- CSA (Central Statistical Agency), 2014. Agricultural sample survey. report on area and production of major crops. Private peasant holdings, Meher season). Stat. Bull. Addis Ababa, Ethiopia.
- Dagne Wegary Gissa , H. Zelleke , M. T. Labuschagne , T. Hussien & H. Singh, 2007. Heterosis and combining ability for grain yield and its components in selected maize inbred lines, South African Journal of Plant and Soil, 24:3, 133-137, DOI: 10.1080/02571862.2007.10634795. Dagne et al., 2009.
CrossRef - Griffing, B, 1956. Concept of general and specific combining ability in relation to diallel crossing system. Aus. J. Bio. Sci. 9: 463-493. 17
- Habtamu, Z. and Hadji, T., 2010. Combining ability analysis for yield and yield related traits in quality protein maize (Zea mays L.) inbred lines. International J. Biol. Sci. 2(7): 87-97.
- Hayes HK, Immer FR Smith DC, 1955. Methods of Plant Breeding. Mc. Grow Hill Book. Co., Inc., New York. P. 19.
- Melkamu Elmyhum, 2013. Estimation of combining ability and heterosis of quality protein maize inbred lines, African Journal of Agricultural Research, Vol. 8(48), pp. 6309-6317, DOI: 10.5897/AJAR2013.7119
- Rodrigo Oliboni, Marcos Ventura Faria, Mikael Neumann, Guilherme Mendes Battistelli, Rafael Gallo Tegoni and Juliano Tadeu Vilela de Resende, 2012). Genetic divergence among maize hybrids and correlations with heterosis and combining ability, Maringá, v. 34, n. 1, p. 37-44.
- Shushay Welderufael Abrha, 2014. Top Cross Analysis of Maize (Zea mays L) Inbred Lines for Some Agronomic Traits in Central Rift Valley of Ethiopia, Journal of Biology, Agriculture and Healthcare, Vol.4, No.25: 8-13.
- Rahman, H., Z. Arifuddin, S. Shah, A. Shah, M. Iqbal and I.H. Khalil, 2010. Evaluations of maize S2 lines in test cross combinations I: flowering and morphological traits. Pakistan J. Bot. 42(3): 1619-1627.