Introduction
Onion (Allium cepa L.) is one of the important vegetable crops commercially grown in India.India is the second largest producer of onion in the world, next only to China. The total area under onion in India is 1064000 ha and the total production is 15118000 MT. India accounts for 26.8 per cent the total area and 19.9 per cent the total production of the world. The average productivity of the world is 19.1 MT/ha while India being the second major onion producing country in the world has a productivity of 14.2 MT/ha (Source FAO Website: March 2012 and Indian Horticulture Database 2011). Maharashtra is the leading onion grower and producer state in the country which accounts 39 per cent of the total area and 32.5 per cent national production followed by Karnataka, Gujarat etc. The area under onion in Maharashtra is 415000 ha and the onion production is 4905000 MT. In India per hectare yield is highest in Gujarat (24.4 MT/ha) followed by Haryana (20.5 MT/ha), Bihar (20.3 MT/ha), Madhya Pradesh (17.5 MT/ha) whereas, in Maharashtra it is 11.8 MT/ha. (Source FAO Website: March 2012 and Indian Horticulture Database 2011).
Abiotic stresses can directly or indirectly affect the physiological status of an organism by altering its metabolism, growth and development and adversely affect the agricultural productivity (Bartles and Sunkar 2005, Vibhuti et al., 2015, Shahi et al., 2015a). Water is the main limiting factor for production of many crops including onion in the arid and semiarid regions. Fresh and dry mass production of crop may reduce due to the adverse effect of water stress (Shahi et al., 2015b). When water resources are scarce, deficit irrigation is one way of maximizing water use efficiency (Bekele and Tilahun 2007).Deficit irrigation is the practice of irrigating crops deliberately below their water requirements. Such practice is aimed at minimizing water applied to the crop so as to maximize crop yield per unit of water applied. This may however lower the yield per unit area. Many research works have been carried out to study the consequences of deficit irrigation on onion crop (Olalla et al., 1994; Gorantiwar and Smout.,2003; Pelter et al., 2004; Mermoud et al., 2005; Bekele and Tilahum, 2007; Ouda et al., 2010; and Pejić et al., 2011).
A research gap in the region where onion is produced in Maharashtra is the knowledge of water requirement of the onion crop under deficit irrigation. Moreover, the consequences of deficit irrigation regimes are yet to be fully understood. Two key parameters commonly required in determining crop water requirement and predictions of yield-water response to deficit irrigation are crop coefficient (Kc) and yield response factor (Ky). The yield response factor (Ky) is ratio of relative yield reduction to relative evapotranspiration deficit. It is the factor that integrates the weather, crop and soil conditions that make crop yield less than its potential yield in the case of deficit evapotranspiration. The yield response factor Ky is commonly required as input data in some empirical water production functions like (Jensen, 1968) and (Stewart et al., 1977) to predict crop yield response to water.
In order to determine the yield response factor of onion crop for Rahuri region (Maharashtra) the present study was carried out by raising the onion crop under different regimes of deficit irrigation approach. It is anticipated that the information generated in this study will be useful for developing crop water requirements for irrigated onion under deficit irrigation regimes and for the overall improvement of irrigation water management for onion in the study area.
Materials and Methods
The field experiment to determine the yield response factor of the onion (Allium cepa L.) cv. N-2-4-1 crop under the deficit irrigation approach was conducted during summer season of 2012 at Instructional Farm of the Department of Irrigation and Drainage Engineering, Dr. Annasaheb Shinde College of Agricultural Engineering, Mahatma Phule Krishi Vidyapeeth, Rahuri. Experiment was carried out in Randomized Block Design (RBD) with 27 treatments and two replications based on different combinations of the quantity of water stress days (no stress- (0.00S), 20% stress- (0.20S) and 40% stress- (0.40S) during different crop growth stages vegetative Stage (VS) – up to 50 days , bulb development stage (BDS) – 50 to 75 days and bulb enlargement stage (BES) – 75 to 100.The different combinations of the treatments are :
T1 VS-0.00S,BDS-0.00S,BES-0.00S , T2. VS-0.00S,BDS-0.00S,BES-0.20S
T3. VS-0.00S,BDS-0.00S,BES-0.40S , T4 . VS-0.00S,BDS-0.20S,BES-0.00S
T5. VS-0.00S,BDS-0.20S,BES-0.20S , T6 VS-0.00S,BDS-0.20S,BES-0.40S
T7 . VS-0.00S,BDS-0.40S,BES-0.00S , T8 . VS-0.00S,BDS-0.40S,BES-0.20S
T9 . VS-0.00S,BDS-0.40S,BES-0.40S , T10 . VS-0.20S,BDS-0.00S,BES-0.00S
T11 . VS-0.20S,BDS-0.00S,BES-0.20S , T12 . VS-0.20S,BDS-0.00S,BES-0.40S
T13 . VS-0.20S,BDS-0.20S,BES-0.00S , T14 . VS-0.20S,BDS-0.20S,BES-0.20S
T15 . VS-0.20S,BDS-0.20S,BES-0.40S, T16 . VS-0.20S,BDS-0.40S,BES-0.00S
T17 . VS-0.20S,BDS-0.40S,BES-0.20S, T18 . VS-0.20S,BDS-0.40S,BES-0.40S
T19 . VS-0.40S,BDS-0.00S,BES-0.00S, T20 VS-0.40S,BDS-0.00S,BES-0.20S
T21 . VS-0.40S,BDS-0.00S,BES-0.40S, T22 . VS-0.40S,BDS-0.20S,BES-0.00S
T23 .VS-0.40S,BDS-0.20S,BES-0.20S, T24 . VS-0.40S,BDS-0.20S,BES-0.40S
T25 . VS-0.40S,BDS-0.40S,BES-0.00S, T26 . VS-0.40S,BDS-0.40S,BES-0.20S
T27. VS-0.40S,BDS-0.40S,BES-0.40S
The 27 treatments were replicated two times, making a total of 54 plots and two additional plots were worked for onion root study. The gross size of experimental site was 46m x 40m and net plot size was 4m x 4m. The blocks were separated by a distance of 2 m., while the basins in each block were separated by a distance of 1.5 m which serves as buffer to minimize lateral movement of water from one basin to another. The irrigations were scheduled at every growth stage of onion crop. The quantities of water were applied according to the treatments. There was no rainfall during period of experimentation. The depth of water to be applied during each irrigation was calculated according to the following formula.
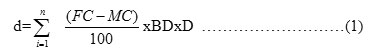
Where,
FC = field capacity, %
MC = moisture content at the time of irrigation, %
BD = bulk density of soil, g/cc
D = effective root zone depth, cm
Irrigations were scheduled at every growth stage of onion crop as per stress underlined in each treatment. The stress was estimated from the moisture content stress in the rootzone. The depths of irrigation water were applied according to the treatments.
The yield response factor was computed using the Doorenbos and Kassam (1979) equation re-arranged as,
![]()
Where
Ya = actual yield (t/ha),
Ym = maximum yield (t/ha),
Eta = actual evapotranspiration (mm)
ETm = maximum evapotranspiration (mm).
Ky = yield response factor of onion to deficit irrigation.
The values of yield response factor, Ky, was estimated by the regression analysis.
Results and Discussion
Crop water use
Number of irrigations and gross depth of irrigation water applied to each treatment are given in Table1.
Table 1
|
Sr.No |
Irrigation Treatment |
Number of irrigations |
Total depth of irrigation water applied (mm) |
|
|
2012 |
20013 |
|||
|
1 |
T1 |
13 |
529 |
556 |
|
2 |
T2 |
13 |
504 |
515 |
|
3 |
T3 |
13 |
469 |
489 |
|
4 |
T4 |
13 |
512 |
505 |
|
5 |
T5 |
13 |
485 |
485 |
|
6 |
T6 |
13 |
481 |
476 |
|
7 |
T7 |
13 |
468 |
491 |
|
8 |
T8 |
13 |
478 |
472 |
|
9 |
T9 |
13 |
445 |
442 |
|
10 |
T10 |
13 |
484 |
499 |
|
11 |
T11 |
13 |
454 |
467 |
|
12 |
T12 |
13 |
446 |
446 |
|
13 |
T13 |
13 |
445 |
468 |
|
14 |
T14 |
13 |
460 |
478 |
|
15 |
T15 |
13 |
440 |
436 |
|
16 |
T16 |
13 |
431 |
447 |
|
17 |
T17 |
13 |
405 |
417 |
|
18 |
T18 |
13 |
404 |
418 |
|
19 |
T19 |
13 |
456 |
443 |
|
20 |
T20 |
13 |
455 |
442 |
|
21 |
T21 |
13 |
400 |
407 |
|
22 |
T22 |
13 |
427 |
436 |
|
23 |
T23 |
13 |
398 |
405 |
|
24 |
T24 |
13 |
378 |
384 |
|
25 |
T25 |
13 |
405 |
412 |
|
26 |
T26 |
13 |
373 |
379 |
|
27 |
T27 |
13 |
358 |
363 |
Onion yield as influenced by water stress
The mean pooled onion yield for two two season for all the treatments are given in Table 2. The yield data were analyzed statistically for randomized block design. The yields were statistically significant. The mean yields along with CD at 5 % are presented in Table2.
Table 4.6: Mean onin yield for different treatments during 2012 and 2013.
Table 2
|
Sr. No. |
Treatment |
2012 |
2013 |
||||
|
Mean yield (kg/ha) |
Decrease in yield (%) |
Mean yield (%) |
Mean yield (kg/ha |
Decrease in yield (%) |
Mean yield (%) |
||
|
1 |
T1 |
42.52 |
– |
100.00 |
43.26 |
– |
100.00 |
|
2 |
T2 |
38.55 |
9.32 |
90.67 |
37.66 |
12.93 |
87.06 |
|
3 |
T3 |
37.22 |
12.46 |
87.53 |
35.61 |
17.68 |
82.31 |
|
4 |
T4 |
42.36 |
0.36 |
99.63 |
40.91 |
5.42 |
94.57 |
|
5 |
T5 |
35.85 |
15.67 |
84.32 |
32.73 |
24.35 |
75.65 |
|
6 |
T6 |
30.69 |
27.79 |
72.20 |
27.56 |
36.28 |
63.71 |
|
7 |
T7 |
30.41 |
28.48 |
71.51 |
29.96 |
30.75 |
69.25 |
|
8 |
T8 |
28.91 |
32.00 |
67.99 |
28.78 |
33.47 |
66.52 |
|
9 |
T9 |
26.90 |
36.73 |
63.26 |
24.14 |
44.19 |
55.80 |
|
10 |
T10 |
38.49 |
9.43 |
90.52 |
31.28 |
27.69 |
72.30 |
|
11 |
T11 |
36.32 |
14.55 |
85.44 |
32.48 |
24.91 |
75.08 |
|
12 |
T12 |
32.05 |
24.62 |
75.37 |
29.81 |
31.09 |
68.90 |
|
13 |
T13 |
29.05 |
31.67 |
68.32 |
30.50 |
29.48 |
70.51 |
|
14 |
T14 |
25.92 |
39.02 |
60.97 |
26.07 |
39.73 |
60.27 |
|
15 |
T15 |
28.32 |
33.37 |
66.62 |
25.39 |
41.30 |
58.69 |
|
16 |
T16 |
30.57 |
28.09 |
71.90 |
26.98 |
37.63 |
62.36 |
|
17 |
T17 |
26.83 |
36.88 |
63.11 |
29.893 |
30.90 |
69.09 |
|
18 |
T18 |
27.12 |
36.22 |
63.77 |
29.06 |
32.82 |
67.17 |
|
19 |
T19 |
31.74 |
25.34 |
74.65 |
28.12 |
34.99 |
65.00 |
|
20 |
T20 |
34.64 |
18.51 |
81.48 |
32.12 |
25.74 |
74.25 |
|
21 |
T21 |
32.71 |
23.06 |
76.93 |
28.75 |
33.53 |
66.46 |
|
22 |
T22 |
28.81 |
32.24 |
67.75 |
27.76 |
35.81 |
64.18 |
|
23 |
T23 |
26.66 |
37.28 |
62.71 |
25.97 |
39.96 |
60.03 |
|
24 |
T24 |
24.47 |
42.44 |
57.55 |
21.75 |
49.71 |
50.28 |
|
25 |
T25 |
22.9 |
46.14 |
53.85 |
24.86 |
42.52 |
57.47 |
|
26 |
T26 |
22.27 |
47.61 |
52.38 |
22.44 |
48.12 |
51.87 |
|
27 |
T27 |
21.35 |
49.78 |
50.21 |
19.78 |
54.27 |
45.72 |
|
CD at 5% |
4.298 |
2.440 |
|||||
It is observed from above table that the higher yields are observed in trématent T1 (0% stress at vegetative stage,bulb development stage and bulb enlargement stage) followed by T4, T3, T10, T11, T5, T20, T21, T12, T19, T6, T16, T7, T13, T8, T22, T15, T18, T9, T17, T18, T23, T14, T24, T25, T26 and T27. The onion yields are lowest for T27 (40% stress at vegetative stage, bulb development stage and bulb enlargement stage). However, the yields of treatments T1 and T4, T2, T3 and T10 are at par. The yields of treatments T5, T11, and T20 are at par. The yields of treatments T6, T7 and T16 are at par. The yields of treatments T8, T13, T15 and T22 are at par. The yields of treatments T15, T8, T14, and T22 are at par. The yields of treatmentsT9, T17, T23 and T24 are at par. Statistically shows that the vegetative stage of the onion crop with no water stress gives higher onion yield at C.D.5%.Thus, the onion yields are higher with less water stress and reduce with increase in water stress.
Yield response factor (Ky)
Table 3, 4 and 5 shows the relative decreases in seasonal crop water use and bulb yield for 2012, 2013 season and average of two seasons. Yield response factor (Ky) indicates a linear relationship between the decrease in relative water consumption and the decrease in relative yield. It shows the response of yield with respect to the decrease in water consumption. In other words, it explains the decrease in yield caused by the per unit decrease in water consumption. Hence the regression analysis was used to find the value of Ky.
Table 3: Relationship between the decrease in relative water use and decrease in relative yield for onion during 2012 season.
|
Treatment |
ETa |
ETm |
Ya |
Ym |
1-ETa/ETm |
1-Ya/Ym |
|
T1 |
529 |
529 |
42.518 |
42.518 |
0 |
0 |
|
T2 |
504 |
529 |
38.554 |
42.518 |
0.047 |
0.093 |
|
T3 |
469 |
529 |
37.218 |
42.518 |
0.113 |
0.124 |
|
T4 |
512 |
529 |
42.364 |
42.518 |
0.032 |
0.003 |
|
T5 |
485 |
529 |
35.855 |
42.518 |
0.083 |
0.156 |
|
T6 |
481 |
529 |
35.48 |
42.518 |
0.090 |
0.165 |
|
T7 |
468 |
529 |
32.942 |
42.518 |
0.115 |
0.225 |
|
T8 |
478 |
529 |
35.087 |
42.518 |
0.096 |
0.174 |
|
T9 |
445 |
529 |
26.901 |
42.518 |
0.158 |
0.367 |
|
T10 |
484 |
529 |
38.49 |
42.518 |
0.085 |
0.094 |
|
T11 |
454 |
529 |
36.328 |
42.518 |
0.141 |
0.145 |
|
T12 |
446 |
529 |
32.049 |
42.518 |
0.156 |
0.246 |
|
T13 |
445 |
529 |
29.049 |
42.518 |
0.158 |
0.316 |
|
T14 |
460 |
529 |
33.181 |
42.518 |
0.130 |
0.219 |
|
T15 |
440 |
529 |
28.327 |
42.518 |
0.168 |
0.333 |
|
T16 |
431 |
529 |
30.574 |
42.518 |
0.185 |
0.280 |
|
T17 |
405 |
529 |
26.833 |
42.518 |
0.234 |
0.368 |
|
T18 |
404 |
529 |
27.115 |
42.518 |
0.236 |
0.362 |
|
T19 |
456 |
529 |
31.742 |
42.518 |
0.137 |
0.253 |
|
T20 |
455 |
529 |
34.645 |
42.518 |
0.139 |
0.185 |
|
T21 |
400 |
529 |
32.71 |
42.518 |
0.243 |
0.230 |
|
T22 |
427 |
529 |
28.807 |
42.518 |
0.192 |
0.322 |
|
T23 |
398 |
529 |
26.664 |
42.518 |
0.247 |
0.372 |
|
T24 |
378 |
529 |
24.471 |
42.518 |
0.285 |
0.424 |
|
T25 |
405 |
529 |
22.899 |
42.518 |
0.234 |
0.461 |
|
T26 |
373 |
529 |
22.273 |
42.518 |
0.294 |
0.476 |
|
T27 |
358 |
529 |
21.349 |
42.518 |
0.324 |
0.497 |
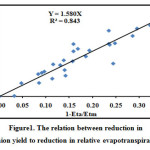 |
Figure 1: The relation between reduction in relative onion yield to reduction in relative evapotranspiration (2012) |
Table 4: Relationship between the decrease in relative water use and decrease in relative yield for onion during 2013 season.
|
Treatment |
ETa |
ETm |
Ya |
Ym |
1-ETa/ETm |
1-Ya/Ym |
|
T1 |
556 |
556 |
43 |
43 |
0 |
0 |
|
T2 |
515 |
556 |
40 |
43 |
0.073 |
0.070 |
|
T3 |
489 |
556 |
36 |
43 |
0.120 |
0.172 |
|
T4 |
505 |
556 |
41 |
43 |
0.091 |
0.048 |
|
T5 |
485 |
556 |
34 |
43 |
0.127 |
0.202 |
|
T6 |
476 |
556 |
33 |
43 |
0.145 |
0.222 |
|
T7 |
491 |
556 |
35 |
43 |
0.117 |
0.177 |
|
T8 |
472 |
556 |
33 |
43 |
0.151 |
0.243 |
|
T9 |
442 |
556 |
29 |
43 |
0.205 |
0.315 |
|
T10 |
499 |
556 |
38 |
43 |
0.103 |
0.126 |
|
T11 |
467 |
556 |
32 |
43 |
0.161 |
0.245 |
|
T12 |
446 |
556 |
30 |
43 |
0.198 |
0.307 |
|
T13 |
467 |
556 |
31 |
43 |
0.159 |
0.290 |
|
T14 |
478 |
556 |
33 |
43 |
0.141 |
0.224 |
|
T15 |
436 |
556 |
30 |
43 |
0.216 |
0.310 |
|
T16 |
447 |
556 |
29 |
43 |
0.197 |
0.334 |
|
T17 |
417 |
556 |
30 |
43 |
0.251 |
0.305 |
|
T18 |
418 |
556 |
29 |
43 |
0.249 |
0.324 |
|
T19 |
443 |
556 |
28 |
43 |
0.204 |
0.346 |
|
T20 |
442 |
556 |
32 |
43 |
0.206 |
0.253 |
|
T21 |
407 |
556 |
29 |
43 |
0.268 |
0.331 |
|
T22 |
436 |
556 |
28 |
43 |
0.215 |
0.354 |
|
T23 |
405 |
556 |
26 |
43 |
0.272 |
0.396 |
|
T24 |
384 |
556 |
22 |
43 |
0.309 |
0.494 |
|
T25 |
412 |
556 |
25 |
43 |
0.259 |
0.422 |
|
T26 |
379 |
556 |
22 |
43 |
0.319 |
0.478 |
|
T27 |
363 |
556 |
20 |
43 |
0.347 |
0.540 |
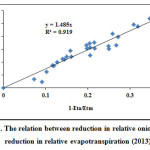 |
Figure 2: The relation between reduction in relative onion yield to reduction in relative evapotranspiration (2013) |
Table 5: Average relationship between the decrease in relative water use and decrease in relative yield for onion during 2012 and 2013 season.
|
Treatment |
ETa |
ETm |
Ya |
Ym |
1-ETa/ETm |
1-Ya/Ym |
|
T1 |
543 |
543 |
43 |
43 |
0.001 |
0.006 |
|
T2 |
510 |
543 |
39 |
43 |
0.062 |
0.087 |
|
T3 |
479 |
543 |
37 |
43 |
0.118 |
0.149 |
|
T4 |
509 |
543 |
42 |
43 |
0.064 |
0.031 |
|
T5 |
485 |
543 |
35 |
43 |
0.107 |
0.188 |
|
T6 |
479 |
543 |
34 |
43 |
0.119 |
0.204 |
|
T7 |
480 |
543 |
34 |
43 |
0.117 |
0.210 |
|
T8 |
475 |
543 |
34 |
43 |
0.125 |
0.208 |
|
T9 |
444 |
543 |
28 |
43 |
0.183 |
0.350 |
|
T10 |
492 |
543 |
38 |
43 |
0.095 |
0.111 |
|
T11 |
461 |
543 |
34 |
43 |
0.152 |
0.205 |
|
T12 |
446 |
543 |
31 |
43 |
0.179 |
0.279 |
|
T13 |
456 |
543 |
30 |
43 |
0.160 |
0.302 |
|
T14 |
469 |
543 |
33 |
43 |
0.136 |
0.230 |
|
T15 |
438 |
543 |
29 |
43 |
0.193 |
0.322 |
|
T16 |
439 |
543 |
30 |
43 |
0.192 |
0.307 |
|
T17 |
411 |
543 |
28 |
43 |
0.243 |
0.339 |
|
T18 |
411 |
543 |
28 |
43 |
0.243 |
0.348 |
|
T19 |
450 |
543 |
30 |
43 |
0.172 |
0.305 |
|
T20 |
449 |
543 |
33 |
43 |
0.174 |
0.225 |
|
T21 |
404 |
543 |
31 |
43 |
0.257 |
0.282 |
|
T22 |
432 |
543 |
28 |
43 |
0.205 |
0.339 |
|
T23 |
402 |
543 |
26 |
43 |
0.261 |
0.388 |
|
T24 |
381 |
543 |
23 |
43 |
0.298 |
0.460 |
|
T25 |
409 |
543 |
24 |
43 |
0.248 |
0.443 |
|
T26 |
376 |
543 |
22 |
43 |
0.308 |
0.485 |
|
T27 |
361 |
543 |
21 |
43 |
0.336 |
0.519 |
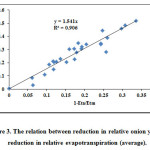 |
Figure 3: The relation between reduction in relative onion yield to reduction in relative evapotranspiration (average). |
Crop yield response factor (Ky) indicates a linear relationship between the decrease in relative water consumption and the decrease in relative yield. It shows the response of yield with respect to the decrease in water consumption. In other words, it explains the decrease in yield caused by the per unit decrease in water consumption.
The moisture content observations during 2012 and 2013 were recorded before irrigation, after irrigation and during irrigation period for all the treatments for the purpose of computing the actual evapotranspiration. The treatment T1 was treatment without water stress and hence actual evapotranspiration of treatment T1 was considered as maximum crop evapotranspiration. The maximum crop evapotranspiration during 2012 and 2013 and average of 2012 and 2013 were computed. These are 529, 556 and 543 mm for 2012, 2013 and average of 2012 and 2013 respectively. The treatments T2 to T27 were treatments with some stress. The values of actual evapotranspiration along with maximum onion evapotranspiration are presented in Tables 3,4 and 5. These tables show the relative decreases in seasonal crop water use and bulb yield for onion crop during 2012 and 2013 seasons and average of two seasons.
The relationship between relative yield reduction and relative evapotranspiration deficit for onion yield is shown in Figures 1, 2 and 3. The yield response factor (Ky) for onion in 2012, 2013 and average of 2012 & 2013 by regression analysis was found to be 1.58, 1.48 and 1.54 for whole growing season. Result obtained was in agreement with those reported by Doorenbos and Kassam (1986). They reported that seasonal yield response factor (Ky) value of 1.50 for onion during the whole growing season. Generally, higher Ky values indicate that the crop will have a greater yield loss when the crop water requirements are not met. This result indicated a high impact of soil-water stress treatment on the onion yield. Therefore, water management of onion is extremely important at all stages of plant growth.
Conclusion
- The results indicated a high impact of soil-water stress treatments on the onions yield.
- The crop water use of the onion crop decreased with increase in irrigation deficit.
- The yield response factor (Ky) for onion in semi arid tropics of Maharashtra was found to be 1.54 for whole growing season.
References
- Allen RG, Pereira LS, Raes D, Smith M (1998). Crop Evapotranspiration: Guideline for Computing Crop Water Requirements. FAO Irrig. Drain. Paper 56:300.
- Amayreh J, Al-Abed N (2005). Developing crop coefficients for field-grown tomato (Lycopersicom esculentum M.) under drip irrigation with black plastic mulch. Agric. Water Manage. 73:247-254.
CrossRef - Anemones (2013), A report of the research review committee meeting ,MPKV, Rahuri during April 22-23,2013
- Bartels D and Sunkar R. 2005. Drought and salt tolerance in plants. Critical Reviews in Plant Science 24:23–58.
CrossRef - Bekele S, Tilahum K (2007). Regulated deficit irrigation scheduling of onion in a semi arid region of Ethiopia. Agric. Water Manag. 89:148-152.
CrossRef - Bossie M, Tilahum K, Hordofa T (2009). Crop coefficient and evapotranspiration of onion at Awash Melkasa, Central Rift Valley of Ethiopia. Irrig. Drain. Syst. 23:1-10.
CrossRef - Doorenbos J, Kassam AH, (1979). Yield Response to Water. FAO Irrigation and Drainage Paper No. 33, FAO, Rome, Italy. p. 193.
- Doorenbos J, Pruitt WO (1977). Guideline for prediction of crop water requirement. Irrigation and Drainage Paper No.24. FAO, Rome. Italy. Page 144.
- Gorantiwar,S.and Smout,I.(2003).Allocation of scarce water resources using deficit irrigation in rotational systems.J.Irrig.Drain Eng.,129(3),155-163.
CrossRef - Gorantiwar,S.and Smout,I.(2005).Performance assessment of irrigation water management of heterogeneous irrigation schemes:2.Case study. Irrigation and Drainage systems, March 2005,Volume 19,Issue 1,pp37-60.
- Igbadun HE, Ramalan AA, Oiganji E (2012). Effects of regulated irrigation deficit and mulch on yield, water use and crop water productivity of onion in Samaru, Nigeria. Agric. Water Manage. 109:162-169.
CrossRef - Jensen ME (1968). Water consumption by agricultural plants. In: Kozlowski TT (ed.), Water Deficits in Plant Growth, vol. 1. Academic Press, New York, pp. 1–22.
- Martinez-Cob A (2007). Use of thermal units to estimate corn crop coefficients under semiarid climatic conditions, Irrig. Sci. 26(4):335-345.
CrossRef - Mermoud A, Tamini TD, Yacouba H (2005). Impacts of different irrigation schedules on the water balance components of an onion crop in a semi-arid zone. Agric. Water Manage. 77:282-295.
CrossRef - Olalla FM, Velero JA, Corles CF (1994). Growth and production on onion crop (Allium cepa. L) under different irrigation scheduling. European J. Agron. 3:85-92.
CrossRef - Ouda SA, Elenin RA, Shreif MA (2010). Using yield-stress model to predict the impact of deficit irrigation on onion yield. Fourteen International Water Technology Conference. IWTC 14 2010, Cairo, Egypt. pp. 383-393.
- Pejić B, Gvozdanović-Varga J, Milić S, Ignjatović-Ćupina A, Krstić D, Ćupina B (2011). Effect of irrigation schedules on yield and water use of onion (Allium cepa L.). Afr. J. Biotech. 10(14):2644-2652.
CrossRef - Shahi Charu, Vibhuti, Kiran Bargali and S.S. Bargali 2015a. How Seed Size and Water Stress Effect the Seed Germination and Seedling Growth in Wheat Varieties? Current Agriculture Research Journal 3(1):60-68.
- Shahi Charu, Vibhuti, Kiran Bargali and S.S. Bargali 2015b. Influence of seed size and salt stress on seed germination and seedling growth of wheat (Triticum aestivum L.). Indian Journal of Agricultural Sciences 85(9): 1134-1137
CrossRef - Vibhuti, Shahi C, Bargali K and Bargali S S. 2015. Seed germination and seedling growth parameters of rice (Oryza sativa L.) varieties as affected by salt and water stress. Indian Journal of Agricultural Sciences 85(1): 102–108.