Introduction
Wheat (Triticum aestivum L.) is the third most-produced cereal after maize and rice and staple food of millions of people in the world.1 Fertilizer nitrogen (N) is the most essential plant nutrient required comparatively a larger amount than other elements in wheat. However, judicious use of this nutrient requires its synchronized application with crop requirement.2 In absence of synchronization, plants grow vigorously that reduces N fertilizer use efficiency.3,4 The optimized N fertilization can synchronize N demand of wheat and thus N application rates drastically reduce without any yield losses.5 Rahman et al.,6 suggested to establish an appropriate N management practice to improve N use efficiency in wheat owing to save our soil from being using over or under doses of fertilizer. The SPAD chlorophyll meter potentially offers a useful nondestructive and handheld system of evaluating plant chlorophyll status.7 It is evident that much of leaf N is involved in enzymes associated with chlorophyll and the evaluation of chlorophyll content using SPAD meter could provide an indirect assessment of leaf N content.8
In recent years, it showed that the split top-dressing of N fertilization and indirect assessment of N through SPAD chlorophyll meter may improve N use efficiency and enhance productivity of wheat.9-11 Time and rate of N fertilizer top-dressing has a significant role in higher productivity of the crop. The usual practice of applying higher quantity of N fertilizer as basal dose reduces the availability of nitrogen at peak growth of the crop resulting in low yield. For fine tuning of N management in the farmer’s field having high variability in fertility condition under subtropical environment and to reduce the risk of under and over N fertilization, SPAD meter-based real time N application could be effective and popular to the farmers. Lopez-Bellido et al.,12 observed the potential of using SPAD meter in predicting fertilizer N requirements in wheat. However, its potentiality in determining the precision level of N requirement in wheat field is not widely tried in the subtropical regions. Considering these, the study was undertaken to compare different conventional and SPAD meter-based dynamic methods of N fertilization and to precise the conventional methods for maximizing wheat yield.
Materials and Methods
The experiment was conducted at the Field Research Site of the Bangabandhu Sheikh Mujibur Rahman Agricultural University (BSMRAU), Gazipur-1706 from December, 2012 to March, 2013. This region is characterized by a subtropical climate having hot summer (May-August) and mild winter (December-February). It belongs to Agro Ecological Zone 28 at geographic coordinates 240 05¢ N latitude and 90016¢ E longitude with an elevation of 8.4 m above the mean sea level. The crop tested in the experiment was widely cultivated wheat variety BARI Gom-27 in Bangladesh. The experiment was laid out in a Randomized Complete Block Design with four replications. The unit plot size was 3×2 m. There were eight treatments of which four were conventional nitrogen (CN) management viz. (1) CN60 = 60 kg ha-1 N (2) CN90 = 90 kg ha-1 N (3) CN120 = 120 kg ha-1 N and (4) CN150 = 150 kg ha-1 N and four were dynamic nitrogen (DN) management: viz. (1) DN80 = 20 kg ha-1 N in each time started from 18 days after sowing (DAS) and for four times total amount was 80 kg ha-1 N, (2) DN90 = 30 kg N ha-1 in each time started from 19 DAS and for three times total amount was 90 kg ha-1 N, (3) DN120 = 40 kg N ha-1 in each time started from 20 DAS and for three times total amount was 120 kg ha-1 N and (4) DN100 = 50 kg N ha-1 in each time started from 24 DAS and for two times total amount was 100 kg ha-1 N. In CN treatments, one third of nitrogen was applied as basal application and the rest of the nitrogen was applied at 25 and 50 days after sowing (DAS) as top dress. In DN, supplied N application was done when the SPAD value fell down the critical value of 45 as suggested by Barraclough and Kyte.13
Seeds were placed continuously in lines by making narrow and shallow furrows with iron tine and covered properly. The crop was terminally harvested around four months after sowing. The data refer to growth and physiological parameters as well as yield and yield attributes. Among the physiological parameters, SPAD value over time and corresponding leaf chlorophyll content, dry matter production, leaf area index, crop growth rate and net assimilation rate were recorded. The yield data viz. 1000-seed weight, the number of tillers per m2, spike length, the number of spikelet per spike and the number of grains per spike and the grain yield were recorded when the plant attained full maturity. Twelve wheat plants were selected randomly from each plot at 17 DAS excluding border area and SPAD value was taken from middle portion of the latest fully developed leaf by using Minolta chlorophyll meter (Model: SPAD-502, Minolta Co. Ltd., Japan). Thus SPAD values were taken from each plot at 3 days interval up to 84 DAS. Collected data were subjected to statistical analysis. Arithmetic mean values of the different plots, those experiencing conventional and dynamic nitrogen supplements were compared to evaluate the difference in the plant performance by employing Least significance difference (LSD). MSTAT-C and SPSS program were used to perform statistical analysis.
Results and Discussion
SPAD Chlorophyll Meter Reading
SPAD reading was markedly influenced by N treatments (Figure 1). In DN treatments, nitrogen fertilizer applied when SPAD value falls below 45. SPAD meter reading was found to increase one-week after application of N fertilizer. Before 42 DAS, fluctuating of SPAD meter reading occurred irrespective of treatments, but DN treatments maintained comparatively higher SPAD values over CN treatments having same rate of N fertilizer. After 45 DAS, SPAD reading increased up to anthesis stage with the progress of plant age, thereafter it declined regardless of treatments. The maximum SPAD reading was observed in CN150 followed by CN120 and DN120 treatment. The treatments CN150 and DN100 showed the highest SPAD values up to 51 DAS. Thereafter, SPAD readings in DN100 gradually fell down but remained above 45. In rice, different doses of nitrogen fertilizer showed significant effect on SPAD meter reading at different growth stages[14]. Wheat responded most to nitrogen fertilizer at maximum tillering stage when SPAD reading fell below 44.15 However, SPAD value more than 45 was reported excess consumption of nitrogen uptake in spring wheat.16
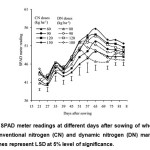 |
Figure 1: SPAD meter readings at different days after sowing of wheat grown under conventional nitrogen (CN) and dynamic nitrogen (DN) management. Vertical lines represent LSD at 5% level of significance. Click here to View figure |
Total Dry Matter Production
Total dry matter (TDM) production progressively increased over times and varied depending on the doses of N fertilizer and management systems (Table 1). The increasing rate of TDM production was high during 70 to 90 DAS and thereafter, it slowed down and continued till maturity. It might be due to decrease in photosynthetic capacity of the plants, and shedding and discoloration of leaves by damaging chlorophyll. Plants grown under CN150 treatment produced the highest TDM, which was significantly higher than those grown under other treatments. Chandurkar et al.,17 and Bellido et al.,18 also reported that TDM increased up to 150 kg N ha-1 in wheat. Except CN150 treatment, DN treated plants produced comparatively higher TDM at same rate of N application indicating better nitrogen uptake in DN management. However, at low N rate both CN and CN management had no additional benefit.
Table 1: Total dry matter production at different days after sowing of wheat grown under conventional nitrogen (CN) and dynamic nitrogen (DN) management.
|
Treatments |
Total dry matter (g m-2) |
||||
|
Days after sowing |
|||||
|
71 |
81 |
91 |
101 |
111 |
|
| CN application (kg ha-1) | |||||
| 60 |
1041 |
1180 |
1371 |
1465 |
1496 |
| 90 |
1138 |
1309 |
1546 |
1665 |
1703 |
| 120 |
1253 |
1444 |
1721 |
1854 |
1902 |
| 150 |
1398 |
1607 |
1933 |
2091 |
2152 |
| DN application (kg ha-1) | |||||
| 80 |
1077 |
1226 |
1444 |
1545 |
1580 |
| 90 |
1182 |
1365 |
1613 |
1737 |
1779 |
| 120 |
1308 |
1507 |
1804 |
1945 |
1997 |
| 100 |
1203 |
1359 |
1585 |
1697 |
1724 |
| LSD (5%) |
51.01 |
60.01 |
88.6 |
102 |
101.4 |
| CV % |
2.89 |
2.97 |
3.7 |
3.97 |
3.85 |
CN = Conventional nitrogen, DN = Dynamic nitrogen, LSD = Least significance difference at 5% level of significance, CV = Coefficient of variation.
Leaf area index
Leaf area index (LAI) gradually decreased from 71 DAS to 91 DAS irrespective of nitrogen treatments (Figure 2). The treatment CN150 showed the highest LAI which is statistically identical with that of the treatment DN120 at different DAS. Kibe et al.,19 also reported that an exponential increase in nitrogen fertilizer increased LAI. The most remarkable responses of plants were the maintenance of higher LAI in DN treatments compared to CN treatments for 90 or 120 Kg ha-1 N application. This implies that SPAD meter-based real time fertilizer increased LAI most likely to higher N efficiency in DN fertilization.
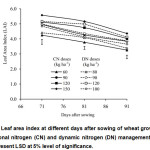 |
Figure 2: Leaf area index at different days after sowing of wheat grown under conventional nitrogen (CN) and dynamic nitrogen (DN) management. Vertical lines represent LSD at 5% level of significance. |
Crop Growth Rate
Crop growth rate (CGR) varied significantly for different fertilizer N treatments (Figure 3). Among the treatments, CN150 maintained the highest CGR throughout and statistically similar with the treatments CN120, DN120 and DN90 at 81, 91 and 101 days after sowing. At 111 DAS, CN150 exhibited the highest value, but dissimilar to other treatments. The results obtained by Rahman20 are also in agreement with this, where CGR was high for using 120 and 160 kg N ha-1. Kibe et al.,19 explained the fact that CGR increased with the increasing rate of N fertilizer in wheat because of accelerating the activities of meristems and increasing the function of protoplasm. Inadequate N in CN60, DN80, CN90 and DN100 treatments is probably a stressful condition responsible for disturbing the physiological function of plant resulting to inadequate leaf formation and development, and consequently may have less photosynthesis, Inadequate growth and development during the stressful conditions have also been reported by Vibhuti et al.,21 and Shahi et al.,22,23 in wheat and rice crops, respectively. This may results in reduced dry matter production and ultimately CGR was not satisfactory. Comparing the treatment CN120 with DN120, the CGR was apparently higher in DN120 than CN120. This indicates that dynamic N application increased nutrient use efficiency (NUE) in wheat.
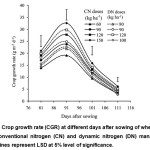 |
Figure 3: Crop growth rate (CGR) at different days after sowing of wheat grown under conventional nitrogen (CN) and dynamic nitrogen (DN) management. Vertical lines represent LSD at 5% level of significance. Click here to View figure |
Net Assimilation Rate
Net assimilation rate (NAR) varied significantly with varying degrees of N fertilization (Figure 4). Regardless of treatments, NAR increased linearly from early growth stage and reached maximum at 81 DAS and then gradually declined. It reveals that NAR was high for high N rate which is most common in various studies.24,25 However, treatment CN150 showed the highest NAR than other treatments presumably because of producing more leaf area that may responded to harvest more light and accumulate more dry matter. Comparing with CN treatments, DN treatments having same rate of N fertilizer showed higher NAR. This results suggests that plant need-based fertilizer application increased NUE by enhancing leaf photosynthesis. Generally, increased NAR is attributed to enhanced photosynthetic capacity of leaves with improved nutrition of the plants.26
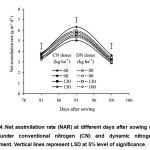 |
Figure 4: Net assimilation rate (NAR) at different days after sowing of wheat grown under conventional nitrogen (CN) and dynamic nitrogen (DN) management. Vertical lines represent LSD at 5% level of significance. |
Yield Attributes and Grain Yield
The grain yield of wheat is increased significantly as a result of the positive contribution of all yield contributing characters i.e. grains per spike, spike length, spikelets per spike and grain weight (Table 2). In general, the grain yield increased with increasing N rates. Nitrogen receiving from the treatment CN150 resulted in the highest grain yield (5.10 t ha-1) that was statistically similar with those produced in treatments DN120, CN120, DN100 and DN90,and significantly higher than those of all other conventional and dynamic treatments. The results of the highest yield are in agreement with many studies27,28,29 who reported that N application @ 150 kg ha-1 produced the highest wheat yield. The lowest yield (4.25 t ha-1) was found from the CN60 treatment. Although CN90 and DN90 contained the same amount of nitrogen, the grain yield of DN90 was much higher than CN90. In case of other treatments i.e. CN90, DN80 and CN60, the late top-dressing with inadequate N fertilizer at vegetative stage inhibited plant growth and development.
Table 2: Grains per spike, spike length and spikelets per spike, grain weight and grain yield of wheat grown under conventional nitrogen (CN) and dynamic nitrogen (DN) management.
| Treatments | Grain no./spike | Spike length (cm) | Spikelet no./ spike | 1000-seed wt. (gm.) | Grain yield (kg ha-1) |
| CN application (kg ha-1) | |||||
| 60 | 39.33 | 9.79 | 16.65 | 42.94 | 4.25 |
| 90 | 40.53 | 10.01 | 16.93 | 43.65 | 4.45 |
| 120 | 43.58 | 10.47 | 18.23 | 44.52 | 4.94 |
| 150 | 46.03 | 10.90 | 18.88 | 44.89 | 5.10 |
| DN application (kg ha-1) | |||||
| 80 | 41.13 | 9.99 | 17.70 | 43.25 | 4.36 |
| 90 | 42.18 | 10.21 | 17.78 | 43.67 | 4.91 |
| 120 | 43.45 | 10.53 | 18.45 | 44.66 | 5.02 |
| 100 | 41.58 | 10.13 | 17.68 | 43.97 | 4.87 |
| LSD | 1.78 | 0.41 | 1.15 | 0.38 | 0.40 |
| CV (%) | 2.87 | 2.71 | 4.40 | 0.59 | 5.74 |
CN = Conventional nitrogen, DN = Dynamic nitrogen, LSD = Least significance difference at 5% level of significance, CV = Coefficient of variation
Correlation between Grain Yield and SPAD Meter Reading
The correlation coefficient between wheat grain yield and SPAD values is presented in Table 3. The SPAD meter readings at different days after sowing are positively correlated with grain yield. A positive association between chlorophyll meter reading and grain yield is reported in many studies.30,31 SPAD meter readings as an estimate of leaf chlorophyll content correlate with grain yield as accurately as leaf N concentrations.15-32 This study reveals that SPAD meter readings at 33 and 45 DAS were highly correlated (r33 = 0.74 and r45 = 0.79) with the grain yield. Correlation coefficients were low at 27 and 39 DAS as SPAD values dropped (Figure 1). Interestingly, except conventional N management at 150 kg ha-1, all DN fertilizer management maintained higher SPAD values up to 45 DAS. The maintenance of need-based fertilizer at early stage of the crop as well as appropriate amount of N application in each time in DN120 treatment gave better yield and almost similar to CN150 but higher compared to CN120.
Table 3: Correlation matrix between grain yield and SPAD meter readings of wheat grown under conventional nitrogen (CN) and dynamic nitrogen (DN) management.
|
Para-meter |
Y | X1 | X2 | X3 | X4 | X5 | X6 | X7 | X8 | X9 |
X10 |
| Y | 1 | ||||||||||
| X1 | 0.68** | 1 | |||||||||
| X2 | 0.51** | 0.37* | 1 | ||||||||
| X3 | 0.74** | 0.60** | 0.52** | 1 | |||||||
| X4 | 0.54** | 0.64** | 0.49** | 0.39* | 1 | ||||||
| X5 | 0.79** | 0.73** | 0.63** | 0.60** | 0.74** | 1 | |||||
| X6 | 0.63** | 0.66** | 0.53** | 0.41* | 0.71** | 0.89** | 1 | ||||
| X7 | 0.67** | 0.52** | 0.29 | 0.50** | 0.52** | 0.53** | 0.58** | 1 | |||
| X8 | 0.59** | 0.52** | 0.17 | 0.57** | 0.37* | 0.40* | 0.38* | 0.78** | 1 | ||
| X9 | 0.51** | 0.43* | 0.20 | 0.57** | 0.22 | 0.35* | 0.33 | 0.67** | 0.91** | 1 | |
| X10 | 0.39* | 0.16 | 0.18 | 0.44* | 0.33 | 0.25 | 0.27 | 0.66** | 0.79** | 0.78** | 1 |
Here, wheat grain yield= Y(t/ha) and X1, X2, X3, X4, X5, X6, X7, X8, X9 and X10 are the SPAD readings at 21, 27, 33, 39, 45, 51, 57, 63, 72, & 84 DAS respectively, * and ** indicate significance at 5 and 1% respectively.
Conclusion
From the study, it reveals that SPAD chlorophyll meter helps to quantify leaf greenness in wheat. Thus meter values should be maintained 45 at early stages, and appropriate amount of N fertilizer should be top-dressed to facilitate growth and development towards higher grain production. It also affirms that chlorophyll meter-based N management saved significant amount of nitrogen without significant yield loss. Therefore, SPAD chlorophyll meter can be a useful tool to the farmers of subtropical region for maintaining judicious use of N fertilizer and sustainability of growing wheat.
References
- FAS (Foreign Agricultural service). 2016. Foreign Agricultural service, United States Development of Agriculture, Office of Global Analysis. http://apps.fas.usda.gov/psdonline/circulars/production.pdf
- Babu, M., Nagarajan, R., Ramanathan, S. P., and Balasubramanian, V., Optimizing chlorophyll meter threshold values for different season and varieties in irrigated lowland rice systems of the Cauvery delta zone, Tamil Nadu, India. International Rice Research Note (IRRN), 27-28 (2000).
- Kiran, B., and Bargali, S. S., Nutrient utilization efficiencies of two Central Himalayan tree species. Journal of Tropical Forest Science 12 (3): 450-458 (2000).
- Bargali S. S., Efficiency of nutrient utilization in an age series of Eucalyptus tereticornis plantations in the tarai belt of Central Himalaya. Journal of Tropical Forest Science 7 (3): 383-390 (1995).
- Chen, X., Zhang, F., Romheld, V., Horlacher, D., Schulz, R., Boning-Zilkens, M., Wang, P., and Claupein W., Synchronizing N supply from soil and fertilizer and N demand of winter wheat by an improved Nmin method. Nutrient Cycling in Agroecosystems, 74: 91–98 (2006).
CrossRef - Rahman, M. Z., Islam, M. R., Islam, M. T. Karim, M. A. 2014. Dry matter accumulation, leaf area index and yield responses of wheat under different levels of nitrogen. Bangladesh Journal of Agriculturist. 7(1): 27–32 (2014).
- Glynn, C. P, Keary, I. P and Noviss, K., The potential of a chlorophyll content SPAD meter toquantify nutrient stress in foliar tissue of sycamore (Acerpseudoplatanus), English oak (Quercus robur), and European beech (Fagus sylvatica). Arboriculture and Urban Forestry, 34 (2): 89–100 (2008).
- Chapman, S. C., and Barreto, H. J., Using chlorophyll meter to estimate specific leaf nitrogen of tropical maize during vegetative growth. Agronomy Journal, 89: 557-562 (1997).
CrossRef - Varinderpal-Singh, B. S., Yadvinder-Singh, H. S. T. and Gupta, R. K., Need based nitrogen management using the chlorophyll meter and leaf colour chart in rice and wheat in South Asia: a review. Nutrient Cycling in Agroecosystems, 88: 361–380 (2010).
CrossRef - Arregui, L. M., Lasa, B., Lafarga, A., Iraneta, I., Barja, E., Quemada, M., Evaluation of chlorophyll meters as tools for N fertilization in winter wheat under humid Mediterranean conditions. European Journal of Agronomy, 24: 140–148 (2006).
CrossRef - Debaeke, P., Rouet, P. and Justes, E., Relationship between the normalized SPAD index and the nitrogen nutrition index: application to durum wheat. Journal of Plant Nutrition29: 75-92 (2006).
CrossRef - Lopez-Bellido, R. J., Shepherd, C. E., Barraclough, P. B., Predicting post-anthesis N requirements of bread wheat with a Minolta SPAD meter. European Journal of Agronomy, 20: 313–320 (2004).
CrossRef - Barraclough, P. B., and Kyte, J., Effect of water stress on chlorophyll meter readings in winter wheat. Developments in Plant and Soil Sciences, Plant Nutrition, 92: 722-723 (2006).
- Gholizadeh, A., Amin, S., Anuar, M., and Aimrun, A. R., Evaluation of SPAD chlorophyll meter in two different rice growth stages and its temporal variability. European Journal of Scientific Research, 37 (4): 591-598 (2009).
- Singh, B., Singh Y., Ladha, J. K., Bronson, K. F., Balasubramanian, V., Singh, J., and Khind CS. Chlorophyll meter- and leaf color chart-based nitrogen management for rice and wheat in northeastern India. Agronomy Journal, 94: 821–829 (2002).
CrossRef - Vidal, I., Longeri L., and Hetier, J. M., Nitrogen uptake and chlorophyll meter measurement in spring wheat. Nutrient Cycling in Agroecosystems,55: 1-6 (1999).
CrossRef - Chandurkar, V. P., Kubde, K. J., Dahiphale, A. V., Thakare, G. V. and Deshmukh,A.H. Effect of different levels of nitrogen on yield protein content and nitrogen uptake by wheat cultivars. Akola, India: Forum for Plant Physiologists. Annals-of-Plant-Physiology. 18 (1): 99-100 (2007).
- Bellido, L. L., Bellido, R. J. L., Castillo, J. F., and Bellido, F. J. L., Effect of tillage, crop rotation and nitrogen fertilization on wheat under rainfed Mediterranean conditions. Agronomy Journal, 92 (2): 1056-1066 (2000).
- Kibe, A. M., Singh, S. and Kalra, N., Water-nitrogen relationship for wheat growth and productivity in late sown conditions. Agricultural Water Management, 84: 221-228 (2006).
CrossRef - Rahman, M. Z., Islam, M. R., Islam, M. T. and Karim, M. A.,Dry matter accumulation, leaf area index and yield responses of wheatunder different levels of nitrogen. Bangladesh Journal of Agriculturist, 7 (1): 27–32 (2014).
- Vibhuti, Shahi, C., Bargali, K., and Bargali S. S., Seed germination and seedling growth parameters of rice (Oryza sativa L.) varieties as affected by salt and water stress. Indian Journal of Agricultural Sciences 85 (1): 102-108
- Shahi C., Vibhuti, Bargali, K., and Bargali, S. S., How Seed Size and Water Stress affect the Seed Germination and Seedling Growth in Wheat Varieties? Current Agriculture Research Journal 3 (1): 60-68 (2015a).
CrossRef - Shahi C., Vibhuti, Bargali, K., and Bargali, S. S., Influence of seed size and salt stress on seed germination and seedling growth of wheat (Triticum aestivum L.). Indian Journal of Agricultural Sciences 85 (9): 1134-1137 (2015b).
- Warraich, E.A., Ahmed, N., Basra, S. M. A., and Afzal, I., Effect of nitrogen on source-sink relationship in wheat. International Journal of Agriculture and Biology,4: 300-302 (2002).
- Bali, S. A, Khan, M., Shah, M. H., Singh, K. N., and Singh T., Yield behavior and various physio-agronomic characters of wheat (Triticum durum) and triticale genotypes as influenced by nitrogen fertilization under the temperate conditions of Kashmir. Indian Journal of Agronomy, 36 (4): 482-487 (1991).
- Ahmed, M. and Hossain, S. M. A., Effect of seed rate, nitrogen fertilization and time of harvest on the seed yield of wheat. Bangladesh Agronomy Journal, 4 (1 & 2): 35-43 (1992).
- Chandurkar, V. P., Kubde, K. J., Dahiphale, A. V., Thakare G. V., and Deshmukh, A. H., Effect of different levels of nitrogen on yield, protein content and nitrogen uptake by wheat cultivars. Annals Plant Physiology, 18 (1): 99-100 (2004).
- Ali, L., Mohy-Ud-Din Q., and Ali M., Effect of different doses of nitrogen fertilizer on the yield of wheat. International Journal of Agriculture and Biology, 5 (4): 438-439 (2003).
- Virender, S., Sharma, S. K., and Randhawa, A. S., Performance of wheat varieties under different sowing dates and nitrogen levels in the sub-monlane region of Punjab. Indian Journal of Agronomy, 47 (3): 372-377 (2002)
- Islam, M. R., Haque, K. M. S., Akter, N., and Karim, M. A., Leaf chlorophyll dynamics in wheat based on SPAD meter reading and its relationship with grain yield. Scientia Agriculturae, 8 (1): 13-18 (2014).
- Follett, R.H., Follett R.F. and Halvorson. A.D.. Use of chlorophyll meter to evaluate the nitrogen status of dryland winter wheat. Communications in Soil Science and Plant Analysis 23: 687-697 (1992).
CrossRef - Schepers, J. S., Francis, D. D., Vigil, M. F., and Below, F. E., Comparison of corn leaf nitrogen concentration and chlorophyll meter readings. Communications in Soil Science and Plant Analysis, 23: 2173–2187 (1992).
CrossRef