Introduction
Glasshouses are wood or metal constructions which are covering by various transparent materials such as sheet glass. Particular microclimatic conditions are created inside glasshouses in order to grow efficiently plants of warmer regions or plants which can give marketable products out of season. Solar radiation (SR) enters glasshouse in a great percentage, in average 85%, through the covering materials, resulting in the heating of the objects inside it. Apart from the contribution of SR in the heating of the glasshouse, long-wave radiation plays also an important role with its release by the plants and the ground, mainly during the night hours. This type of radiation bounds in the interior of the glasshouse, mainly due to sheet glass and existence of water vapors.1
The thermal conditions inside glasshouses, have been studied meticulously and various methods have been developed for their regulation by the humans, depending, in a high degree, on the season.2 Nevertheless, to our knowledge, literature provides no available information with regard to the bioclimatic conditions, and especially their quantification, for humans, inside glasshouses. The need to quantify the bioclimatic conditions in glasshouses would be a good first step to adopt more effective strategies for better working conditions and efficiency of the workers. Human bioclimatic conditions, that is, thermal comfort conditions, may be expressed by many indices, more (e.g. rational) or less (e.g. direct) sophisticated. One user-friendly direct index with wide use spatially and temporally3 is the thermohygrometric index (THI) which has been suggested as a universal heat stress index.4
Besides the alteration of light availability by shading,5 it has been proved an effective mean to reduce air temperature (T) values inside glasshouses when extreme T conditions take place in outside environment, especially in summer.1 Apart from interior environments like glasshouses as mentioned before, shading affects outdoor thermal environments, influencing thus, the thermal perception of people in outdoor spaces.6 It has been reported that thermal comfort, being estimated by physiologically equivalent temperature (PET), is best when a location is shaded during summer.7
Matsoukis et al.,8 grew lantana plants in a glasshouse, under three different shading levels after treatments with drenched-applied paclobutrazol (PBZ) aiming to create easthetically attractive products (small plants with increased flowering). The present work, which is an extension of the work mentioned above, aims to investigate the hypothesis of the different bioclimatic conditions of the aforementioned shading levels. Thus, purpose of our present work is to quantify the bioclimatic conditions of three shading levels (0%, 28% and 66%) which were used for the cultivation of the PBZ-treated lantana plants, especially in summer.
Materials and Methods
The experiment took place in a glasshouse in Attica (37048΄20΄΄N, 23057΄48΄΄E), Greece, from June to November, following a preliminary experiment, a year ago, according to Matsoukis et al.,8 Potted lantana plants of uniform size, beginning from the stage of cutting and subjecting to the same agricultural practices, were drenched with PBZ (Cultar, 250 g active ingredient l-1, Zeneca, Wilmington, Delaware, USA) solutions.8
At the same time (15 June), these plants were placed in three plots (each one of 190 m2) where different levels of incident SR were achieved with the aid of shading polyethylene nets, being placed 1.5 m above ground surface. Thus, there was a plot (L2) covered with black thin woven net (28% shading level; model 103 of Manioudaki Bros S. A. knitting factory, Greece), a plot (L3) covered with black dense woven net (66% shading level; model 201 of the aforementioned factory) and a non-shaded plot (0% shading level, L1). Each plot had an open vertical side, with the other three vertical sides being covered by white opaque plastic sheets of polypropylene (model Velliflor of Vellis A.E. company, Greece). The same type of sheet was used to cover the ground surface for the prevention of weeds emergence. In each plot there were 1176 lantana pots (equal number of one-plant replicates in each PBZ treatment. Plants irrigated manually as needed.
Incident SR, T and relative humidity (RH) data were monitored by three dataloggers (model 903; Wilh. Lambrecht, GmbH, Germany) and sensors for these parameters (model 1610 of Wilh. Lambrecht, GmbH, Germany, for SR; measuring range 0.3 to 3.0 μm; sensitivity of 15 mV 1000 W m-2, model 809 L 0-100 of the aforementioned company; accuracy ±0.3o at 0o and ±2.5% for T and RH, respectively). Daily measurements were taken beneath the shading materials at a height equal to the top of the plant canopies. This height was considered as the average height for the activities of a worker. Incident SR measurements were taken hourly during daytime from 05:00 to 16:00 h Greenwich Meridian Time (GMT). Air temperature and RH were monitored simoultaneously every 10 min.
To study the bioclimatic conditions under the three shading levels, T and RH averages were calculated on a hourly basis for each plot for the whole examined period (almost six months). These values were used for the calculation of the average hourly values of a widely used index,4 the thermohygrometric index (THI), requiring only T (o) and RH (%) data,9 according to the following equation:
THI (o)= T-[(0.55-0.0055RH) (T-14.5)] (1)
In this paper, summer, which presents ‘extreme’ biometeorological conditions (heat stress)10 and, especially, the summer month August is presented. For the aforementioned month, the three light regimes for 0%, 28% and 66% shading levels provided average daily SR of 413±22.2 (mean±standard error of the mean) W m-2, 298±9.4 W m-2 and 139±4.3 W m-2, respectively. Average THI values were used for the evaluation of bioclimatic conditions (Table 1) as modified from Toy et al.,9 According to Unger11 and Yilmaz et al.,12 the optimum THI values occur between 15 and 20o, and that is the basis for the comfortable conditions. The relative frequencies of the different classes of THI were calculated on a two-hour basis for each shading level. Analysis was performed using MS Excel 2007.
Results and Discussion
The plot with the full light regime (0% shading) was warmer in relation to the other examined plots (28% and 66% shadings), in terms of mean values of daily average, maximum and minimum T and the plot with the low light regime (66% shading) presented the higher value of mean daily RH. Note that the development of lantana plants was unobstructed in the three examined light environments. The relative frequencies of different THI classes for the examined shading levels which express quantitatively their bioclimatic conditions are illustrated in Figures 1, 2 and 3. Totally, four classes of THI values (torrid, very hot, hot and comfortable) were detected. In the particular glasshouse, taking into account that the various activities of the workers, with regard to their work in the glasshouse, took place mainly between 08:00 and 20:00 h LST (LST: Local Standard Time = Greenwich Meridian Time + 2h), it was decided to divide the whole day in two parts: the daytime period, comprising the hours between 08:00 and 20:00 h, and the nighttime period, comprising the rest hours (22:00-06:00 h).
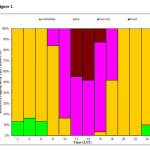 |
Figure 1: Relative frequencies of different categories of thermohygrometric index (THI) values on two-hour basis at the plot with 0% shading in the glasshouse, during August (LST: Local Standard Time = Greenwich Meridian Time + 2h). |
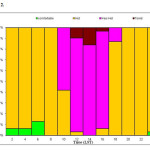 |
Figure 2: Relative frequencies of different categories of thermohygrometric index (THI) values on two-hour basis at the plot with 28% shading in the glasshouse, during August (LST: Local Standard Time = Greenwich Meridian Time + 2h). |
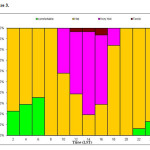 |
Figure 3: Relative frequencies of different categories of thermohygrometric index (THI) values on two-hour basis at the plot with 66% shading in the glasshouse, during August (LST: Local Standard Time = Greenwich Meridian Time + 2h). |
Table 1: Relation of bioclimatic conditions with thermohygrometric index. (THI)
| Bioclimatic conditions (THI classes) | THI (o) values |
| Comfortable | +15.0 to +19.9 |
| Hot | +20.0 to +26.4 |
| Very Hot | +26.5 to +29.9 |
| Torrid | >+30.0 |
At all the examined light environments, during the daytime period, the ‘Comfortable’ class was absent, meaning that the workers for the aforementioned period felt more or less discomfort, accordingly to the percentages of both dominated THI class and other existed classes. Note that the greater the difference of THI values (as a class) from these of ‘Comfortable’ class, the more the discomfort is, as it can be seen from the characterization of the classes (Table 1). Results are discussed in terms of average values.
At the plot with the full light environment (0% shading), during the daytime period (Figure 1), the majority of the THI values was classed as ‘Very Hot’ (48.4%) and the rest THI values were in the ‘Hot’ and ‘Torrid’ classes in 36.4% and 15.2%, respectively. As regards the nighttime period, in the aforementioned plot (Figure 1), there were only two classes, the prevailing ‘Hot’ class, with a percentage of 89.7%, and the ‘Comfortable’ class which occupied a relatively small percentage (10.3%).
The bioclimatic conditions were quite different in the plot with the medium light environment (28% shading), compared to the non-shaded plot, for the daytime period (Figure 2). The classes ‘Hot’ (48.4%) and ‘Very Hot’ were almost equal in percentages with their difference to be not more than 0.9%. A small percentage of THI values (4.1%) lied in the ‘Torrid’ class. Examining the rest hours (nighttime period), it was established that the majority of the THI values was found in the ‘Hot’ class (Figure 2) with a percentage of 94.2% and the rest small percentage of THI values was classed as ‘Comfortable’ (5.8%).
Investigating the plot with the low light environment (66% shading), it was confirmed that the majority of the THI values lied in the ‘Hot’ class for the period between 08:00 and 20:00 h (Figure 3) with a percentage of 61.3%. The rest THI values were classed as ‘Very Hot’, occupying a noticeable percentage (36.9%), and ‘Torrid’, covering a very small percentage (1.8%). Considering the nighttime period (20:00-08:00 h), the majority of the THI values was classed as ‘Hot’ (78.7%) and the remaining percentage of THI values (21.3%) was classed as ‘Comfortable’ (Figure 3).
It is clear, from the results of our study, that the environment with the full light regime (0% shading) provided less favorable bioclimatic conditions compared to the other examined light regimes (28% and 66% shadings), during the daytime period. This was due to the occurrence of greater percentages of THI values in the ‘Very Hot’ and ‘Torrid’ classes. The aforementioned bioclimatic conditions in the non-shaded plot may be attributed, to a great degree, to the higher T values, because of the direct incidence of SR,13 in relation to those in the shaded plots, during the daytime period. Between 28% and 66% shadings, more favorable bioclimatic conditions were established at 66% shading, bearing in mind that, at this light environment, ‘Very Hot’ and ‘Torrid’ classes were in considerably smaller percentages. The aforementioned bioclimatic conditions may be explained, mainly, by the denser weaving of the shading net at the low light experimental plot resulting in reduced amount of incident SR above plant canopies.
The circumstances were quite different in nighttime hours in comparison to daytime hours. The absence of ‘Very Hot’ and ‘Torrid’ classes in nighttime period, irrespective of examined light environment, offered a good point to characterize this period as more friendly, bioclimatically, compared to the respective daytime period. Among the three studied shadings in nighttime period, the more favorable bioclimatic conditions were noticed in the low light regime (66% shading) as ‘Hot’ and ‘Comfortable’ classes obtained lower and higher percentages of THI values, respectively, compared to each of the other light regimes. The reduced amount of incoming SR above plant canopies at 66% shading during daytime period may be a satisfactory reason for these favorable bioclimatic conditions at nighttime period. The less favorable bioclimatic conditions were detected at the plot with 28% shading as the ‘Hot’ and ‘Comfortable’ classes occupied higher and lower percentages of THI values, respectively, compared to other shadings.
In conclusion, from the analysis of the results of this study for the summer month August, the period between 22:00-06:00 h (nighttime period) was more favorable, bioclimatically, compared to the period between 08:00-20:00 h (daytime period), independently of the examined light environment. Thus, it is suggested workers to program their work during the nighttime period and to act the daytime period only if it is absolutely necessary. If this is not possible, necessary precautions must be taken, e.g. appropriate clothing, sufficient hydration and avoidance mainly of the direct SR. The low light environment (66% shading) was proved to be bioclimatically most desirable compared to high and medium light environments (0% and 28% shadings, respectively) at the nighttime period. Similarly, the low light environment was more favorable for the workers, bioclimatically, during daytime period in comparison to other examined light environments. The findings of this study could be applicable for a more suitable planning of the work in other plant cultivations inside glasshouses and generally interior environments in the hot period of the year.
References
- Chronopoulou-Sereli A. and Flocas A., Lessons of Agricultural Meteorology and Climatology, Ziti Publications, Thessaloniki, Greece, 557 p. (2010).
- Chronopoulou-Sereli A., Tsiros I., Kamoutsis A., Matsoukis A., Droulia F., Charalampopoulos I. And Chronopoulos K., General and Specific Topics of Bioclimatology, Applications-Exercises, Ziti Publications, Thessaloniki, Greece, 190 p (2012).
- Chronopoulou-Sereli A. and Chronopoulos I., Biometeorology-Bioclimatology, Applications to the configuration of outdoor spaces, Ziti Publications, Thessaloniki, Greece, 238 p. (2011).
- Chronopoulos K., Kamoutsis A., Matsoukis A. and Manoli A., An artificial neural network model application for the estimation of thermal comfort conditions in mountainous regions, Greece. Atmόsfera, 25, 171-181 (2012).
- Matsoukis A.S., Gasparatos D. and Chronopoulou-Sereli A., Micronutrient content in relation to specific leaf area, light regime and drenched-applied paclobutrazol in Lantana camara L. Current Agriculture Research Journal, 3, 101-104 (2015).
CrossRef - Lin T.P., Matzarakis A. and Hwang R.L., Shading effect on long-term outdoor thermal comfort. Building and Environment, 45, 213-221 (2010).
CrossRef - Hwang R.L., Lin T.P. and Matzarakis A., Seasonal effects of urban street shading on long-term outdoor thermal comfort. Building and Environment, 46, 863-870 (2011).
CrossRef - Matsoukis A.S., Chronopoulou-Sereli A., Dimopoulos I.D. and Kamoutsis A., Response of Lantana camara L. subsp. camara to paclobutrazol and shading. Canadian Journal of Plant Science, 81, 761-764 (2001).
CrossRef - Toy S., Yilmaz S. and Yilmaz H., Determination of bioclimatic comfort in three different land uses in the city of Erzurum, Turkey. Building and Environment, 42, 1315-1318 (2007).
CrossRef - Μatsoukis A., Kamoutsis A., Chronopoulos K. and Fotos D., Role of burned and unburned pine (Pinus halepensis Mill.) areas to air temperature and thermal comfort conditions. Fresenius Environmental Bulletin, 19, 1125-1131 (2010).
- Unger J., Comparisons of urban and rural bioclimatological conditions in the case of a Central-European city. International Journal of Biometeorology, 43, 139-144 (1999).
CrossRef - Yilmaz S., Toy S. and Yilmaz H., Human thermal comfort over three different land surfaces during summer in the city of Erzurum, Turkey. Atmósfera, 20, 289-297 (2007).
- Kamoutsis A., Chronopoulou-Sereli A. And Holevas C., Interaction of triapenthenol and environmental factors on the growth and flower bud formation of Gardenia jasminoides Ellis. Canadian Journal of Plant Science, 78, 635-640 (1998).
CrossRef