Introduction
Rice is the second most important cereal after maize in Ghana and is fast becoming a cash crop for many farmers.1 Beyond providing sustenance through income generation and human consumption, rice plays an integral, but important cultural role in many rural communities of Ghana.2 Annual per capita consumption of rice grew rapidly, from 17.5 kg in 1999 – 2001 to 22.4 kg in 2002–2004 and 24 kg in 2010 – 2011,3 and rice demand is projected to grow at a compound annual growth rate of 11.8 % in the medium term.1 In 2012, average rice yield in Ghana was estimated to be 2.5 t ha-1 while the achievable yield based on on-farm trials was 6–8 t ha-1.3 In the same year, northern region recorded the regional average yield of rice of 2.3 t ha-1, which was below the national average of 2.5 t ha-1 and far below the highest regional average (greater Accra region) of 6.5 t ha-1.3 Meanwhile the majority of local rice production in Ghana is realised from the northern region with 37 % of the estimated national production. Northern region is followed by Upper east (27 %) and Volta regions (15 %) of national production.3
Since 2003, various strives were made by government and non-governmental organisations in the rice sector in Ghana. These include the establishment and operation of the NRDS in 2009, the national fertilizer subsidy program in 2008 and seed subsidy in 2012. Also, various rice projects undertaken by donor agencies, majority of which were implemented in the period 2004 – 2009. Marked increased in yield was realised in 2008 and this was attributed to the fertilizer subsidy program. In addition, import levies of rice was about 20 % of the value of rice imports,4 rendering the local rice more affordable in order to boost its demand and as well as production. Despite all these interventions, the national average yield has remained low, between 2.5 t ha-1 3 and 2.2 t ha-1.5 Henceforth, Ghana is unable to meet local demand but relies on external sources. The low yield of rice can be attributed to the farmers’ practice – conventional management in rice production. Over 50 % of the rice farmers in the country still broadcast seed rice. In northern region less adoption of improved or high yielding varieties is substantial. This significant yield potential can be achieved through improvements in agronomic practices and adoption of underutilized beneficial innovations. There is the need for farmers to adopt good innovations such as System of Rice Intensification (SRI).
The System of Rice Intensification (SRI) is a methodology aimed at providing good conditions to unearth the optimum genetic potential of the rice plant which eventually increases the yield of rice produced in farming. SRI is a methodology for increasing the productivity of rice by changing the management of plants, soil, water and nutrients. It was developed in 1983 by the French Jesuit Father Henri De Laulanie in Madagascar. The principles of SRI include applying a minimum quantity of water and the individual transplanting of very young seedlings in a square pattern. The central principles of SRI accordingly6 are:
- Rice field soils should be kept moist rather than continuously saturated before reproductive stage, minimising anaerobic conditions, as this avoids the suffocation and degeneration of rice plant roots and also supports more abundant and diverse populations of aerobic soil organisms that provide multiple benefits to the plants. and supports the growth and diversity of aerobic soil organisms;
- Rice plants should be planted singly and spaced optimally, widely (preferably 25 cm × 25 cm) to permit more growth of roots and canopy and keep all leaves photosynthetically active, increase panicle bearing primary tillers per area, more filled grains and as well as higher grain weight; and
- Rice seedling should be transplanted when young less than 15 days old (preferably 8-12 days old) with just two leaves, quickly, shallow and carefully, to avoid trauma to roots and to minimize transplant shock.
SRI will be defined technically by key practices (principles) mentioned above, but not a fixed package to be followed strictly. Even though only a part of key practices is adopted, it can be considered as SRI as far as SRI effects appear. The principles of SRI originally proposed by Fr. Henri de Laulanié in 1983 are adhered to when chemical fertilizer is used in addition to the key principles of SRI.6 Quite recently, proponents of SRI are advocating for the use of compost or manure instead of the chemical fertilizer. The organic materials i.e. compost or manure improves soil fertility and enhances biological activity. In fact, they considered the use of the compost with the key SRI principles as the most preferable and ideal SRI.6 Changes in crop establishment as well as soil amendment have important implications for grain yield and farm operations, including primary tillage, seedbed preparation, planting, weeding, and water management. Only 20 percent of rice area in Ghana was transplanted ,7 while half of rice area was still planted through broadcasting and 30 percent through dibbling or drilling in the 2012 cropping calendar. The broadcasted rice fields are usually flooded continuously and weeds are hand pulled without the use of hoe.
Materials and Methods
Experimental Site
The trial was carried out during the 2014 dry season from January to June on the Golinga irrigation field at Golinga about 15 km from Tamale in the Tolon District in the Northern Region of Ghana. Golinga lies on an altitude of 183 m above sea level within latitude 09°21′ 346’ N and longitude 0o56’678’ W of the equator. It has a unimodal annual rainfall of 991 mm (in 2013 rainy season) which was evenly distributed from April to November with the peak in August and September. The mean minimum and maximum temperatures were 23.4o C and 34.5o C respectively. The minimum and maximum relative humidity of 46 % and 76.8 % were also recorded.8
Experimental Design and Treatments
The Randomized Complete Block Design (RCBD) was used in laying out the field. The total field was 378 m2 (42 m × 9 m) on the experimental site. Each block was 126 m2 (42 m × 3 m) and each plot measurement was 21 m2 (7 m × 3 m). Each block consisted of 6 randomly assigned treatment plots with 1m and 2m alleys between adjacent treatment plots in a block and adjacent blocks respectively. Each treatment was replicated three times.
The treatments were T1 = FP 1, T2 = FP 2, T3 = SRI 1, T4 = SRI 2, T5 = SRI 3 and T6 = SRI 4.
Notes
- FP 1 = Farmers’ practice; 1 = Seeds directly broadcast on plots, plots flooded continuously, hand pulling of weeds and application of recommended rates
- of chemical fertilizer that is 37.5 kg ha-1 each of N, P2O5 and K2O from the
NPK (15–15–15) and 26.25 kg ha-1 N from sulphate of ammonia as basal application and top dressing respectively.
- FP 2 =Farmers’ practice; 2 = Seeds directly broadcast on plots, plots flooded continuously, hand pulling of weeds and application of 13 t ha-1 compost.
- SRI = System of Rice Intensification. Nursing of seeds, early transplanting of seedlings (14 days old), wide spacing (25 cm × 25 cm), intermittent irrigation and earthing up of the soil through weeding by hoe were common practices in all the SRI treatments. However,
- SRI 1 received 13t of compost,
- SRI 2 received the recommended rates of chemical fertilizer application that is 37.5 kg ha-1 each of N, P2O5 and K2O from NPK (15-15-15) and 26.25 kg ha-1 N from sulphate of ammonia as basal application and top dressing respectively,
- SRI 3 received both 13t of compost and half recommended rate of N, P2O5 and K2O (18.75 kg ha-1 each) from 15-15-15 and
SRI 4 received both 13 t ha-1 of compost and half recommended rate of N (13.13 kg ha-1) from sulphate of ammonia.
Agronomic Practices
The field was ploughed at a depth of about 20 cm and was later harrowed and levelled. Sowings on both the nursery bed and broadcasted treatment plots were done on 16th February, 2014. The nursed rice seeds were transplanted with a wider spacing of 25 cm × 25 cm onto their respective treatment plots on 1st March, 2014 (14 DAP). The plots were irrigated to soak the soil up to a level of 2 cm. The soil was then allowed to dry out until cracks were seen, before next watering was carried out. During the flowering stage water at a level of 2 cm – 3 cm was maintained. On the other hand, plots with the farmers’ practice were flooded all the time.
The compost was incorporated into the soil 3 weeks before planting on 16th January, 2014. The treatments with recommended rates (RR) received an amount of 37.5 kg ha-1 each of N, P2O5 and K2O from NPK (15-15-15) as basal application and 26.25 kg ha-1 of N from sulphate of ammonia as top dressing. The treatments with compost received 13 t ha-1 compost and the treatments with half recommended rate (HRR) received either 18.75 kg ha-1 each of N, P2O5 and K2O from NPK (15–15-15) as basal application or 13.13 kg ha-1 of N from sulphate of ammonia as top dressing. Basal application and top dressing were carried out at three weeks after planting (3 WAP) and six weeks after planting respectively (6 WAP). Using a hoe, the first weeding was carried out on 14th March, 2014 (4 WAP) on all the SRI plots. The subsequent weedings were carried out at 7 and 10 WAP. On the farmer practice fields, weeds were hand pulled as it was impossible to use the hoe.
Data Collected
Data were collected on plant emergence %, plant establishment %, plant height at 3, 6, 9 and 12 WAP, tiller count m-2, chlorophyll content, days to 50 % flowering, plant biomass m-2, panicle number m-2, panicle weight m-2, panicle length, number of grains panicle-1, number of unfilled grains panicle-1, 1,000 grain weight, sterility percent and grain yield.
The soil chemical analyses were carried out at the Savannah Agriculture Research Institute (SARI) laboratory, Nyankpala. The method developed by9 was used to determine the organic carbon concentration, Kjeldahl method developed by10 in determining the nitrogen concentration and the Bray method developed by11 to determine the phosphorus concentration. Soil samples were analysed for pH as described by.12 Procedures described by13 were adopted in determining the K, Mg and Ca concentrations of the soil.
Table 1: Baseline and post harvest soil chemical properties.
|
Treatment |
PH (1:2.5 soil: water) |
OC (%) | N (%) | P (mg kg-1) | K (mg kg-1) | Ca (mg kg-1) | Mg (mg kg-1) |
|
Baseline soil chemical properties |
|||||||
| Baseline soil sample | 4.75 | 0.48 | 0.054 | 4.524 | 55.63 | 78.54 | 42.99 |
|
Post harvest soil chemical properties |
|||||||
| FP 1 | 5.6 | 0.57 | 0.042 | 5.562 | 51.84 | 156.75 | 155.67 |
| FP 2 | 5.15 | 0.73 | 0.059 | 5.187 | 54.97 | 135.90 | 148.96 |
| SRI 1 | 5.31 | 0.59 | 0.0139 | 7.225 | 114.29 | 162.56 | 137.89 |
| SRI 2 | 5.32 | 0.62 | 0.0287 | 6.562 | 98.54 | 178.98 | 172.52 |
| SRI 3 | 5.9 | 0.54 | 0.026 | 5.966 | 61.28 | 164.69 | 198.74 |
| SRI 4 | 5.23 | 0.55 | 0.017 | 4.225 | 42.67 | 154.96 | 132.67 |
Data Analysis
Data collected were subjected to Analysis of Variance (ANOVA) and the means separated by the Least Significant Difference (LSD) at 5 % using Genstat statistical package (12th Edition).
Results and Discussion
The results presented in the figure and tables showed that emergence %, plant establishment %, plant height at 9 and 12 WAP, tiller count m-2, chlorophyll content, days to 50 % flowering, plant biomass m-2, panicle number m-2, panicle weight m-2, panicle length, number of grains panicle-1, and grain yield were significantly enhanced by the SRI. However, plant height at 3 WAP, harvest index, 1,000 grain weight and sterility percent were not significantly enhanced by the SRI.
Table 2: Effective of System of Rice Intensification (SRI) and Farmer Practice (FP) on rice emergence and growth parameters.
|
Treatments |
Plant emergence percent | Plant establishment percent | Plant height (cm) at 9 WAP | Plant height (cm) at 12 WAP | Chlorophyll content of plant at 9 WAP | Chlorophyll content of plant at 15 WAP |
Days to 50% flowering |
| FP 1 | 81.7 | 81.7 | 49.0 | 78.3 | 39.4 | 25.9 | 91.0 |
| FP 2 | 80.7 | 80.7 | 38.3 | 67.0 | 26.0 | 20.7 | 92.3 |
| SRI 1 | 86.0 | 97.3 | 52.7 | 83.0 | 33.5 | 28.7 | 104.3 |
| SRI 2 | 86.0 | 92 | 52.3 | 97.0 | 43.5 | 33.4 | 98.0 |
| SRI 3 | 86.0 | 93.3 | 46.7 | 81.3 | 36.7 | 29.5 | 100 |
| SRI 4 | 86.0 | 94.7 | 45.3 | 83.0 | 43.3 | 28.8 | 101 |
| F Pr. | <0.001 | <0.001 | < 0.007 | < 0.004 | < 0.001 | < 0.001 | < 0.001 |
| SED | 0.551 | 1.631 | 3.002 | 4.980 | 2.123 | 1.860 | 1.082 |
| LSD (50%) | 1.228 | 3.633 | 6.690 | 11.10 | 4.730 | 4.145 | 2.410 |
Plant Emergence
The SRI nursery recorded the highest emergence (86 %) which was significantly different from the control – FP 1 (81.7 %) (table 2). This could have arisen partly from the inability of seeds to have proper contact with the soil to facilitate water uptake, and partly probably due to seed loses due pests, diseases and environmental factors. This is in line with14 findings.
The SRI 1 (97.3 %) and SRI 4 (94.7 %) treatments recorded the highest establishment percent that were significantly different (p < 0.001) from the control, FP 1 (81.7 %). This might be due to careful handling of seedlings as well as transplanting of very young seedlings which prevented desiccation and trauma of the roots. This led to little or no interruption of plant growth and no ‘transplant shock’. The findings of15 confirms this assertion
Plant Height
At 9 WAP, the value 52.7 cm plant height recorded in SRI 1 was the highest which was statistically at par with values recorded in SRI 2, FP 1 and SRI 3. FP 2 had the lowest plant height (38.3 cm) (table 2). At the 12 WAP, the SRI 2 produced the highest plant height (97.0 cm) while FP 2 produced the lowest (67.0 cm). SRI 1, SRI 4, SRI 3 and FP 1 recorded 83.0 cm, 83.0 cm, 81.3 cm and 79.3 cm heights respectively (table 2). It was noticed that the SRI and/or the fertilizer application at all levels had greater impact in increased plant height (table 2). Increased plant height in the SRI was probably due to the wider spacing which promoted better roots and canopy spread. The findings [14] confirm this. The continuous weeding or earthen up associated with SRI could have also contributed to the increased plant height. This is similar to the earlier report15 that fields with continuous weeding with the weeder / hoe produced higher plant height as compared with fields whose weeds were hand pulled or applied with herbicides.
Also, increased plant height in chemical fertilizer applied treatments was probably due to the increased availability of nitrogen from chemical fertilizer sources which enhanced vegetative growth.
Chlorophyll Content
At the 9 WAP, the chemical fertilizers at all levels boosted (p<0.001) the chlorophyll content of the plant. The plant with highest chlorophyll was obtained in SRI 2 (43.5) which was statistically similar to SRI 4 (43.3) and the control – FP 1 (39.4) (table 2). This was probably due to enhanced nutrition especially nitrogen from the chemical fertilizers in plant led to enhanced chlorophyll content of the plant. Chlorophyll content was significantly enhanced (p<0.001) by the SRI at the 15 WAP. The flag leaf chlorophyll in SRI 2 (33.4) was the highest which was statistically similar to SRI 4 as compared with the control FP 1 (25.9) (table 2).
The SRI enhanced the chlorophyll content of the flag leaf of the plant at 15 WAP (table 2). This was probably due to the optimally wide spacing (25 cm × 25 cm) and single plant per hill in the SRI which did not only expose the leaves of the plant for optimum interception of sunlight but also ensured greater photosynthesis. This is similar to earlier findings.16 Also, the intermittent irrigation in SRI probably created a condition in the soil which permitted aerobic soil organisms to survive and contributed meaningful in fixing and the releasing of nutrients to the rice plant The hoe/weeder used earthen up the soil which probably facilitated the production of new roots which help in additional nutrient uptake. This could imply the reason why the net photosynthetic rate was greater in SRI plants than in FP plants (table 2).
50% Flowering
The SRI (p<0.001) enhanced the days to 50 % flowering. SRI 1 took the longest (104.3) days to flower, while FP 1 (control) took the shortest (91.0) days to flower (table 2). The SRI significantly (p< 0.001) enhanced the days to 50 % flowering. Seeds were broadcast under farmers’ practice (FP) entries. The delay in flowering in the SRI plants was probably due to longer and higher accessibility of nitrogen by the SRI plants. This confirms the finding of17 that higher levels of nitrogen in rice plant prolonged vegetative growth phase of the plant which in turn increased days to flowering.
The data obtained from the yield parameters of the rice plant are shown below.
Table 3: Effective of System of Rice Intensification (SRI) and Farmer Practice (FP) on rice yield parameters.
| Treatments | Tiller count at 9 WAP | Tiller count at 12 WAP | Plant dry biomass (kg) | Panicle number m-2 | Panicle weight (g) | Panicle length (cm) | Grains per panicle |
| FP 1 | 413 | 275 | 0.640 | 215 | 1.27 | 18.67 | 68.0 |
| FP 2 | 348 | 299 | 0.453 | 155 | 0.80 | 17.0 | 46.7 |
| SRI 1 | 719 | 583 | 0.605 | 338 | 1.33 | 23.67 | 111.7 |
| SRI 2 | 1018 | 836 | 1.236 | 457 | 3.13 | 25.67 | 127.7 |
| SRI 3 | 648 | 565 | 0.955 | 372 | 2.73 | 24.0 | 136.3 |
| SRI 4 | 639 | 518 | 0.840 | 351 | 2.60 | 24.0 | 135.3 |
| F Pr. | < 0.001 | < 0.001 | <0.001 | 0.004 | 0.01 | < 0.001 | < 0.001 |
| SED | 57.8 | 58.3 | 0.1104 | 58.5 | 0.575 | 1.065 | 12.53 |
| LSD (50%) | 128.7 | 129.8 | 0.2461 | 130.3 | 1.281 | 2.372 | 1.927 |
Tiller Count
Tillering was significantly enhanced (p<0.001 and p<0.001) by the SRI at the 9 and 12 WAP respectively. At 9 WAP, the SRI enhanced tillering of the plant. The highest tiller count (1018 m-2) was obtained in the SRI 2 as compared with FP 1 (413 m-2) – the control (table 3). The early transplanting in the SRI probably preserved the plants’ vigour and growth potential for tillering and root development. This observation is similar to earlier18 findings.
At 12 WAP, similarly SRI significantly boosted the number of productive tillers produced by the plant. The highest productive tillers (836 m-2) were obtained in SRI 2 as compared with the control – FP 1 (225 m-2) (table 3). The improved percentage of productive tillers in the SRI could have been facilitated by the conducive conditions created and efficient use of resources of the plant such as nutrients, solar radiation and water in the vegetative stage of plant. Organic sources might have also offered enhanced nutrition to the plants, especially micro nutrients which led to higher number of tillers in plants.19
Plant Dry Biomass
The SRI 2 recorded the highest (1.236 kg m2) dry biomass over the control FP 1 (0.64 kg m-2). The practice of not continuously flooding the rice field in the SRI might have promoted the profuse growth of the plant biomass. This is in agreement with20 findings that profuse shoot growth of the plant is facilitated by intermittent irrigation which provides good environment for proper growth and functioning of the plant root. Beneficial soil organisms also function well under intermittent irrigation.
Panicle Characteristics
The SRI 2 (457 m-2), SRI 3 (372 m-2), SRI 4 (351 m-2) and SRI 1 (338 m-2) which were not significantly different among themselves produced the highest panicle numbers over the control – FP 1 (215 m-2) (table 3). This was probably due to profuse tiller development of the rice in the SRI plots. The finding of14 confirms this. Also, SRI might have promoted an increase in panicle bearing primary tillers per unit area as reported by.15
Chemical fertilizers in SRI entries significantly (p<0.010) enhanced the panicle weight of the plant. The SRI with the chemical fertilizer combination at all levels promoted the panicle weight m-2 of the plant over the control (table 3). SRI 2 produced the greatest weight (3.1 g) which did not differ statistically with SRI 3 (2.7 g) and SRI 4 (2.6 g) but differed significantly with the FP 1 – control (1.3 g) (Table 3). SRI rice plants might have had an advantage in individual tillers over the control due to nutrient availability and usage. This is in agreement with21 findings. Heavy panicles might be the key to the high yield performance in SRI as indicated in table 3. SRI might have played an important role in single panicle development from the strong individual tiller associated with the SRI. Earlier21 finding confirms this.
SRI significantly (p<0.001) enhanced the panicle length of the plant. All the SRIs promoted the panicle length of the rice plant over the control (table 3). Highest panicle length (26 cm) recorded in SRI 2 was statistically similar to SRI 4 (24 cm), SRI 3 (24 cm) and SRI 1 over the control – FP 1 (19 cm) (table 3). Increased panicle length in plants in the SRI entries (table 3) was probably due to more availability of macro-nutrients as well as micro-nutrients for the SRI plants. Earlier15 findings support this SRI significantly (p<0.001) enhanced the number of grains per panicle of the plant. Rice plant under SRI produced significantly higher number of grains per panicle than that of the control (table 3). The highest number of grains per panicle (136) was recorded in SRI 3 which was statistically at par with SRI 4 (135), SRI 2 (128) and SRI 1 (112) over the FP 1 – control (68). Effective land preparation and practices under SRI probably resulted to positive and significant response of the rice plant to the fertilizer additions which led to increased number of grains per panicle (table 3). This is in line with the earlier findings [22] that there was a net accumulation and retention of total carbon, and the exchangeable cations (K, Ca, Mg) under effective land preparation and practices of rice cultivation.
Grain Yield
Grain yield was significantly (p<0.006) enhanced by the treatments. SRI 2 maximised grain yield (4026 kg ha-1 but similar results were observed with SRI 3 (3866 kg ha-1) and SRI 4 (3737 kg ha-1) treatments (fig. 1). SRI 1 performed similar to the control – FP 1 (2410 kg ha-1) while FP 2 performed poorly.
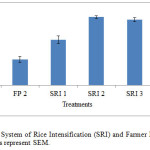 |
Figure 1: Effects of System of Rice Intensification (SRI) and Farmer Practice (FP) on rice yield kg/ha. Bars represent SEM. |
The outstanding grain yield obtained from the three treatments, SRI 2, SRI 3 and SRI 4 (Fig. 1) could be due to the adequate nutrients made to the test crop (rice). The improved conditions probably promoted better soil microbial activity, nutrient availability, soil aeration, redox potential, root growth, root activity and consequently grain yield. The plants utilised these conditions to their maximum genetic potentials which led to higher crop establishment, more vigorous crop growth and development as well as increased resistance to insect pests and diseases.
The conducive conditions facilitated by the SRI treatments included the wide spacing which ensured greater photosynthesis. In addition, alternate dry and wet irrigation promoted better root growth and functioning as well the existence and activities of anaerobic microorganisms. Also, early transplanting (less than 14 days old) of seedlings prevented transplanting shock.
These conditions eventually translated into 100 % or more increased yields in the SRI as compared with the farmer practice. This is similar to the report by23 that a combination of higher crop emergence, vigorous early crop growth and increased crop resistance to insect pests and diseases will result to a 5-20 % increase in yield.
The compost provided the micro-nutrients and increased the cation exchange capacity of soil. This probably improved nutrients availability. The compost combined with inorganic fertilizers might have also enhanced the growth and yield of the test crop. Earlier15 findings confirm this.
The supply of required nutrients from either the sole chemical fertilizer sources or in combination with the compost boosted proper nutrition of the crop which resulted in enhanced grain yield.24 The application of compost with inorganic nitrogen fertilizer sources combinations ensured longer supply of nutrients especially N which might have delayed senescence in the plants resulting to more photosynthesis during the seed filling stage.25 Good photosynthesis at seed filling stage enhanced the yield parameters which translated into higher yields in the plants under the SRI. This is similar to the earlier findings26 that grain yield in rice is a function of the yield components.
The low yield recorded in SRI 1 was probably due to too long days the plants took to flower (table 2)
Benefit – Cost Analysis
The benefit – cost analysis of the SRI and farmer practice entries are presented in table 4
Table 4: Benefit – Cost Analysis of System of Rice Intensification (SRI) and Farmer Practice (FP).
| Treatments | Service Charge(GHc) | Input Cost(GHc) | Labour Cost(GHc) | Total CostTC(GHc) | TotalRevenue TR(GHc) | B/CAnalysis(TR/TC) |
| FP 1FP 2SRI 1SRI 2SRI 3SRI 4 | 567551567583583583 | 7631563130150116801413 | 160515831822184519591959 | 293536973691292942223956 | 344621753847575755285344 | 1.170.591.041.971.311.35 |
According to [27], when Benefit – Cost analysis (B/C) is less than one (that is B/C < 1) the business enterprise is running at loss. When B/C is equal to one (that is B/C = 1) the business enterprise is running at break even and when B/C is greater than one (B/C > 1) the business enterprise is running at profit. The higher the B/C values from one, the higher the profit margin. Therefore table 4 revealed that FP 2 (0.59) produced loss whilst SRI 2 (1.97) was the most profiting venture. SRI 1 enterprise nearly produced (1.04) a break even, whilst SRI 4 (1.35) and SRI 3 (1.31) produced more profits than the control FP 1 (1.17).
The above assertions were as a result of the more and economical use of chemical fertilizers than the compost. Henceforth the plots that received more of the chemical fertilizers had higher Benefits – Cost Analysis values.
The results of the study revealed that SRI plant responded better to the soil amendment and was superior to farmer practice in all parameters measured. This was probably due to SRI enhanced nutrients accessibility and utilization by the plant. The experiment also showed that the SRI 2 enhanced grain yield and almost all other parameters above all other treatments. The SRI 3 and SRI 4 also enhanced all parameters including grain yield after SRI 2. Similarly, the benefit – cost analysis results showed that SRI 2 was the most economically viable entry, followed by SRI 4 and then SRI 3. From the soil analysis FP 2 produced the highest accumulation of soil organic matter (table 1). This entry can help improve upon the soil organic matter content in the soil for sustainable soil fertility management and crop productivity in subsequent years.
Statistically SRI 2, SRI 3 and SRI 4 can be recommended to farmers based on grain yield performance. With regards to Benefit – Cost analysis, SRI 2 was more profitable followed by SRI 4 and SRI 3 in sequence. Therefore, SRI 2 may be recommended to farmers. However, SRI 3 and SRI 4 had organic matter (compost) which could enhance general soil fertility and improve on Integrated Soil Fertility Management (ISFM) in Guinea Savannah Zone. Therefore, SRI 3 and SRI 4 could be recommended to farmers to enhance sustainable soil fertility management and crop productivity. FP 2 produced the highest accumulation of soil organic matter and could be recommended if the sole aim is to improve upon the soil organic matter content. This could improve yield in subsequent cropping seasons.
Acknowledgements
The authors are grateful to the Almighty God for the protection and divine guidance from the beginning to the successful end of the research. The authors wish to thank the Savannah Agricultural Research Institute for providing certified rice seed for the research and the Golinga Irrigation Authority for allocating irrigable land and irrigation services throughout the field work.
The authors also acknowledge the effort of all lecturers, technicians and teaching assistants of the Department of Agronomy, University for Development Studies for their contributions to the overall quality of this work.
References
- Millennium Development Authority, (MiDA). (2010). Investment Opportunity in Ghana: Maize, Rice, and Soybean. Accra, Ghana.
- Gangwar, K.S., Tomor O.T. and Pandey, D.K. (2008). Productivity and economics of transplanted and direct seeded rice (Oryza sativa L.) – based cropping system in Indo-Gangatic plains. Indian Journal of Agric. Sciences 78: 655-658.
- Ministry of Food and Agriculture, (MOFA). (2013). Agriculture in Ghana: Facts and Figures (2011). Accra, Ghana: Statistics Research and Information Directorate, MOFA. 1993-2012. Raw data on production, area cultivated and yield on various crops. MOFA, Accra, Ghana. Accessed on June 25 2013 at http://mofa.
- Angelucci F., Asante-Poku A. and Anaadumba., P. (2013). Analysis of incentives and disincentives for rice in Ghana. Technical notes series, MAFAP, FAO, Rome. 3-15pp.
- Crop Research Institute / Savannah Agriculture Research Institute / International Food Policy Institute, (CRI/SARI/IFPI). (2013). Survey. (November 2012–February 2013).
- Sato, S. (2012). Guidelines on SRI practice for tropical countries. Graduate school of agricultural and life sciences, University of Tokyo.
- Ragasa, C., Awere D., Patricia A., Alexander N. W., Antony, C., Marian, A. and Robert, T. (2013). Ghana Strategy Support system, (2013). Patterns of adoption of improved rice technologies in Ghana.IFPRI-ACCRA. c/o International Water Management Institute (IWMI) | PMB CT 112, Cantonments, Accra, Ghana | CSIR Campus (Opposite Chinese Embassy). 6-22pp.
- Savannah Agriculture Research Institute, SARI (2013). Annual Report.
- Walkley, A. and Black, I. A. (1939). An Examination of the Degjiareff Method for Determining Soil Organic Matter and Proposed Chronic Acid-Titration Method. Soil Sci 37:29-38.
CrossRef - Bremmer, J. M. (1965). Methods of Soil Analysis: Part 2. Total Nitrogen. Society of Agronomy, Madison, Wisconsin. 1149-1178pp.
- Bray, R. H. and Kurtz, L. T. (1945). Determination of total organic acid available forms of phosphorus in soils. Soil Science 59:39-45.
CrossRef - McLean, E.O., (1982). Soil pH and lime requirement. In: Methods of soil analysis, chemical and microbiological properties. Am. Soc. Agron. Madison, WI, USA. 2:199-22.
- Tel, D. A. and Hargerty, M. (1984). Soil and plant analyses study guide for agricultural laboratory directors and technologies working in tropical regions. ITTA and University of Guelph. 227pp.
- Larry, J. K., Dogbe, W., Boamah, P. O. and Agawini, J. (2012). Evaluation of planting methods for growth and yield of “digang” rice (Oryza sativa L.) under upland condition of Bawku, upper east region, Ghana. ARPN journal of Agricultural and Biological Sciences 7:815-818
- Muhammad, M. and Abdullah M. H. H. (2013). Modelling and forecasting on paddy production in Kelantan under the implementation of system of rice intensification (SRI). Acad. J. Agric. Res 1:106-113.
- Thiyagarajan, T.M. and Gujja, B. (2013). Transforming rice production with SRI (System of rice intensification). Knowledge and practice. National Consortium on SRI (NCS) 2013. 15-174pp
- West Africa Rice Development Association, (WARDA). (2004). Report of the 4th Biennial Regional Consultative Meeting (NECVIC), Republic of Cote d`Ivoire. 32 pp.
- Stoop, W. A., Uphoff, N. and Kassam, A. (2002). A review of agricultural research issues raised by the system of rice intensification (SRI) from Madagascar: Opportunities for improving farming systems for resource-poor farmers. Agricultural Systems 71:249-274.
CrossRef - Miller, H. B. (2007). Poultry litter induces tillering in rice. J. Sustain. Agric. 31:1-12.
- Latham, J. (2012). How millions of farmers are advancing agriculture for themselves. (Un)Sustainable Farming, Commentaries. December 3, 2012.
- Chen, S., Xi Z., Dangying W., Chunmei, X. and Xiufu, Z. (2013). Influence of the improved system of rice intensification (SRI) on rice yield, yield components and tillering characteristics under different rice establishment methods. Australian journal of crop science AJCS 6:1630-1636.
- Buri, M. M., Issaka, R. N., Wakatsuki, T. and Otoo, E. (2004). Soil Organic Amendments and Mineral Fertilizers: Options for Sustainable Lowland Rice Production in the Forest Agro-ecology of Ghana. Ghana. J. Agric. Food. Sci. 3:237-248.
- International Rice Research Institute, (IRRI). (2003). Rice fact sheet.
- Kadyal, V., Gangwar, K.S. and Anand, K.V. (2002). Assessment of organic and inorganic fertilization and plant density on production potential of rice-rice-cropping system. Madras Agriculture Journal 85:604-607.
- Fageria, N. K. and Baligar, V. C. (2005). Enhancing nitrogen use efficiency in crop plants. Advances in Agronomy 88:97-185.
CrossRef - Jeyabal, A., Palaniappan, S.P. and Chellaiah, S. (1999). Evaluation of integrated nutrient management technique in rice. Oryza. 36:263-265.
- Adegeye, A. J. and Ditto, J. S. (1985). Essentials of Agricultural Economics. Impact publishers Nigeria limited. Ibadan. 217-220pp.