

Introduction
Contamination of groundwater is irreversible process. It is main cause of spread of epidemics and chronic diseases in human, and if used for irrigation it severely damages crop and decreases grain production.1 Many researchers have been reported that rapid industrialization, urbanization and agricultural activities are affecting the groundwater quality. Assessment of fluoride contamination in groundwater2 of some villages was conducted in Northern Rajasthan and found that the level of fluoride was higher than that of recommended upper limit by WHO and Bureau of Indian Standard and area indexed as high risk for skeleton fluorosis. Endemic fluoros is3 in Southern Rajasthan has been studied and reported that increased bone mass and density as well as calcification of ligaments and interosseous membranes and osteosclerosis increased with age and fluoride concentration. Groundwater in fluorosis endemic areas might be a major contributing factor to total fluoride ingestion and calcium ingestion reduce to intestinal absorption of fluoride so diets rich in calcium, magnesium and vitamin-C.4 The study of high fluoride content in groundwater terrain of bankapatti area of Nagaur district was carried5 out and observed that large number of patients suffering from skeleton and dental fluorosis in some villages of study area. Assessment of heavy metals in correlation with physic-chemical properties of drinking water of Northern Rajasthan, India has also been reported6 and concluded that drinking water contaminated with heavy metals was prone to radiological and chemical threats for inhabitation.
The present study was carried out to demonstrate the utility of multivariate data analyses statistical techniques in characterization and classification of groundwater chemistry. The physico-chemical parameters of groundwater play a significant role in classifying and assessing the groundwater quality.
Materials and Methods
Study Area and Water Sampling
Fatehpur is located at 27°58’ to 27°98’ North Latitude and 74°57’ to 74°95’ East Longitude. It is situated at midway between Jaipur- Bikaner on National Highway-11 (NH-11) 48 km from Sikar. Fatehpur is a part of Shekhawati region. The map of study area is shown in fig.1.Ground water samples were collected from tube wells and open wells from different sampling sites as North Zone (Do Janti Balaji Mandir – Open well), South Zone (Government Dhanuka Hospital – Tube well), East Zone (Chamdia Villa- Tube well), West Zone (Jahangir Kua- Open well), North East Zone (Doli Sati Mandir – Tube well), South East Zone (Fatehpur Hospital- Tube well), South West Zone (Ragunathpura Stand – Open well), North West Zone (Laxminath Mandir -Tube well), Central Zone (Bawari Gate Stand -Tube well, Chhatria Stand- Tube well).
The ground water samples were systematically collected in pre cleaned, dry and sterilized plastic bottles of one litre capacity. The physicochemical, correlation and regression analysis were carried out for various parameters. Analytical grade reagents were used for the assessment of samples.
Methodology
The analysis of water samples for various physicochemical parameters were carried out using APHA methods.7 Temperature and pH were determined immediately at the place of collection while Turbidity, EC (electrical conductivity), total dissolved solids and dissolved oxygen were determined at the same day of sampling using Water Analyzer (Systronics-371).Total Alkalinity, Total Hardness (as CaCO3), Calcium Hardness (as CaCO3), Magnesium Hardness (as CaCO3) and Chloride determined by titrimetric methods. Fluoride determined by ion selective electrode method, nitrate by spectrophotometer, sulphate by turbidity method, sodium and potassium by atomic absorption spectrophotometer.
Statistical parameters have been calculated as follow:-
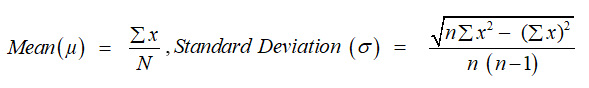
‘N’ and ‘n’ are Number of observations, x is value of parameter.
Karl Pearson Correlation coefficients (r) have been calculated between each pair of parameter as follow:-
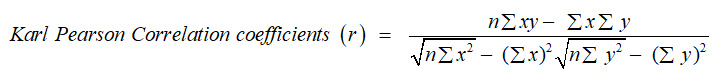
n = Number of observation, x and y are two variables.
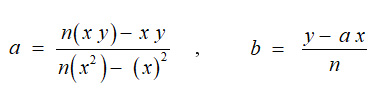
The linear regression equation y = a x + b was developed for the pairs having highly significant (0.8 <r<1.0) and moderate significant (0.6 <r<0.8) ‘r’ values.8,9
‘x’ is independent variable, ‘y’is dependent variable, ‘a’is Slope of line and ‘b’is intercept on y- axis.
‘a’ and ‘b’ can be calculated by following formula:-
Result and Discussion
Physicochemical and Correlation Analysis
In the present study, respective values of observed physicochemical parameters are summarised in table 1 and 2. The values of statistical parameters are shown in table 3. The Karl Pearson coefficient (r) among various water quality parameters had been calculated and the numerical values of correlation coefficients (r) are presented in table 4. Correlation coefficient (r) between any two parameters ‘x’ and ‘y’ was calculated for parameters such as fluoride, nitrate, total dissolved solids, pH, electrical conductivity, total alkalinity, total hardness, sulphate, bicarbonate, chloride, calcium, magnesium and sodium of the groundwater samples. It is presented as 13 x 13 correlation matrix.
Turbidity value of groundwater samples in the study area varied from 8.2 to 14.8 NTU with an average value of 10.8 NTU. According to BIS standard (5.0 -10.0 NTU) for turbidity 70% groundwater samples were found exceeding the permissible limits but according to WHO standard (5.0 NTU) all groundwater samples were found exceeding the permissible limits. The pH value of groundwater samples ranged from 7.6 to 8.7 with an average value of 8.19. According to BIS standard (6.5-8.5) for pH 30% groundwater samples were found exceeding the permissible limits.
Electrical conductivity value varied from 1161 to 1906 µmhos /cm with an average value of 1508.50 µmhos /cm. Electrical conductivity of water varies directly with the temperature and is proportional to its dissolved inorganic solids. Electrical conductivity had positive correlation with total alkalinity, total dissolved solids, nitrate, sulphate, bicarbonate, chloride, sodium and negatively correlates with TH, calcium and magnesium. High positive correlation of electrical conductivity with TDS and chloride indicates the high mobility of ions. Total alkalinity value ranged between 421 to 624 mg/L with an average value of 482.40 mg/L, indicated high alkaline nature of water in the study area. Almost all samples have total alkalinity values within the permissible limits of BIS standard (600 mg/L) except of Doli Sati Mandir. Total alkalinity had positive correlation with TDS, bicarbonate, chloride, sodium and negatively correlates with TH.
Solubility of CaF2 increase with the increase of total alkalinity
CaF2 + CO3-2 → CaCO3 + 2F–
CaF2 + HCO3–→ CaCO3 + 2F– + H2O + CO2
Total hardness value of groundwater samples varied from 155 to 334 mg/L as CaCO3 with an average value of 217.80 mg/L as CaCO3. In the present study, total hardness of 50 % groundwater samples were found exceeding the permissible limits of BIS standard (200 mg/L). High positive correlation of TH with Ca and Mg ions indicate that hardness was mainly due to presence of calcium and magnesium salts in groundwater water. Total dissolved solids value ranged between 778 to 1257 mg/L with an average value of 1001.70 mg/L. In the study area, all groundwater samples have total dissolved solids values under the permissible limits of BIS standard (2000 mg/L). Total dissolved solids have positive correlation with chloride, sodium, bicarbonate, fluoride, nitrate, sulphate and negatively correlate with TH, Ca and Mg.
Fluoride value varied from 4.8 to 7.5 mg/L with an average value of 6.11 mg/L. Fluoride value of all groundwater samples were found exceeding the permissible limits (BIS and WHO 1.5 mg/L). Fluoride concentration decreases with the increase of total hardness, calcium and magnesium hardness. Fluoride had positive correlation with electrical conductivity, total alkalinity, total dissolved solids, chloride, and sodium and negatively correlate with TH, Ca and Mg. A positive correlation between fluoride and total alkalinity indicate the alkaline nature of groundwater, which promotes the leaching of fluoride and thus increasing the fluoride concentration groundwater.11 In the intermediate pH of water bicarbonates ion was the dominant species of carbon. The positive correlation between fluoride and bicarbonate can be explained by considering the mass law equation relating to calcite and fluorite when both are in contact with water.12
CaF2(s) + HCO3– → CaCO3(s) + H+ + F–
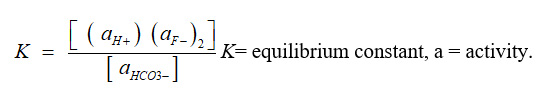
Thus at constant pH any increase or decrease in bicarbonate concentration may be accompanied by corresponding changes in fluoride concentration. From the above observation, it is clear that in groundwater the concentration of fluoride increases as the CO3-2 and HCO3– content of water increase and it decreases along with an increase in Ca and Mg contents.13
Nitrate value ranged between14.2 to 43.9 mg/L with an average value of 29.17 mg/L. Nitrate value of all groundwater samples in study area were found within the permissible limits of BIS (45-100 mg/L) and WHO standard (50 mg/L). Nitrate had positive correlation with sulphate. It may be due to the use of fertilizer for enhancing crop production and negative correlation with alkalinity and chloride. Sulphate value varied from 10.4 to 28.2 mg/L with an average value of 17.93 mg/L. All samples had sulphate value under the permissible limits of BIS (200-400 mg/L) and WHO standard (250 mg/L). Bicarbonate value ranged between 421 to 18.3 mg/L with an average value of 481.28 mg/L, indicated high alkaline nature of water in the study area. Bicarbonate had positive correlation with chloride, sodium and negatively correlates with TH, Ca and Mg. Chloride value varied from 90.5 to 192.6 mg/L with an average value of 134.02 mg/L. Chloride value of all samples under the permission limit (BIS 250 mg/L). Chlorides bear a positive correlation with sodium. It indicates that sodium chloride was more than calcium chloride and magnesium chlorides in the water samples. Sodium value of samples ranged between 110 to 318 mg/L with an average value of 198.40 mg/L. Sodium value were found 50% groundwater samples were exceed the BIS and WHO standards (200 mg/L).
Scatter diagram for highly significant positive correlation (EC- TDS, TA- HCO3–, F– – TA, SO4-2 – NO3–, Ca – TH, Mg-TH) and negative correlation (F– – TH, F– – Ca) are depicted in fig.1.
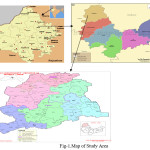 |
Figure 1: Correlation between various physico-chemical parameters of groundwater Fatehpur. Click here to View figure |
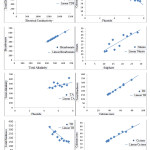 |
Figure 1a: Correlation between various physico-chemical parameters of groundwater Fatehpur. Click here to View figure |
Regression Analysis
The values of linear regression analysis are presented in table 5 and 7. The observed and predicted values of dependent variable followed by % error are given in table 6 and 8. Adjusted R2 values were very close to estimated R2 values that indicate the variable have adequate predictive ability for dependent variable and relevancy of regression model. The parameters, which have 0.00-0.05 p-value (significant value) were significantly related to their independent variable and >0.05 value were less significantly related. Most of parameters show significant correlation, which indicates high interactions of the chemical contents in groundwater.
Table 1: Physical parameters of groundwater of Fatehpur.
| S. No. | Sample site | Source | Code | Temp | Turbidity | pH | EC | TA | TH | Ca H | Mg H | TDS | DO |
| 1 | Chhatria Stand | OW | FTC1 | 24.5 | 10.6 | 8.7 | 1161 | 421 | 334 | 198 | 136 | 778 | 4.4 |
| 2 | Govt. Dhanuka Hospital | TW | FTC2 | 25.2 | 9.3 | 8.3 | 1587 | 510 | 210 | 126 | 84 | 1051 | 4.1 |
| 3 | Jahangir Kua | OW | FTC3 | 25.5 | 10.8 | 8.0 | 1507 | 452 | 280 | 162 | 118 | 1004 | 3.7 |
| 4 | RagunathpuraStand | OW | FTC4 | 25.4 | 8.2 | 8.2 | 1325 | 411 | 245 | 147 | 98 | 882 | 3.9 |
| 5 | LaxminathMandir | TW | FTC5 | 25.6 | 11.9 | 8.6 | 1662 | 467 | 170 | 102 | 68 | 1101 | 3.5 |
| 6 | Do JantiBalajiMandir | OW | FTC6 | 25.0 | 10.4 | 7.7 | 1472 | 492 | 164 | 96 | 68 | 980 | 4.3 |
| 7 | Doli Sati Mandir | TW | FTC7 | 26.0 | 14.8 | 7.6 | 1906 | 624 | 155 | 92 | 63 | 1257 | 3.0 |
| 8 | Bawari Gate | TW | FTC8 | 25.2 | 11.6 | 7.8 | 1581 | 532 | 270 | 162 | 108 | 1045 | 3.8 |
| 9 | Chamdia Villa | TW | FTC9 | 25.3 | 10.5 | 8.6 | 1495 | 441 | 190 | 115 | 75 | 992 | 3.6 |
| 10 | Fatehpur Hospital | TW | FTC10 | 25.5 | 9.9 | 8.4 | 1389 | 474 | 160 | 96 | 64 | 927 | 3.2 |
Table 2: Chemical parameters of groundwater of Fatehpur.
| S. No | Sample site | Source | Code | F– | NO–3 | SO4-2 | CO3-2 | HCO3– | Cl– | Ca+2 | Mg+2 | Na+ | K+ |
| 1 | Chhatria Stand | OW | FTC1 | 4.8 | 15.2 | 11.4 | 0.0 | 421.0 | 90.5 | 79.2 | 33.05 | 110 | 2.1 |
| 2 | Govt. Dhanuka Hospital | TW | FTC2 | 5.9 | 38.0 | 22.5 | 0.0 | 510.0 | 114.2 | 50.4 | 20.41 | 202 | 3.3 |
| 3 | Jahangir Kua | OW | FTC3 | 5.6 | 17.0 | 15.7 | 0.0 | 452.0 | 132.4 | 64.8 | 28.67 | 176 | 2.7 |
| 4 | Ragunathpura Stand | OW | FTC4 | 5.2 | 23.0 | 18.4 | 0.0 | 411.0 | 146.7 | 58.8 | 23.81 | 227 | 2.4 |
| 5 | LaxminathMandir | TW | FTC5 | 6.2 | 42.0 | 24.6 | 0.0 | 467.0 | 121.6 | 40.8 | 16.52 | 171 | 3.8 |
| 6 | Do JantiBalajiMandir | OW | FTC6 | 6.8 | 14.2 | 10.4 | 3.4 | 488.6 | 132.4 | 38.4 | 16.52 | 194 | 4.1 |
| 7 | Doli Sati Mandir | TW | FTC7 | 7.5 | 26.0 | 12.8 | 5.7 | 618.3 | 192.6 | 36.8 | 15.31 | 318 | 4.7 |
| 8 | Bawari Gate | TW | FTC8 | 5.4 | 43.9 | 28.2 | 2.1 | 529.9 | 128.4 | 64.8 | 26.24 | 210 | 3.2 |
| 9 | Chamdia Villa | TW | FTC9 | 6.5 | 40.0 | 20.5 | 0.0 | 441.0 | 144.6 | 46.0 | 18.23 | 162 | 3.9 |
| 10 | Fatehpur Hospital | TW | FTC10 | 7.2 | 32.4 | 14.8 | 0.0 | 474.0 | 136.8 | 38.4 | 15.55 | 214 | 4.6 |
Table 3: Standard deviation of physicochemical parameters of groundwater of Fatehpur.
| S. No. | Parameters | Minimum | Maximum | Average | Standard deviation |
| 1 | Turbidity | 8.2 | 14.8 | 10.8 | 1.76 |
| 2 | pH | 7.6 | 8.7 | 8.19 | 0.40 |
| 3 | Electrical Conductivity (EC) | 1161.0 | 1906.0 | 1508.50 | 200.89 |
| 4 | Total Alkalinity (TA) | 421.0 | 624.0 | 482.40 | 62.52 |
| 5 | Total Hardness (TH) | 155.0 | 334.0 | 217.80 | 61.58 |
| 6 | Calcium Hardness (CaH) | 92.0 | 198.0 | 129.60 | 36.12 |
| 7 | Magnesium Hardness (MgH) | 63.0 | 136.0 | 88.20 | 25.58 |
| 8 | Total Dissolved Solids (TDS) | 778.0 | 1257.0 | 1001.70 | 129.04 |
| 9 | Dissolve Oxygen (DO) | 6.0 | 7.4 | 6.75 | 0.45 |
| 10 | Fluoride | 4.8 | 7.5 | 6.11 | 0.89 |
| 11 | Nitrate | 14.2 | 43.9 | 29.17 | 11.56 |
| 12 | Sulphate | 10.4 | 28.2 | 17.93 | 5.94 |
| 13 | Bicarbonate | 421 | 618.3 | 481.28 | 60.85 |
| 14 | Chloride | 90.5 | 192.6 | 134.02 | 26.23 |
| 15 | Calcium | 36.8 | 79.2 | 51.84 | 14.44 |
| 16 | Magnesium | 15.31 | 33.05 | 21.43 | 6.22 |
| 17 | Sodium | 110.0 | 318.0 | 198.4 | 53.67 |
| 18 | Potassium | 2.1 | 4.7 | 3.48 | 0.89 |
Table 4: Correlation coefficient (r) of various groundwater quality parameters of Fatehpur.
| Parameters | pH | EC
|
T A | TH | TDS
|
F–
|
NO–3
|
HCO3–
|
Cl–
|
SO4-2 | Ca+2 | Mg+2
|
Na
|
| pH | 1 | ||||||||||||
| EC | -0.5313 | 1 | |||||||||||
| T A | -0.6952 | 0.8438 | 1 | ||||||||||
| TH | 0.2118 | -0.5869 | -0.4511 | 1 | |||||||||
| TDS | -0.5319 | 0.9999 | 0.8423 | -0.5908 | 1 | ||||||||
| F– | -0.3323 | 0.5978 | 0.5932 | -0.9068 | 0.5839 | 1 | |||||||
| NO–3 | 0.2397 | 0.4062 | 0.2117 | -0.3035 | 0.3986 | 0.1295 | 1 | ||||||
| HCO3– | -0.6874 | 0.8461 | 0.9998 | -0.4506 | 0.8446 | 0.5914 | 0.2234 | 1 | |||||
| Cl– | -0.5921 | 0.6706 | 0.6099 | -0.5782 | 0.6711 | 0.6712 | 0.0346 | 0.6045 | 1 | ||||
| SO4-2 | 0.1615 | 0.2687 | 0.0267 | 0.0406 | 0.2599 | -0.2760 | 0.8720 | 0.0376 | -0.1477 | 1 | |||
| Ca+2 | 0.2328 | -0.5924 | -0.4554 | 0.9987 | -0.5970 | -0.9154 | -0.2689 | -0.4547 | -0.5833 | 0.0699 | 1 | ||
| Mg+2 | 0.1812 | -0.5764 | -0.4430 | 0.9974 | -0.5794 | -0.8905 | -0.3510 | -0.4429 | -0.5684 | -0.0011 | 0.9923 | 1 | |
| Na | -0.5064 | 0.7085 | 0.7759 | -0.5434 | 0.7071 | 0.5958 | 0.0940 | 0.7737 | 0.8779 | -0.0405 | -0.5444 | -0.5395 | 1 |
Table 5: Regression equation for pairs of parameters having highly significant correlation coefficients (0.8<R<1.0) of groundwater of Fatehpur.
| S.
N. |
Pairs of parameters | R value | R2 | Adj. R2 | Regression coefficients | Regression equation
Y = ax + b |
Sig. | |
| a | b | |||||||
| 1 | EC-TA | 0.8438 | 0.7120 | 0.6297 | 0.2626 | 86.26 | TA = 0.2626 X EC + 86.26 | 0.01 |
| 2 | EC-TDS | 0.9999 | 0.9998 | 0.9997 | 0.6423 | 32.84 | TDS = 0.6423 X EC + 32.84 | 0.05 |
| 3 | EC- HCO3– | 0.8461 | 0.7159 | 0.6348 | 0.2563 | 94.67 | HCO3– = 0.2563 X EC+ 94.67 | 0.02 |
| 4 | TDS-TA | 0.8423 | 0.7095 | 0.6265 | 0.4081 | 73.59 | TA = 0.4081 X TDS +73.59 | 0.02 |
| 5 | TA- HCO3– | 0.9998 | 0.9996 | 0.9995 | 0.9731 | 11.82 | HCO3– = 0.9731 X TA +11.82 | 0.04 |
| 6 | F–– TH | – 0.9068 | 0.8223 | 0.7715 | – 62.83 | 601.71 | TH = – 62.83 X F– + 601.71 | 0.02 |
| 7 | Ca+2 – TH | 0.9987 | 0.9974 | 0.9967 | 4.2571 | – 2.89 | TH = 4.2571 X Ca+2– 2.89 | 0.00 |
| 8 | Mg+2 – TH | 0.9974 | 0.9948 | 0.9933 | 9.8812 | 6.04 | TH = 9.8812 X Mg+2+ 6.04 | 0.01 |
| 9 | TDS- HCO3– | 0.8446 | 0.7133 | 0.6314 | 0.3983 | 82.31 | HCO3– =0.3983 XTDS +82.31 | 0.01 |
| 10 | F– – Ca+2 | – 0.9154 | 0.8380 | 0.7917 | –14.8803 | 142.76 | Ca+2 = –14. 8803X F– +142.76 | 0.00 |
| 11 | F– – Mg+2 | – 0.8905 | 0.7930 | 0.7339 | – 6.2280 | 59.48 | Mg+2= – 6.228 X F– + 59.48 | 0.00 |
| 12 | Mg+2– Ca+2 | 0.9923 | 0.9847 | 0.9803 | 2.3064 | 2.41 | Ca+2 = 2.3064 X Mg+2+ 2.41 | 0.00 |
| 13 | Cl–– Na+ | 0.8779 | 0.7707 | 0.7052 | 1.7967 | – 42.39 | Na+= 1.7967 XCl–– 42.39 | 0.00 |
| 14 | SO4–2 – NO3– | 0.8720 | 0.7604 | 0.6920 | 1.6956 | –1.23 | NO3– = 1.6956 X SO4–2 –1.23 | 0.00 |
Table 6: Percentage error of the pairs of parameters having highly significant correlation coefficients (0.8<R<1.0) of groundwater of Fatehpur.
| S.
No. |
Pairs of parameters | Independent variable | Dependent variable | X value | Y (observed) | Y (predicted) | % error |
| 1 | EC-TA | EC | TA | 1508.50 | 482.40 | 482.39 | 0.002 |
| 2 | EC-TDS | EC | TDS | 1508.50 | 1001.70 | 1001.75 | –0.005 |
| 3 | EC- HCO3– | EC | HCO3– | 1508.50 | 481.28 | 481.30 | –0.004 |
| 4 | TDS-TA | TDS | TA | 1001.70 | 482.40 | 482.38 | 0.004 |
| 5 | TA- HCO3– | TA | HCO3– | 482.40 | 481.28 | 481.24 | 0.008 |
| 6 | F–– TH | F– | TH | 6.11 | 217.80 | 217.82 | –0.009 |
| 7 | Ca+2 – TH | Ca+2 | TH | 51.84 | 217.80 | 217.80 | 0.000 |
| 8 | Mg+2 – TH | Mg+2 | TH | 21.43 | 217.80 | 217.79 | 0.005 |
| 9 | TDS- HCO3– | TDS | HCO3– | 1001.70 | 481.28 | 481.29 | –0.002 |
| 10 | F– – Ca+2 | F– | Ca+2 | 6.11 | 51.84 | 51.84 | 0.000 |
| 11 | F– – Mg+2 | F– | Mg+2 | 6.11 | 21.43 | 21.43 | 0.000 |
| 12 | Mg+2– Ca+2 | Mg+2 | Ca+2 | 21.43 | 51.84 | 51.84 | 0.000 |
| 13 | Cl–– Na+ | Cl– | Na+ | 134.02 | 198.40 | 198.40 | 0.000 |
| 14 | SO4–2 – NO3– | SO4–2 | NO3– | 17.93 | 29.17 | 29.17 | 0.000 |
Table 7: Regression equation for pairs of parameters having moderate significant correlation coefficients (0.6<R<0.8) of groundwater of Fatehpur.
| S.
No. |
Pairs of Parameters | R value | R2 | Adj. R2 | Regression Coefficients | Regression Equation Y = ax + b | Sig. | |
| a | b | |||||||
| 1 | TA – pH | – 0.6952 | 0.4833 | 0.3357 | – 0.0044 | 10.33 | pH = – 0.0044 X TA + 10.33 | 0.01 |
| 2 | HCO3– – pH | – 0.6874 | 0.4725 | 0.3218 | – 0.0045 | 10.36 | pH = –0.0045XHCO3– +10.36 | 0.00 |
| 3 | EC – Cl– | 0.6706 | 0.4497 | 0.2925 | 0.0876 | 1.95 | Cl–= 0.0876 X EC + 1.95 | 0.07 |
| 4 | EC – Na+ | 0.7085 | 0.5020 | 0.3597 | 0.1893 | – 87.14 | Na+= 0.1893 X EC – 87.14 | 0.02 |
| 5 | Cl– – TA | 0.6099 | 0.3720 | 0.1926 | 1.4539 | 287.55 | TA= 1.4539 X Cl– + 287.55 | 0.00 |
| 6 | Na+– TA | 0.7759 | 0.6020 | 0.4883 | 0.9039 | 303.07 | TA= 0.9039 X Na+ + 303.07 | 0.00 |
| 7 | TDS – Cl– | 0.6711 | 0.4504 | 0.2934 | 0.1364 | – 2.60 | Cl– = 0.1364 X TDS – 2.60 | 0.01 |
| 8 | TDS – Na+ | 0.7071 | 0.5000 | 0.3572 | 0.2941 | – 96.21 | Na+ = 0.2941 X TDS – 96.21 | 0.01 |
| 9 | F– – Cl– | 0.6712 | 0.4505 | 0.2935 | 19.806 | 13.00 | Cl– = 19.806X F– + 13.00 | 0.01 |
| 10 | Cl– – HCO3– | 0.6045 | 0.3654 | 0.1841 | 1.4027 | 293.28 | HCO3–=1.4027XCl– +293.28 | 0.01 |
| 11 | Na+– HCO3– | 0.7737 | 0.5986 | 0.4840 | 0.8772 | 307.24 | HCO3–=0.8772XNa++307.24 | 0.00 |
Table 8: Percentage error of the pairs of parameters having moderate significant correlation coefficients (0.6<R<0.8) of groundwater of Fatehpur.
| S. No. | Pairs of parameters | Independent variable | Dependent variable | X value | Y (observed) | Y (predicted) | % error |
| 1 | TA – pH | TA | pH | 482.40 | 8.19 | 8.20 | –0.122 |
| 2 | HCO3– – pH | HCO3– | pH | 481.28 | 8.19 | 8.19 | 0.00 |
| 3 | EC – Cl– | EC | Cl– | 1508.50 | 134.02 | 134.09 | –0.052 |
| 4 | EC – Na+ | EC | Na+ | 1508.50 | 198.40 | 198.42 | –0.010 |
| 5 | Cl– -TA | Cl– | TA | 134.02 | 482.40 | 482.40 | 0.000 |
| 6 | Na+-TA | Na+ | TA | 198.40 | 482.40 | 482.40 | 0.000 |
| 7 | TDS – Cl– | TDS | Cl– | 1001.70 | 134.02 | 134.03 | –0.007 |
| 8 | TDS – Na+ | TDS | Na+ | 1001.70 | 198.40 | 198.39 | 0.005 |
| 9 | F– – Cl– | F– | Cl– | 6.11 | 134.02 | 134.01 | 0.007 |
| 10 | Cl– – HCO3– | Cl– | HCO3– | 134.02 | 481.28 | 481.27 | 0.002 |
| 11 | Na+– HCO3– | Na+ | HCO3– | 198.40 | 481.28 | 481.28 | 0.000 |
Conclusion
The correlation analysis introduce first rate tool for the prediction of parameters values within a reasonable degree of accuracy. It is also useful in exact measurement of water quality. Present tudy indicates that groundwater of study area is highly contaminated, so de-fluoridation of water is essential to do before its use for drinking.
Acknowledgement
Authors are very thankful to Dr. N. Bhojak Associate Professor (Chemistry), Green Chemistry Research Centre (GCRC), Govt. Dungar P.G. College, Bikaner (Raj.), Dr. B.S. Sharma Senior Scientist, Central Institute of Arid Horticulture (CIAH) and Sh. M.L. Rathi Ex En. (P.H.E.D.) Sikar (Raj.) for his valuable motivational support.
References
- Mote Sudhakar P and Mahajan Hemant A. Physico-Chemical Analysis of Drinking Ground Water in Varangaon Region, Dist. Jalgaon, Maharashtra. Research Journal of Chemical Sciences. 2013;38):83-85.
- Suthar S.,Garg V. K., Jangir S., Kaur S., Goswami N. and Singh S. Fluoride contamination in drinking water in rural habitation of Northern Rajasthan, India. Environ Monit Assess. 2008;145:1-6.
CrossRef - Choubisa S. L.Endemic fluorosis in Southern Rajasthan, India. Fluoride. 2001;34(1):61-70.
- Bhargava Devika and Bhardwaj Nagendra. Study of fluoride contribution through water and food to human popullation in fluorosis endemic villages of North- Eastern Rajasthan. African Journal of Basic & Applied Sciences. 2009;1(3-4):55-58.
- Maanju S. K., Saha K. and Jakhar G. R. Groundwater characteristics of high Fluoride terrain and it’s implication on human health: A case study of Bankapatti area of Nagaur district, Rajasthan.IOSR Journal of Environmental Science, Toxicology and Food Technology. 2013;5(5):33-40.
CrossRef - Mittal Sudhir, Rani Asha and Mehra Rohit. Assessment of heavy metals in correlation with physic-chemical properties of drinking water of Northern Rajasthan, India. International Journal of Pure and Applied Physics. 2017;13(1):102-106.
- APHA. Standard Methods for examination of water and wastewater. 22nd ed. Washington D C: American Public Health Association. 2012;ISBN 978-087553-0130:1360.
- Gajendra C. and Thamarai P. Study on statistical relationship between ground water quality parameters in Nambiyar River Basin, Tamilnadu, India. Pollution Research. 2008;27(4):679-683.
- Jothivenkatachalam K., Nithya A. and Mohan S. C. Correlation analysis of drinking water quality in and around Perur Block of Coimbatore District, Tamilnadu, India. Rasayan Journal of Chemistry. 2010;3(4):649-654.
- Gupta S. P. Statistical Methods.Sultan Chand and Sons, India. 1999;28 thEd..
- Saxena V. K. and Ahmed S. Dissolution of fluoride groundwater a water rock interaction study. Environ Geology. 2001;40:1084-1087.
CrossRef - Sharma S. K. Health hazards due to salinity intrusions in coastal aquifers of India. 18th SWIM 2004: May 31 – June 3, Cartagena, Spain. 2004;9.
- Ramamohana Rao N. V. Suryaprakasa Rao K and Schuiling R D, “Fluoride distribution in waters of Nalgonda District, Andhra Pradesh, India. Environmental Geology. 1993;21:84-89.
CrossRef