

Introduction
Soil properties, especially chemical properties significantly affect the variability of soil productivity and crop production.1 Variations in soil chemical properties are subjected to crop types, management practices, erosion, etc. and the spatial variability is a natural and inevitable characteristic of all soil entities.2-4 The assessment of soil chemical properties and nutrient status over an area becomes a challenge due to their spatial variation across the area.5
A good understanding of the distribution of soil nutrients distribution in soil is required to find out the soil nutrients related production constraints, suggest the remedial measures for optimum production of the crops, and execute appropriate nutrient management strategies. Assessment of spatial variation of soil nutrients provides an opportunity to recognize and outline significant nutrient deficit areas.6
Nepalese agriculture is dominated by small-holder farmers, yet many farmers lack proper assistance in carrying out soil management activities.7 In the arena of production being hit by climate change impacts,8-9 proper soil fertility management options1 can turn out as one important tool to augment sustained agricultural production. Located nearby the capital of Nepal, Kavrepalanchowk district holds immense scope of benefit through appropriate and careful land use practices.Farmers in this district are rapidly adopting commercial and competitive farming practices from traditional agriculture. The use of agro-chemicals as fertilizer or pesticides has been increasing in recent days. This has been increased exploitation of land for meeting the market demand and ultimately reducing the crop productivity and soil fertility.10
Considering importance and need of soil fertility management, many efforts are being carried out through the government and non-government organizations, including testing of soils at random locations from farmers’ field and providing the recommendation to farmers based on soil test results. Recently in 2017, the Soil Management Directorate of the Ministry of Agriculture Development has launched a soil testing mobile van program in Kavrepalanchowk district. The program has paved the way for farmers to have their soil samples tested for better soil fertility management at their doorsteps.7 However, a relevant study on the overall distribution of soil nutrients in the district is still not satisfactory.
A study on the identification and classification of soil nutrient status based on its spatial variability can be beneficial for sustainable soil fertility management. Therefore, a case study was carried out with an objective of assessing spatial variability of soil chemical properties of agricultural land of the central part of Kavrepalanchowk district. The findings of the study may be an important resource in designing soil fertility improvement strategies and shaping a productive and sustainable agricultural plan.
Materials and Method
Study Area
This study was carried out in Namobudhha municipality of Kavrepalanchowk district, a part of Province number 3, and situated in the central mid-hills of Nepal (Figure 1). The study area was selected to best represent the agricultural potential area with varied climatic and topographic conditions nearby the capital of the country. The district is around 32 kilometers far from Kathmandu, the capital city of Nepal. The altitude of the study area ranges from 800-1700 m above the sea level. It falls under sub-tropical to a mild temperate climate. The climate is characterized by monsoon rainfalls from June to September, which on average account for 80% of the total annual rainfall (1312 mm) and an average maximum temperature of 23.1°C and an average minimum temperature of 11.9 °C.11-12
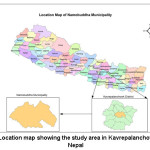 |
Figure 1: Location map showing the study area in Kavrepalanchowk district, Nepal Click here to View figure |
Agriculture is the main income source of majority of households in the study area and is characterized by subsistence mixed crop-livestock farming. Commercial agro-farms can be seen at some locations and its number is growing in recent years. Around 43.8% of the land in this area is under agricultural use.12 Farmers grow rice (Oryza sativa L.), maize (Zea mays L.), wheat (Triticum aestivum L.), oilseeds, vegetables, and potato (Solanum tuberosum L.). Rice-maize and maize-potato-wheat are the major cropping systems. The majority of the study area is dominated by silt loam soils.
Soil Sampling and Analysis
Soil samples from the surface of agricultural land (0 to 15 cm depth) were collected in February 2018. The study area was delineated into several polygons on map and a total of 35 soil samples were collected (one sample per polygon). The soil sampling location within a polygon was selected randomly to best represent the land under agricultural use and every sampling location was located using a global positioning system (GPS). After bagging and labeling, the collected soil samples were sent to the laboratory for analysis of pH, total organic carbon (TOC), total nitrogen (N), available phosphorus (P), and available potassium (K). The soil nutrient content and reaction were analyzed by following standard laboratory procedures described by Panday et al.1
Data Analysis
Descriptive statistics (mean, standard deviation, standard error, coefficient of variation or CV, minimum, maximum, skewness or skew, and kurtosis) for soil parameters were analyzed using Statistix 10. Soil pH values were classified as: highly acidic (<4.5), acidic (4.5 to 5.5), slightly acidic (5.5 to 6.5), neutral (6.5 to 7.5), and alkaline (>7.5). Ratings for other nutrient values (TOC, TN, P, and K) were based on standards recommendation followed by Soil Management Directorate, Department of Agriculture, Nepal and are presented in Table 1 (adapted from Panday et al.,1). The guidelines provided by Warrick13 for the variability of soil properties was used to classify the different soil chemical properties as highly variable (CV> 35%), moderately variable (CV= 15–35%) and least variable (CV< 15%) classes. Correlation analysis was carried out among the soil chemical properties to know their relationship with each other at significant (p<0.05) level.
Table 1: Ranges and respective values for pH and nutrients (TOC, TN, P, and K) based on standards recommendation followed by Soil Management Directorate, Department of Agriculture, Nepal.
| Range | TOC (%) | TN (%) | P (kg ha-1) | K (kg ha-1) |
| Very high |
>5.81 |
>0.4 |
>47.83 |
>416.67 |
| High |
2.91 to 5.81 |
0.2 to 0.4 |
23.91 to 47.83 |
233.33 to 416.67 |
| Medium |
1.45 to 2.91 |
0.1 to 0.2 |
13.04 to 47.83 |
91.67 to 233.33 |
| Low |
0.58 to 1.45 |
0.05 to 0.1 |
4.35 to 13.04 |
45.83 to 91.67 |
| Very low |
<0.58 |
<0.05 |
<4.35 |
<45.83 |
Results and Discussion
Summary Statistics of Soil Variability
The summary statistics for selected soil chemical properties from the study area is shown in Table 2. The variability in soil chemical properties was interpreted using the CV. As suggested by CV varying from 9.37% to 98.81% (Table 2), a wide range of variation was observed for the soil properties of the study area.
The pH value of the soil varied between 5.3 and 7.7 with a mean value of 6.3 suggesting slightly acidic soil. The differences in the pH could be ascribed to the nature of parent material, micro-topography, and type of fertilizer used.6 The pH range close to the neutral range implies optimal availability of mineral nutrients for most crops.14 The higher acidity in some locations may be due to the influence of acid-forming nitrogen fertilizer uses, loss of major cations because of higher precipitation, and higher nutrient uptake accompanied by lower nutrient replenishment.1,7,15 In most cases, the farmers are using higher rates of fertilizers than recommended, especially the nitrogenous fertilizers, aiming to achieve higher growth and production of crops. Applications of N-based fertilizers are reported to be an important factor affecting soil pH.16
The range of TOC was from 0.13% to 2.76% with a mean value of 1.01% (Table 2) indicating lower TOC content in the majority of soils. The low organic carbon content was possibly due to very low organic manure application,17 the erosion of topsoil, high organic matter (OM) breakdown rate resulted from continuous cultivation without sufficient renewal of OM6, ,18-19and limited nutrient return to the soil from crop residues because of their competing use as animal feed.7 With the decrease in OM content in soil, the available N, P, K, and some nutrients also decrease.20-21
Total nitrogen (N) content varied between 0.03% and 0.67% and the mean value was 0.14% (Table 2) implying the medium N content in the soil. The medium N content could be due to the sufficient use of N-fertilizers provided with its easy availability in the study area. The lower N content at some locations could be due to low OM content, higher mineralization rate and inadequate application of nitrogenous fertilizer to major nutrient-exhausting crops like wheat and maize.22,6
The phosphorus (P) content varied from 1.32 kg ha-1 to 30.53 kg ha-1and the mean value was 6.13 kg ha-1 (Table 2). This indicates a low status of Pin the study area. Lower P content might be due to greater P-loss associated with erosion and runoff.23 Also, the deficit of P in neutral to slightly acidic soils of the study area may be due to their innate low P status, low organic matter, etc.24 Adequate application of P fertilizers together with practices like liming acidic soils, increasing organic matter content in soil and taking measures to reduce erosion and runoff can enhance the content and availability of P.25
Potassium (K) content varied from 25.47 kg ha-1 to 170.47 kg ha-1 with a mean value of 71.43 kg ha-1 (Table 2) indicating low content in the soil from study area. The straw and stalk of all kinds of crops contain a good amount of K26 and the same amount of K will be removed by them from soil if they are not returned. The existing practice of crop residues removal could be the reason for low K content in the study area. Further, poor cation exchange capacity, higher hydraulic conductivity, possible nutrient losses, and insufficient supply rate could explain the low K content.1,6
All of the selected soil properties showed positive skew indicating the concentration of their values at the lower end of the distribution range. In addition, the correlation between selected soil chemical properties demonstrated a significant relationship between pH and TOC (r2= 0.16, p<0.01) indicating the influence of pH on TOC (Table 3).
Table 2: Summary statistics for selected soil chemical properties of the study area in Kavrepalanchowk district of Nepal (N=35).
|
pH |
TOC |
TN |
P |
K |
|
|
(%) |
(kg ha-1) |
||||
| Mean |
6.3 |
1.01 |
0.14 |
6.13 |
71.43 |
| SD |
0.59 |
0.50 |
0.14 |
5.82 |
41.09 |
| SE |
0.10 |
0.09 |
0.02 |
0.98 |
6.95 |
| C.V. |
9.37 |
49.94 |
98.81 |
94.89 |
57.53 |
| Minimum |
5.3 |
0.13 |
0.03 |
1.32 |
25.47 |
| Maximum |
7.7 |
2.76 |
0.67 |
30.53 |
170.47 |
| Skew |
0.57 |
0.99 |
2.42 |
2.49 |
0.90 |
| Kurtosis |
-0.06 |
2.52 |
5.25 |
7.22 |
-0.05 |
Table 3: Correlation coefficient (r) between selected soil chemical properties of the study area in Kavrepalanchowk district of Nepal.
|
pH |
TOC |
TN |
P |
K |
|
| pH |
1 |
||||
| TOC |
0.40** |
1 |
|||
| TN |
0.09 |
0.23 |
1 |
||
| P |
-0.31 |
0.01 |
0.09 |
1 |
|
| K |
0.24 |
0.56 |
-0.01 |
-0.22 |
1 |
**Correlation is significant at p<0.01 level
Variability of Soil Nutrients
Results show that soil pH was the least variable (CV= 9.37 % and skew= 0.57) among the analyzed soil samples while total nitrogen was the most variable (CV= 98.81%). The low variability of pH could be attributed to its stable nature in general.27 Previous studies carried out at the different location of the country28-29 have also indicated the lower variability of pH among the soil samples.
Other selected properties (TOC, P and K) were found to be highly variable (CV for TOC = 49.94%, CV for P = 94.89%, and K = 57.53%). These variations in the soil parameters could be the result of soil forming processes impacted by the micro-topographical variations,30 different soil management practices carried out in the study area, and the role of irrigation water quality.31 The observed values of CV are in-line to the results of Pandey et al.,7 who reported similar CV for pH (10.8%), N (57.11%), TOC (57.11%), P (76.63%), and K (93.49%) in Banepa Municipality of Kavrepalanchowk district of Nepal and Khadka et al.,32 who also reported similar CV for pH (8.05%), TOC (49.33%), P (68.08%), and K (59.82%) at a research field in the hilly region of eastern part of Nepal.
Conclusion
The study showed that the content of the soil nutrients (TOC, P, and K) was low with the exception of N. Further, spatial variability assessment provided a portrait of soil nutrients distribution over the study area. The higher variability of other soil chemical properties (TOC, N, P, and K) was observed while soil pH showed lower variability. The findings of the study suggest various soil and nutrient management practices to be carried out for triple benefits of good soil health, enhanced productivity and reduced cost for fertilizers. Considering the low status of soil organic matter, proper nutrient management practices like suitable crop rotation, optimum manure or compost incorporation, crop residue retention, green manuring, mulching etc. can be suggested for its improvement. The practice of crop rotation with the inclusion of nitrogen-fixing crops like legumes (peas, beans, etc.) along with the use of the recommended dose of fertilizers could be beneficial for enhanced production and soil health. Further, balanced and judicious use of fertilizers based on the fertility status of the soil is suggested to the farmers.
Acknowledgements
Funding for this study was supported by National Land Use Project under the Ministry of Land Reform and Management, Nepal and is highly acknowledged. The authors express special thanks to the colleagues who helped during data collection and Bikesh Twanabasu for technical support for study map during the preparation of the manuscript.
References
- Panday D., Maharjan B., Chalise D., Shrestha R. K., Twanabasu B. Digital Soil Mapping in the Bara District of Nepal using Kriging Tool in ArcGIS. PLoS ONE 2018. DOI: https://doi.org/10.1371/journal.pone.0206350.
CrossRef - Campbell J. Spatial Variability of Soils. Annals of the Association of American Geographers. 1979;69(4): 544-556. Available online: http://www.jstor.org/stable/2563128 (accessed on 05 October 2018).
CrossRef - Weiwen Q., Denis C., Paul J., Mike B., Guillermo H. R. Small-Scale Spatial Variability of Plant Nutrients and Soil Organic Matter: An Arable Cropping Case Study, Communications in Soil Science and Plant Analysis.2016;47 (19): 2189-2199. DOI: 10.1080/00103624. 2016.1228945.
- Sun B., Zhou S., Zhao Q. Evaluation of spatial and temporal changes of soil quality based on geostatistical analysis in the hill region of subtropical China, Geoderma. 2003;115(1-2):85-99.
CrossRef - Khadka D.,Lamichhane S., Khan S., Joshi S., Pant B. B. Assessment of Soil Fertility Status of Agriculture Research Station, Belachapi, Dhanusha, Nepal. Journal of Maize Research and Development. 2016;2(1):43-57. DOI: http://dx.doi.org/10.3126/jmrd.v2i1.16214.
CrossRef - Vasu D., Singh S. K., Sahu N.,Tiwary P., Chandran P.,Duraisami V. P., Ramamurthy M. L., Kalaiselvi B. Assessment of spatial variability of soil properties using geospatial techniques for farm level nutrient management. Soil and Tillage Research.2017;169:25–34. DOI: 10.1016/j.still.2017.01.006.
CrossRef - Pandey S., Bhatta N. P., Paudel P., Pariyar R., Maskey K. H., Khadka J., Thapa T. B., Rijal B., Panday D. Improving Fertilizer Recommendations for Nepalese Farmers with the Help of Soil-Testing Mobile Van. Journal of Crop Improvement.2018;32(1): 19–32. DOI: 10.1080/15427528.2017.1387837.
CrossRef - Ghimire D., Panday D. Interconnection of Climate Change, Agriculture and Climate Justice: Complexities for Feeding the World under Changing Climate. Development. 2016;59(3–4):270–273. DOI: 10.1057/s41301-017-0118-5.
CrossRef - Panday D. Adapting climate change in agriculture: The sustainable way in Nepalese context. Hydro Nepal Special Issue: Conference Proceedings.2012; 91–94.DOI: http://dx.doi.org/10.3126/hn.v11i1.7222.
CrossRef - Subedi R., Bhatta L. D., Joshi K. D., Agrawal N. K., Panday D. Effect of Green Manuring, Jholmal, and Mulching Practices on Crop Yields and Soil Properties in Mid-hills of Nepal. Under Review.
- D. H. M. Observed Climate Trend Analysis in the Districts and Physiographic Regions of Nepal (1971-2014). Department of Hydrology and Meteorology, Kathmandu, Nepal. 2017. Available online: http://www .dhm.gov.np/uploa ds/climat ic/467608975Observed%20C limate%20Trend%20Analysis%20Repo rt_2017_Final.pdf (accessed on 20 October 2018).
- CBS. District Profile: Kavrepalanchowk 2074. Central Bureau Statistics, Dhulikhel, Kavrepalanchowk, Nepal. 2018. Available online: http://cbs.gov.np/image/data/2018/District_Profile_kavrepalanchok_2074.pdf (accessed on 20 October 2018).
- Warrick A. W. Spatial variability. In: D. Hillel, ed.Environmental soil physics. Cambridge, MA. Academic Press. 1998:655-675.
- Sanchez P. A., Palm C. A., Boul S. W. Fertility capability classification: A tool to help assess soil quality in the tropics. Geoderma. 2003;114:157-185.
CrossRef - Ghimire R., Bista P. Crop diversification improves pH in acidic soils. Journal of Crop Improvement.2016;30 (6):657–667. DOI: 10.1080/15427528.2016.1219894.
CrossRef - Goulding K. W. T. Soil Acidification and the Importance of Liming Agricultural Soils with Particular Reference to the United Kingdom. Soil Use Manag. 2016;32(3):390–399.
CrossRef - Bishwakarma B. K., Dahal N. R., Allen R., Rajbhandari N. P., Dhital B. K., Gurung D. B., Baillie I. C. Effects of improved management and quality of farmyard manure on soil organic carbon contents in small-holder farming systems of the middle hills of Nepal. Climate and Development. 2014;7(5):426–436. DOI: 10.1080/17565529.2014.966045.
CrossRef - Laekemariam F., Kibret K., Mamo T., Gebrekidan H. Soil–Plant Nutrient Status and their Relations in Maize-Growing Fields of Wolaita Zone, Southern Ethiopia. Communications in Soil Science and Plant Analysis. 2016;47(11):1343–1356. DOI: 10.1080/00103624.2016.1166378.
CrossRef - Negasa T., Ketema H., Legesse A., Sisay M., Temesgen H. Variation in soil properties under different land use types managed by smallholder farmers along the toposequence in southern Ethiopia. Geoderma. 2017;290:40–50. DOI: 10.1016/j.geoderma.2016.11.021.
CrossRef - Wang J., Raman H., Zhang G., Mendham N., Zou M. Aluminium tolerance in barely (HoridiumvulgarieL.): Physiological mechanisms, genetics and screening methods. Journal of Zhejiang University Science.2006; 7: 769-787.
CrossRef - Oates J. Lime and limestone: chemistry and technology, production and uses. 1998. ISBN 3-527-29527-5. DOI: 10.1002/9783527612024.
CrossRef - Goovaerts P. Geostatistics in soil science: State-of-the-art and perspectives. Geoderma.1999;89(1–2):1–45. DOI: 10.1016/S0016-7061(98)00078-0.
CrossRef - Soil Phosphorous: Soil quality kit – Guides for educators. Available online: https:// www.nrcs .usda.gov /Internet /FSE_DOCUMENTS/nrcs142p2_053254.pdf (accessed on 22 October 2018)
- Sanyal S. K., Datta S. K. D. Chemistry of phosphorous transformations in soil. Advances in Soil Science.1991;16:1-119.
CrossRef - Sharpley A., Foy B., Withers P. Practical and Innovative Measures for the Control of Agricultural Phosphorus Losses to Water: An Overview. Journal of Environment Quality. 2000;29(1).
CrossRef - Grimes D. W. An Evaluation of the Availability of Potassium in Crop Residues. Doctor of Philosophy Dissertation, Iowa State University of Science and Technology, Ames, Iowa, 1996. Available online: https://lib.dr.iastate.edu/rtd/2860 (accessed on 31 October 2018).
- Bouma J., Pinke P. A. In: Robert P.C., Rust R. H., Larson W. E., eds. Soil Specific Crop Management. ASA, CSSA, SSSA, Madison, WI. 1993:207.
- Khadka D., Lamichhane S., Bhurer K. P., Chaudhary J. N., Ali M. F., Lakhe L. Soil Fertility Assessment and Mapping of Regional Agricultural Research Station, Parwanipur, Bara, Nepal. Journal of Nepal Agricultural Research Council.2018;4:33-47. DOI: https://doi.org/10.3126/jnarc.v4i1.19688.
CrossRef - Khadka D., Lamichhane S., Shrestha K., Joshi S., Karna M., Pant B. B., Yadav S. Soil Fertility Assessment and Mapping of Agricultural Research Station, Jaubari, Illam, Nepal. International Journal of Environment.2017;6(3):46-70. DOI: http://dx.doi.org/10.3126/ije.v6i3.18097.
CrossRef - Vasu D., Singh S. K., Tiwary P., Chandran P., Ray S. K., Duraisami V. P. Pedogenic processes and soil-landform relationships for identification of yield limiting properties. Soil Research. 2016;55: 273-284. DOI: 10.1071/SR16111.
CrossRef - Al-Atab S. M. S. Variations of soil properties and classification in some area of Basrah Governorate. PhD Thesis, College of Agriculture, University of Basrah, Basrah, 2008.
- Khadka D., Lamichhane S., Bhantana P., Ansari A. R., Joshi S., Baruwal P. Soil Fertility Assessment and Mapping of Chungbang Farm, Pakhribas, Dhankuta, Nepal. Adv Plants Agric Res. 2018;8(3):219‒227. DOI: https://doi.org/10.15406/apar.2018.08.00317.
CrossRef