

Introduction
Wheat (Triticum spp.) is the second important food crop after rice worldwide.1,2 It provides 20% of the calories and protein for the global population.3 Plant genetic diversity decides their prospective competence and uses for breeding, to enhance and improve food production.4 The existence of genetic diversity and variability play a crucial role in formulating a tangible and successful breeding programme. Genetic diversity is indispensable to convene the diversified target of plant breeding such as breeding for increasing yield, wider adaptation, desirable quality, pest and disease resistance.5 At various international research centers around the globe wheat breeders are working for the improved grain yield with better quality along with important agronomic traits, hence the information of the genetic diversity within a germplasm collection has a significant impact for crop improvement and vital for development of wheat varieties resilient to climate change and diverse environment.Hybridization and subsequent selection are one of the most successful approaches utilized for wheat breeding.6 The baseline strategy in any breeding programme depends primarily on the target trait and subsequent choice of parents to be involved under hybridization programme. Transgressive segregation can be helpful when parents used in hybridization are genetically dissimilar.7 The genetic distance between parents is directly proportional to the extent of heterosis found in progenies.8 Experiments on genetic variability provide a base of information regarding trait wise variation in the experimental material. Correlation studies helps to quantify and evaluate the proportion of the phenotypic correlation associated with genetic backgrounds, to investigate whether the selection for a particular trait affects more traits, to examine indirect gains due to selection on correlated traits, and to dissect the complexity of the traits. Therefore, keeping in mind the above facts, we investigated the extent of genetic variability present in a set of bread wheat genotypes for various traits and the phenotypic correlation coefficients between yield and component traits.
Materials and Methods
Twenty four bread wheat (Triticum aestivum L.) genotypes from the Indian Institute of Wheat and Barley Research (IIWBR), Karnal under the All Indian Coordinated Wheat Improvement Project were used in this investigation (Table 1).
Table 1: Details of wheat genotypes used in the present investigation.
|
Genotype |
Pedigree |
|
HS631 |
WHEAR/VIVITSI//WHEAR |
|
HS632 |
HS240*2/FLW20(LR19)//HS240*2/FLW13(YR15) |
|
HS633 |
HS240*2/FLW20(LR19)//HS240*2/FLW13(YR15) |
|
HS634 |
PBW343*2/KUKUNA/5/CNO79//PF73054/MUS/3/PASTOR/4/BAV92 |
|
HS635 |
PFAU/MILAN/5/CHEN/AE.SQUARROSA(TAUS)//BCN/3/VEE#7/BOW/ 4/PASTOR |
|
HS636 |
PASTOR//KAUZ/6/CNDO/R143//ENTE/MEX1- 2/3/AEGILOPSSQUARROSA(TAUS)/4/WEAVER/5/2*KAUZ |
|
HS637 |
PRL/2*PASTOR |
|
HPW441 |
NAC/TH.AC//3*MIRLO/BUC/4/PASTOR |
|
HPW442 |
LONG291*2/PASTOR |
|
HPW443 |
PASTOR//HXL7573/2*BAU/3/SOKOLL/WBLL1 |
|
HPW444 |
AZAR2/4/CROC_1/AE.SQUARROSA(205)//BORL95/3/2*MILAN/5/BERKUT |
|
HPW445 |
PBW575/HPW251 |
|
HPW446 |
BOW/URES//KEA/3/SITE |
|
HPW447 |
HPW266/HPW249 |
|
VL2025 |
LBPY04-1/RAJ4132//HS490 |
|
VL2026 |
GW366/KS82W428/SWM75740//UP2739 |
|
VL2027 |
RAJ4083/SKAUZ/HATUSA//VL900 |
|
VL2028 |
FRANCOLIN#1*2/MUU |
|
VL2029 |
MUNAL#1/FRANCOLIN#1 |
|
VL2030 |
KA/NAC//TRCH/3/DANPHE#1 |
|
UP2990 |
UP2744/WL711//PBW644 |
|
UP2991 |
SOKOLL/3/PASTOR//HXL7573/2*BAU/4/SOKOLL/WBLL1 |
|
VL907 |
DYBR1982-83842ABVD50/VW9365//PBW343 |
|
HS507 |
KAUZ/MYNA/VUL//BUC/FLK(4/MILAN |
These were sown and evaluated under rainfed condition during rabi season of 2016-17, in a randomized complete block design with three replications with the plot size of 3.5×1.2 m at the experimental field at Mountain Research Centre for Field Crops, (MRCFC) Khudwani an out-campus research centre of Sher-e-Kashmir University of Agricultural Sciences & Technology of Kashmir (SKUAST-Kashmir) situated in temperate climatic regime of Jammu and Kashmir, (India). The geophysical coordinates of the location fall between 34° N latitude and 74° E longitude at an altitude of 1560 m above mean sea level. The observations were recorded on diverse morpho-physiological and yield attributing traits, viz., Days to heading, days to maturity, plant height (cm), 1000 grain weight (g), biological yield (Kg/plot) and yield (Q/Ha) per hectare for conducting genetic diversity analysis. Recommended package of practices was followed to raise the crop. Analysis of variance (ANOVA) and mean comparison were performed using SAS ver. 9.1.9 Descriptive statistics and correlation analysis were performed Using SPSS Ver. 23.10 Cluster analysis and PCA was performed using R,11 PAST12 and STAT graphics Ver. XVII.13
Results
Analysis of Variance and Mean Comparison
The analysis of variance revealed (Table 2) significant difference in all the investigated traits. The phenotypic values for days to heading ranged from (175-190) days as observed in case of wheat genotypes HPW446 and VL2025 (190 days) and HPW447 (175 days), respectively (Table 3 and Table 4). The experimental set exhibited a significant genetic variability for days to maturity as wheat genotypes VL2026 and HPW441 matured in 226 days whereas, VL2029 matured in 219 days (Table 3 and Table 4). HS635 was the tallest (130 cm) and HPW447 and VL2025 were the shortest (93 cm) genotype with respect to plant height. For the trait, 1000 grain weight, UP2991 and UP2990 had the highest value (42 g) and VL907 and HPW447 had the lowest value (37.5 g). It was also observed that HS631 and HS633 recorded the highest value (4.7 kg/plot) and HPW446 had the lowest value (3.02 kg/plot) for the biological yield (Table 3 and Table 4).
Table 2: ANOVA for Quantitative Traits.
| MS | |||||||
| Source of variation | df | Days to Heading | Days to Maturity | Plant Height (cm) | 1000 Gr. Wt. (gm) | Biol. Yield (kg/plot) | Yield (Q /Ha) |
| Block |
3 |
16.01** |
15.36** |
16.00** |
16.01** |
0.009ns |
2.63ns |
| Genotype |
23 |
67.71** |
14.26** |
268.51** |
9.01** |
0.62** |
41.18** |
| Error |
69 |
0.01 |
0.027 |
0.001 |
0.051 |
0.16 |
5.93 |
| CV (%) | – | 0.012 | 0.075 | 0.01 | 0.57 | 10.15 | 8.59 |
Table 3: Descriptive Statistics of Studied Traits.
|
|
Days to Heading |
Days to Maturity |
Plant Height (cm) |
Biol. Yield (kg/plot) |
1000 Gr. Wt. (g) |
Yield (Q/Ha) |
| Mean |
185.333 |
222.500 |
104.783 |
3.98 |
39.483 |
28.35 |
| S.E (Mean) |
.8398 |
.3854 |
1.6724 |
0.080 |
0.3136 |
0.65 |
| Median |
186.500 |
223.000 |
103.200 |
3.98 |
38.900 |
28.56 |
| Mode |
186.0a |
223.0 |
101.6 |
3.017a |
38.9a |
20.39a |
| Std. Deviation |
4.1143 |
1.8882 |
8.1931 |
0.39 |
1.5364 |
3.20 |
| Variance |
16.928 |
3.565 |
67.127 |
0.155 |
2.361 |
10.295 |
| Skewness |
-1.351 |
0.085 |
1.340 |
-0.355 |
0.471 |
-.0398 |
| S.E (Skewness) |
0.472 |
0.472 |
0.472 |
0.472 |
0.472 |
0.472 |
| Kurtosis |
0.969 |
-0.559 |
3.244 |
0.316 |
-1.005 |
0.625 |
| S.E (Kurtosis) |
0.918 |
0.918 |
0.918 |
0.918 |
0.918 |
0.918 |
| Range |
15.0 |
7.0 |
38.4 |
1.67 |
5.0 |
14.76 |
| Minimum |
175.0 |
219.0 |
92.0 |
3.02 |
37.5 |
20.39 |
| Maximum |
190.0 |
226.0 |
130.4 |
4.68 |
42.5 |
35.16 |
| Phenotypic CV% |
2.22 |
0.85 |
7.82 |
9.80 |
3.89 |
11.29 |
Table 4: Mean Comparison of Quantitative Traits in the Studied Genotypes.
|
Name of Line |
Days to Heading |
Days to Maturity |
Plant Height (cm) |
1000 Gr. Wt. (g) |
Biol. Yield (kg/plot) |
Yield/(QHa) |
|
HS631 |
182g |
222 |
101.8 |
40.4 |
4.69 |
31.47 |
|
HS632 |
186e |
223 |
103.6 |
41.5 |
4.02 |
28.64 |
|
HS633 |
178i |
221 |
106.4 |
39.6 |
4.65 |
30.96 |
|
HS634 |
187d |
222 |
110 |
41.5 |
4.39 |
25.60 |
|
HS635 |
188c |
220 |
130.4 |
38.9 |
3.84 |
25.96 |
|
HS636 |
189b |
224 |
114.6 |
38.4 |
4.18 |
29.53 |
|
HS637 |
188c |
223 |
118.4 |
40.5 |
3.49 |
20.40 |
|
HPW441 |
186e |
226a |
106 |
38.5 |
3.88 |
23.98 |
|
HPW442 |
187d |
221 |
103.4 |
41.5 |
4.24 |
31.86 |
|
HPW443 |
186e |
224 |
101.6 |
38.4 |
4.26 |
30.73 |
|
HPW444 |
187d |
223 |
101.2 |
40.5 |
3.94 |
26.24 |
|
HPW445 |
177j |
223 |
96.4 |
37.9 |
4.27 |
28.50 |
|
HPW446 |
190a |
224 |
106.8 |
38.6 |
3.02 |
23.78 |
|
HPW447 |
175k |
221 |
92 |
37.5 |
4.11 |
35.16 |
|
VL2025 |
190a |
222 |
92.8 |
40.6 |
3.43 |
25.47 |
|
VL2026 |
187d |
226a |
102 |
37.8 |
3.88 |
28.84 |
|
VL2027 |
188c |
225b |
105.2 |
39.4 |
4.24 |
31.27 |
|
VL2028 |
186e |
223 |
107.8 |
38.9 |
3.87 |
31.12 |
|
VL2029 |
189b |
219 |
110.8 |
37.6 |
4.04 |
28.33 |
|
VL2030 |
185f |
221 |
98 |
38.9 |
3.57 |
26.80 |
|
UP2990 |
185f |
220 |
102.6 |
42 |
4.38 |
30.51 |
|
UP2991 |
187d |
224 |
98.4 |
42.5 |
3.75 |
27.63 |
|
VL907(C) |
186e |
223 |
101.6 |
37.5 |
3.58 |
29.42 |
|
HS507(C) |
179h |
220 |
103 |
38.7 |
3.81 |
28.34 |
Correlation Analysis
Phenotypic correlation analysis was conducted between different morpho-physiological traits and it was observed that only a few of them exhibited a significant correlation coefficient at 0.01 or 0.05 level of significance (Table 5). It is evident that there is a significant positive correlation for days to heading with plant height (0.40) and a negative correlation between biological yield (-0.45) respectively. It has also been observed that biological yield (kg /plot) and an overall yield are highly correlated (0.619) with each other. The other parameters do not depict any significant correlation with yield traits.
Table 5: Correlations between different Studied Characters.
|
|
Days to Heading |
Days to Maturity |
Plant Height (cm) |
1000 Gr. Wt. (g) |
Biol. Yield (kg/plot) |
Yield Q/ha |
|
Days to Heading |
1 |
|
|
|
|
|
|
Days to Maturity |
0.280 |
1 |
|
|
|
|
|
Plant Height (cm) |
0.406* |
-0.119 |
1 |
|
|
|
|
1000 Gr. Wt. (g) |
0.235 |
-0.109 |
-0.029 |
1 |
|
|
|
Biol. Yield (kg/plot) |
-0.450* |
-0.182 |
-0.036 |
0.172 |
1 |
|
|
Yield Q/ha |
-0.504* |
-0.193 |
-0.390 |
-0.147 |
0.619** |
1 |
Cluster Analysis
Cluster analysis was conducted to assess the quantum of genetic variability within and between the discrete groups based on the index of similarity and dissimilarity as indicated by the genetic distance between them. Distance coefficient between individuals was calculated using the Euclidean square distance method, and different cluster analysis methods like Ward, Nearest, and Fartherest neighbors. Ward method was more efficient and effective in grouping the genotypes that were further cross-validated by using discriminate analysis (Figure 1). Based on the dendrogram (Figure 1), it can be clearly expressed that the wheat genotypes are classified into 4 major groups with distinct phenotypic features. Group I and II are solitarily represented by one distinct genotypes, viz., HS637 and HPW447, respectively. In the third group of wheat genotypes viz. HPW441, HPW444, HPW446, VL2030, HS634, and VL2025 are clustered together based on the minimums classifier value for biological yield. In the fourth group, genotypes have been clustered into two sub-groups. The first sub-group had five (5) and the second had eight (8) genotypes, respectively. These genotypes exhibited highly desirable and significant genetic diversity with respect to diverse morphological and yield attributing traits. For example genotype, HPW 447 dwarf, early maturing and high yielding. Maximum distance was observed between genotypes HS631 and HS637. Minimum distance was observed among genotypes HS631 and UPL2990, respectively.
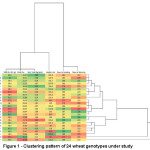 |
Figure 1: Clustering pattern of 24 wheat genotypes under study. |
Principal Component Analysis (PCA)
Figure 2 represents the PCA analysis of standardized log transformed and significantly correlated (at 0.001 level) quantitative phenotypic traits for 24 wheat genotypes. It was observed that the first three main Eigenvalues on the Euclidean similarity matrix explained 45.13, 17.85 and 14.71 percent of the total variation, respectively with a cumulative variance of 77.69 of total phenotypic variation. It is revealed (Table 6) that days to heading, biological yield, and yield/ha contribute significantly to the quantum of variation as explained by principal component 1 (PCA1). In this way, this component is able to serve as a benchmark for ascertaining the efficient pattern of grouping between cultivars based on traits of biological yield so as to distinguish high-yielding cultivars from low-yielding ones. It was further observed that days to maturity, plant height and 1000 grain weight are the main components of the PCA2. The relative length and ordination of phenotypic vectors indicate the contributing quantum of variation to the total variation among the genotypes. It also indicates the potential or significant genotypes having an incremental role with respect to variation in each phenotypic trait / principal component. (Figure 2. & Figure 3).
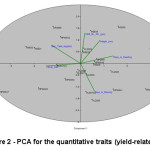 |
Figure 2: PCA for the quantitative traits (yield-related traits) |
Table 6: Percentage of variance, cumulative variance, Eigenvalue and coefficients of indices in the first and second main components.
|
PC |
Eigen value |
% of variance for each PC |
Cum.% of variance for each PC |
Days to Heading |
Days to Maturity |
Plant Height (cm) |
1000 Gr. Wt. (g) |
Biol. Yield (kg/plot) |
Yield Q/Ha |
|
1 |
2.32 |
38.682 |
38.682 |
0.54 |
0.23 |
0.32 |
0.07 |
-0.48 |
-0.57 |
|
2 |
1.25 |
20.829 |
59.511 |
0.15 |
-0.54 |
0.45 |
0.59 |
0.36 |
-0.05 |
|
3 |
1.03 |
17.162 |
76.674 |
0.17 |
0.42 |
-0.54 |
0.70 |
0.09 |
0.03 |
It is evident from Figure 2, that vectors pertaining to days to heading, biological yield and yield/ha are on the opposite direction that indicates the relative importance of these traits with respect to PCA1. Likewise days to maturity, height and 1000 grain weight are on at the opposite end of right that indicates the role of these traits in this component. Positioning / mapping of genotypes in the graph, indicates the tendency of relative grouping into three distinct groups. The ordination was mainly determined by yield related traits on axis one and, to a lesser extent by maturity elated traits on axis two. It is expected that selection of genotypes on the first component can lead to identification of high yield genotypes. Also, selection of genotypes in the second component could lead to identification of early maturing genotypes with appropriate plant height.
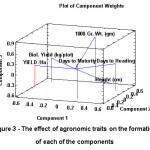 |
Figure 3: The effect of agronomic traits on the formation of each of the components |
Discussion
Phenotypic Correlation Coefficient
‘Significant and correlated response between diverse and desirable morpho-physiological and other yield attributing traits serves as proxy indicators and potential candidate traits in the successful selection of genotypes for achieving a tangible genetic gain, as such these are highly important for improving crop yield and its productivity. The yield of wheat can be predicted if these component traits are functionally modeled such as days to heading, days to maturity, height, 1000 grain weight, biological yield and yield/ha and other yield attributing traits. Since most breeding projects focus on the yield improvement. An effort has been made to identify and introduce the traits that have high genetic heritability and have the greatest effect on the grain yield using the significant correlations as guiding principles between the measured traits and grain yield. It also helps the breeders to conduct indirect selection for important traits using relatively low-importance and easily measurable traits.14 In the breeding programmes, selection is based on a large number of agricultural traits with an assumption that there may be positive and negative correlations between them. Therefore, statistical analyses that reduce the number of effective traits on yield are valuable for breeders. In this regard, the use of correlations between the traits is common, but these correlations do not explain the causal relationship between traits because communications are sustained by a number of unknown factors. Investigating the correlation coefficients between different traits makes it possible to determine the indirect selection indices and removal of ineffective traits more precisely. High correlation can indicate the presence of a genetic linkage or genes with multiple effects (pleiotropy).The existence of such correlations allows the researcher to select genotypes indirectly and more accurately. Biological yield (q/ha) and days to heading have positive correlation with seed yield(q/ha). Plant height and 1000 seed weight shows negative correlation with seed yield (q/ha). Similar results have been reported in earlier studies on wheat 17,18
Principal Component Analysis
Bhanupriya et al.15 used 49 wheat and 2 triticale genotypes to study principal component analysis (PCA) in wheat indicated that five components (PC1 to PC5) accounted for about 75% of the total variation among traits in bread wheat cultivars. Out of total principal components retained PC1, PC2 and PC3 with values of 25.9%, 17.1% and 13.3% respectively contributed more to the total variation. Their study were rightly agree with the present investigation where PC1, PC2 and PC3 45.13%, 17.85 and 14.71% of the total variation, respectively. Similarly, Mohibullah et al.4 studied genetic diversity in wheat (Triticum aestivum L.) germplasm of one hundred found that the eigen values of three PCs out of ten, having 29.02%, 43.42% and 55.00% of the total variability with positive effects for most of the traits. Similar studies were performed in wheat by several researchers.5,16–22 In recent years, a large number of breeding lines have been created in different crops, and the selection of the best one in the regional preliminary experiments is very important. Multivariate statistical methods that can establish a relationship between the characteristics of cultivars can help grouping the cultivars and easily selecting them based on two-dimensional (biplots) and three-dimensional (triplots) diagrams. The principal component analysis, by summarizing the first-order correlated variables in the form of independent and finite components, enables the grouping of individuals in a two-dimensional or three-dimensional space.23 Some researchers have used the principal component analysis method to speed up the selection of genotypes in terms of the traits such as grain yield. Meanwhile, they have also taken advantage of this to reduce the cost of selection.24 In the two-dimensional and three-dimensional diagrams, which are based on the data derived from the principal component analysis, the effect of traits on the grouping of genotypes as different vectors and the location of each genotype is also shown based on the selected component type. The length of each vector represents its weight in creating distinct groups and is related to the component value for the corresponding trait. Genotypes can be compared by drawing a line perpendicular to the vector trait. In fact, the more the distance of the line of origin with the source is greater, the genotype function has a greater deviation than the average performance of the germplasm.25 The angle between the vectors in these types of diagrams depicts their approximate correlation.26 This type of relationship between agronomic traits and related vectors in the formed diagrams, categorizes the studied cultivars logically and directionally. This can be used as a factor in the selection of superior cultivars in the preliminary tests. Principal component analysis is useful for identifying diverse genotypes which can be used for future breeding programmes. In the present investigation first three PCA revealed the variability of 45.13, 17.85 and 14.71 percent respectively with the cumulative variance 77.69 of total phenotypic variance. Similar resuts were also documented in wheat and trticale. 15 The PC1 is containing days to heading,biological yield and seed yield, which are contributing more in the variation. Our results are in agreement with earlier study reported in wheat.16 Similarly PC2 included days to maturity, plant height and 1000 grain weight as main components. These results were also reveled in earlier study on wheat.21
Cluster Analysis
Nimbalkar et al.27 conducted diversity analysis in 24 wheat cultivars for yield and yield contributing characters. The 24 cultivars were grouped into 12 clusters. The highest and lowest intracluster distances were observed in cluster III and I respectively. Dotlacil et al.28 conducted the cluster analysis in 120 accessions of European winter wheat land races and obsolete cultivars. Eight groups of cultivars were identified, one of them was represented by the check cultivars. Very specific clusters 7 and 8 were composed of 14 cultivars from six countries. According to cluster analysis all the accessions were divided into three main groups A, B and C, which were further divided in to thirteen sub-groups.4 The cluster IV and V were more clearly separated than cluster I, II and III. The cluster analysis revealed that considerable variation existed among genotypes that could be implicated in selection of wheat for the development or improvement of cultivars and germplasm.18 Similar clustering patterns were found out in the present study where twenty four wheat genotypes were evaluated for genetic diversity and four groups were formed. Supporting evidence from diverse studies in wheat augment our assertions in the present investigation, which further support the clustering pattern observed among these 24 gentoypes of wheat evaluated under temperate conditions.5,18,21,22In all their studies wheat genotypes were placed in different group according to their genetic similarity. Through these studies we can select diverse genotypes for breeding programme for producing transgressive segregants in minimum period of time. The cluster analysis separated the 24 genotype into five groups based on the genetic variability. Similar results were reported in earlier studies on wheat including 24 and 120 genotypes.27,28
Conclusion
Genetic variability and diversity among the genotypes is a prime requisite for a successful and functional breeding programme. It is this variability, which is explored and exploited through different breeding strategies to bring desirable crop improvement as defined by the niche/ region specific or preference of improvement in the target trait. The developmental programme is further augmented and aided by the identification of desirable parents possessing significant genetic variability for the yield and yield attributing traits. The present investigation revealed presence of significant genetic variability and marginalized candidate wheat genotypes with specific importance for breeding wheat under temperate conditions of the valley. The genotypes were clustered into four distinct groups that showed sufficient variability available in the studied genotypes. The first three PCAs explained 45.13, 17.85 and 14.71 of total phenotypic variation, respectively. Promising genotyping with high yield per hectare and biological yield were identified.
Acknowledgements
We are thankful to ICAR- Indian Institute of Wheat and Barley Research, Karnal for providing funding and Director of Research, SKUAST-K for providing research facility to conduct the trial.
References
- Nishant B., Arun B., Mishra V. K. Genetic Variability, Heritability and Correlation Study of Physiological and Yield Traits in Relation to Heat Tolerance in Wheat (Triticum aestivum L.). Biomedical Journal of Scientific & Technical Research. 2018; 2(1):1-5- DOI : 10.26717/BJSTR.2018.02.000636
- Sharma V., Vaishali., Kumar P., Yadav M. K., Chand P. Assessment of genetic diversity among twenty indian wheat (Triticum aestivum L.) cultivars using simple sequence repeat (SSR) markers. International Journal of Current Microbiology and Applied Sciences. 2018;7(03):1708- 1717. doi: https://doi.org/10.20546/ijcmas.2018.703.202
CrossRef - Braun H. J., Atlin G., Payne T. Multi-location testing as a tool to identify plant response to global climate change. Climate Change and Crop Production. 2010;1:115-138.
CrossRef - Mohibullah M., Rabbani M. A., Waseem K., Javaria S., Ghazanfarullah R. A., Khattak M. I. Estimation of various classifactory analysis in some hexaploid wheat (Triticum aestivum) germplasm. Pakistan Journal of Botany. 2013;45(6):2019-2025.
- Hailegiorgis D., Mesfin M. Genet T. Genetic divergence analysis on some bread wheat genotypes grown in Ethiopia. Journal of Central European Agriculture. 2011;12(2):0-0.
- Bhatt G. Comparison of various methods of selecting parents for hybridization in common bread wheat (Triticum aestivum L.). Australian Journal of Agricultural Research. 1973;24(4):457-464.
CrossRef - Rieseberg L. H., Widmer A., Arntz A. M., Burke B. The genetic architecture necessary for transgressive segregation is common in both natural and domesticated populations. Philosophical Transactions of the Royal Society of London B: Biological Sciences. 2003;358(1434):1141-1147.
CrossRef - Cheres M., Miller J., Crane J., Knapp S. Genetic distance as a predictor of heterosis and hybrid performance within and between heterotic groups in sunflower. Theoretical and Applied Genetics. 2000;100(6):889-894.
CrossRef - SAS S. Institute Inc. SAS/IML Software: Usage and Reference, Version. 2003;6.
- Green S. B.Salkind N. J. Using SPSS for Windows and Macintosh, Books a la Carte. Pearson; 2016.
- Oksanen J. Cluster analysis: tutorial with R. University of Oulu, Oulu. 2010.
- Hammer Ř., Harper D., Ryan P. PAST: Paleontological Statistics Software Package for Education and Data Analysis–Palaeontol. Electron. 4: 9pp. 2001.
- Plus S. 5.1 for Windows, Statistical Graphic Crop.(Rockville, MD). Online Manuals. 2001.
- Bapu J., Pandian G. S. Genotypic association and path analysis in F3 generation of rice crosses. The Madras Agricultural Journal. 1992;11:619-623.
- Bhanupriya B., Satyanarayana N., Mukherjee S., Sarkar K. Genetic diversity of wheat genotypes based on principal component analysis in Gangetic alluvial soil of West Bengal. Journal of Crop and Weed. 2014;10(2):104-107.
- Ajmal S. U., Minhas N. M., Hamdani A., Shakir A., Zubair M., Ahmad Z. Multivariate analysis of genetic divergence in wheat (Triticum aestivum) germplasm. Pakistan Journal of Botany. 2013;45(5):1643-1648.
- Ahmad H. M., Awan S. I., Aziz O., Ali M. A. Multivariative analysis of some metric traits in bread wheat (Triticum aestivum L.). European Journal of Biotechnology and Bioscience. 2014;1(4):22-26.
- Aharizad S. Sabzi M., Mohammadi S. A., Khodadadi E. Multivariate analysis of genetic diversity in wheat (Triticum aestivum L.) recombinant inbred lines using agronomic traits. Annals of Biological Research. 2012;3(5):2118-2126.
- Amin M., Hasan M., Barma N., Rasul M., Rahman M. Genetic diversity analysis in spring wheat (Triricum aestivum L.). Bangladesh Journal of Agricultural Research. 2014;39(2):189-196.
CrossRef - Nielsen N. H., Backes G., Stougaard J., Andersen S. U., Jahoor A. Genetic diversity and population structure analysis of European hexaploid bread wheat (Triticum aestivum L.) varieties. PLoS One. 2014;9(4):e94000.
CrossRef - Khodadadi M., Fotokian M. H., Miransari M. Genetic diversity of wheat (Triticum aestivum L.) genotypes based on cluster and principal component analyses for breeding strategies. Australian Journal of Crop Science. 2011;5(1):17.
- Degewione A., Alamerew S. Genetic Diversity in Bread Wheat (Triticum aestivum L.) Genotypes. Pakistan Journal of Biological Sciences. 2013;16(21):1330.
CrossRef - Falconer D. S. Introduction to quantitative genetics. Oliver And Boyd; Edinburgh; London. 1960.
- Spranaij L., Bos I. Component analysis of complex characters in plant breeding. Euphytica. 1993;79:225-235.
CrossRef - Chapman S. C., Crossa J., Edmeades G. O. Genotype by environment effects and selection for drought tolerance in tropical maize. I. Two mode pattern analysis of yield. Euphytica. 1997;95(1):01-09.
CrossRef - Kroonenberg P. M. Introduction to biplots for G x E Tables. Research Report No 51. 1995.
- Nimbalkar C., Navale P., Biradar A. Generalized D^ 2 and Genetic Diversity in Wheat. Journal-Maharashtra Agricultural Universities. 2002;27(1):43-45.
- Dotlačil L., Hermuth J., Stehno Z., Manev M. Diversity in European winter wheat landraces and obsolete cultivars. Czech Journal of Genetics and Plant Breeding. 2000;36(2):29-36.