
Introduction
Indian mustard is predominantly cultivated in Rajasthan, U.P., Haryana, Madhya Pradesh and Gujarat. It is basically a winter crop and is grown in the rabi season from September- October to February-March. It is sensitive to short-term changes in weather and to seasonal, annual and longer-term variations in climate. Crop growth and yield is influenced by a number of biotic and abiotic stresses. Among abiotic factors, inter seasonal climatic variability is a concern, which is usually reflected in year-to-year fluctuations in crop yields. In the past, research studies have characterized inter annual climatic variability through growth and yield of important crops for this region.2 The objective of the yield forecast is to give a precise, scientific sound and independent forecasts of crop yield as early as possible during the crop growing season by considering the effect of the weather and climate. There are several approaches of yield forecasting like statistical models, remote sensing and crop simulation models. A methodology was developed for large area yield forecast using a crop simulation model and a discrete technology trend and was applied to the coherent wheat yield variability zones of Eastern Uttar Pradesh, India.3 Different studies of yield prediction of wheat and sugarcane crops for Tarai region of Uttarakhand was also done earlier.4,5 An efficient forecasting is thus a pre-requisite for food supply information system at district and state level. The final crop production estimates though based on objective crop-cutting experiments, are of limited utility as these become available much later after the crop harvest.
A study was conducted for comparison of different regression models to predict mustard yield in Central Punjab.6 In this study, three types of models were compared: 1. the first model was using simple the multiple regression technique, second one is modified model, where technology trend was taken as one of the extra variable in multiple regressions. In the third model, multiple regression analysis was done using SPSS software. Regression equations were developed separately for all three models and were used to predict the mustard yield. The results concluded that second and third model performed well in different locations.
Considering yield variability and importance of rapeseed-mustard for farmer’s different technique have been used to develop an approach for large area yield prediction (Fig. 1.).The aim of this paper is to form identical coherent zones of erstwhile Uttar Pradesh based on weather induced yield variability and to predict the mustard yield using different multivariate statistical models.
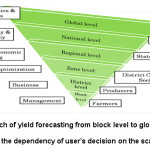 |
Figure 1: Approach of yield forecasting from block level to global level showing the dependency of user’s decision on the scale level |
Methodology
The zonation of districts on the basis of weather induced variability in mustard yield has been achieved by following different steps:
Yield Series Generation and Weather Induced Yield Variability Index (WIYVI) Computation
In order to analyse the effect of climate variability on crop yield inter-annual variability, time series must be de-trended. Crop yields are strongly influenced by intra-seasonal and inter-annual climate variability but also by improvements and responses in agro-management practices and other socio-economic factors. Once the non-climatic factors trend is removed then the residual can explain the effect of climatic variables. The study site comprised of total 33 districts of erstwhile Uttar Pradesh. There were 13 districts of Uttarakhand and 20 districts of western Uttar Pradesh. District wise historical data of mustard area, production and productivity for the period of 19 years (1997-2015) for erstwhile Uttar Pradesh were obtained from the website of ‘DACNET’. A dependable yield series for total 33 districts of Uttarakhand and western U.P were generated for further analysis. The yield series of different districts of Uttarakhand and Uttar Pradesh had been shown in table 1. Some districts were bifurcated from the other, so there acreage and production estimation were done on basis of their parent districts. Like Hathras, Hapur, Gautam Budh Nagar and Kasganj were separated from Aligarh, Gaziabad, Bulandsahar, and Etah, respectively.
One of the main challenges of climate change is to assess the quantitative impact of this on crop production. Thus, there is a need to quantify the relationship of yield with the weather variables. The variability in mustard yield also originates from the changes\improvisation of technology (including variety, fertilizers, pesticides etc) and the weather of that year. The WIYVI was estimated by normalizing the observed yield with the expected yield from current technology as followed:
Estimation of Technological Trend Yeld
De-trending is the statistical or mathematical operation of removing trend from the series. It is often applied to remove a feature thought to distort or obscure the relationships of interest. In order to analyze the impact of climate variability on crop yield inter-annual variability, time series must be de-trended. The development in technology shows a relationship with the time period. The collected yield data for present study were regressed with years to get a technology trend equation 1, for every district. The values for coefficients “a” and “b” are given in table 1
For single trend
Yt= a + b*T where ………..(1)
Where,
Yt is technological trend yield,
T = years since 1997 and
Generation of Weather Induced Yeld Variability Index (WIYVI) and de-Trend Yield
The relative deviation obtained in observed crop yield ( ith year and jth district) from modeled technology trend yield (Yt) for overall 32 districts of erstwhile U.P. was taken as representative of WIYVI for each district and year. When the WIYVI is represented in form of percentage the yield thus obtained from it is known as De-trend yield. These de-trend yields are predictable to be free from all the technological trends and assumed to have variability due to weather variables only.
WIYVIij = ((Yij– Ytij)/Yij), …………….. (2)
Where,
ith = year and jth= district
Clustering of De-trend Yield
Hierarchical Agglomerative Cluster (HAC) analysis technique is used for the formation of different clusters of districts. A hierarchical clustering is a sequence of partitions in which each partition is nestled into next partition in sequence. An agglomerative algorithm in hierarchical clustering starts with disjoint cluster, which places each of ‘n’ objects in an individual cluster. From different methods of HAC, Ward’s method has been used. Ward’s minimum variance criterion minimizes the total within-cluster variance. To implement this method, at each step find the pair of clusters that leads to minimum increase in total within-cluster variance after merging. The initial cluster distances in Ward’s minimum variance method are therefore defined to be the squared Euclidean distance between points viz.
dij = d({Xi}, {Xj}) = ||Xi – Xj||
The distance formula for ward’s method which returns the distance from one node to the newly formed node in terms of the dissimilarities between clusters7:
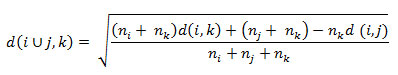
Where,
i, j, k are different clusters and ni, nj and nk are elements in cluster.
The relationship between similar sets of data is being represented by the tree structural dendogram. The horizontal axis of the dendrogram represents the distance or dissimilarity between clusters. The vertical axis represents the objects and clusters.
Identification of Coherent Yield Variability Zone
A dendogram of inter cluster distance indicating normalized distance of districts has been plotted in Fig. 2. These cluster labels were then transferred to the district map of respective regions and spatially contiguous districts having same cluster label were identified as lucid and coherent yield variability zones. The clusters, which didn’t show the spatially contiguity were spilt to create contiguous zones and those hilly district areas which were different in yield variability lied in different clusters were clubbed in one zone because of spatial contiguity.
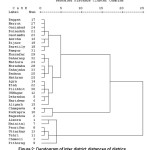 |
Figure 2: Dendogram of inter district distances of districs |
Results and Discussion
District-wise Variability in Yield Series
District wise average mustard yield for 13 districts of Uttarakhand and 20 districts of U.P has been summarized in table 1. District-wise mustard yield of Uttarahand varies from 0.44 t/ha (Bageshwar) to 0.91 t/ha of Haridwar district. In case of western U.P. he highest yield was in Mathura (1.39 t/ha) while lowest in Muzzaffarnagar (0.74 t/ha). Variation in mustard yield for Uttarakhand was highest in Pithoragarh district with coefficient of variance 41% (SD=0.23) and least variation in Haridwar district (13%). The highest coefficient of variation about 103% in mustard yield was found in Rampur district of U.P, while least in Gaziabad. A study had been conducted to analyze spatial and temporal wheat yield variability in Punjab and Haryana.8 In his study they identified the three wheat yield variability zones based on weather induced yield variability index.
Table 1: District Wise Average Yield with Statistical Analysis
| Districts | Average yield (t/ha) | SD | CV | Intercept (a) | Slope (b) | WIYVI zone |
| Uttarakhand | ||||||
|
Almora |
0.54 |
0.20 |
37.73 |
0.574 |
0.003 |
1 |
|
Bageshwar |
0.44 |
0.18 |
40.58 |
0.667 |
0.025 |
1 |
|
Chamoli |
0.55 |
0.19 |
34.24 |
0.592 |
0.004 |
1 |
|
Champawat |
0.64 |
0.24 |
36.62 |
0.503 |
0.015 |
1 |
|
Dehradun |
0.72 |
0.11 |
15.69 |
0.778 |
0.006 |
2A |
|
Haridwar |
0.80 |
0.11 |
13.90 |
0.799 |
0.000 |
2A |
|
Nainital |
0.91 |
0.28 |
30.25 |
0.591 |
0.032 |
1 |
|
Pauri |
0.53 |
0.17 |
32.59 |
0.636 |
0.010 |
1 |
|
Pithoragarh |
0.54 |
0.23 |
41.93 |
0.629 |
0.009 |
1 |
|
Rudraprayag |
0.47 |
0.17 |
36.60 |
0.510 |
0.004 |
1 |
|
Tehri |
0.50 |
0.20 |
39.67 |
0.586 |
0.008 |
1 |
|
Uttarkashi |
0.56 |
0.18 |
31.96 |
0.588 |
0.028 |
1 |
|
Udham Singh Nagar |
0.87 |
0.22 |
25.67 |
0.597 |
0.004 |
2B |
| Uttar Pradesh | ||||||
|
Agra |
1.38 |
0.27 |
19.58 |
1.138 |
0.024 |
2B |
|
JyotibhaPhulle Nagar (Amroha) |
1.02 |
0.19 |
18.39 |
0.821 |
0.021 |
3A |
|
Bagpat |
1.15 |
0.16 |
14.24 |
1.05 |
0.009 |
3A |
|
Bareilly |
0.78 |
0.39 |
50.35 |
0.762 |
0.002 |
3B |
|
Bijnor |
1.06 |
0.16 |
15.42 |
0.889 |
0.017 |
3A |
|
Badaun |
1.14 |
0.24 |
21.06 |
0.766 |
0.037 |
2B |
|
Bulandshahr |
1.12 |
0.17 |
15.36 |
0.95 |
0.017 |
3A |
|
Etah |
1.35 |
0.31 |
23.41 |
0.863 |
0.048 |
2B |
|
Gautam Buda Nagar |
1.18 |
0.23 |
19.07 |
0.136
|
0.004 |
3A |
|
Ghaziabad |
1.17 |
0.16 |
13.86 |
1.02 |
0.015 |
3A |
|
Hathras |
1.15 |
0.21 |
18.67 |
0.968 |
0.018 |
2B |
|
Mathura |
1.39 |
0.36 |
25.64 |
0.956 |
0.043 |
2B |
|
Meerut |
1.15 |
0.16 |
14.32 |
1.059 |
0.009 |
3A |
|
Moradabad |
1.05 |
0.21 |
19.71 |
0.784
|
0.026 |
2A |
|
Muzaffarnagar |
0.99 |
0.16 |
16.19 |
0.953 |
0.004 |
2B |
|
Pilibhit |
0.74 |
0.14 |
18.48 |
0.587 |
0.015 |
2B |
|
Rampur |
1.02 |
1.07 |
103.97 |
1.025 |
0 |
3B |
|
Saharanpur |
0.99 |
0.16 |
16.20 |
0.954 |
0.003 |
2A |
|
Shahjahanpur |
0.80 |
0.12 |
14.70 |
0.747 |
0.004 |
2B |
|
Aligarh |
1.24 |
0.28 |
22.70 |
0.974 |
0.026 |
2B |
A study reported that one undisputable causes of famine in South Western Nigeria is the poor growth of crops resulting from weather variability due to insufficient or untimely rainfall.9 Inter–annual rainfall variations, which is referred to as the distribution of rainfall within a period of a year10 had caused great stress to the farming activities, crop production and crop yield especially in the Guinea Savanna of Nigeria in the last decade.
Formation of Zones on Basis of WIYVI
The collected mustard yield data for 32 districts were regressed with the years to get the technology trend yield equation of every district. The inter-annual variability of yields, expressed as the variance of the de-trended time series, was highly variable across the study region. Cluster analysis, using UAS and ground truth data, had proved to be a good strategy to identify the homogeneous wheat crop areas.11 Both the techniques i.e. cluster analysis and homogeneous zone formation were used but in association the remote sensing data.
The district level inter cluster distance depicted through HAC using ward’s method for earstwhile U.P has been shown in Fig 2. Districts having similar pattern in yield deviation were placed in same zone. Four clusters of the districts were created and dendogram is presented. Cluster 1 comprised of total 9 districts with five in one sub cluster and two pairs of two district sub-clusters. Cluster 2 was largest among all and it has total 17 ditricts with sub-clusters having 3,4,4,2 and 1districts. There were only three district in cluster number 3 with one single district and two district in one sub-cluster all belonged to the hilly areas. The last cluster comprised of all the left hilly areas of uttarakhand with two single districts sub-cluster and three in other and two in other sub-clusters.
Another study for assessing the impact of intra-seasonal climate variability on inter-annual variation in winter wheat and grain maize yields over 92 French administrative regions.12 For the same PSLR regression technique and spatial clustering was done and inter annual variability relationship was developed.
Mapping of Clusters in GIS
The clusters formed on basis of WIYVI by SPSS was mapped with help of quantum GIS into identically coherant zones. Initially four clusters have been created, which have been shown with the same color in map generated in Fig. a. The four clusters (1, 2, 3 and 4) were divided into five zones (Zone 1, Zone 2A, Zone 2B, Zone 3A and Zone 3B) on the basis of geographic continuity of zones. If the zone was not contiguous, the same was split into two for example districts under cluster 2 and 3 were far from each other, so cluster 2 and 3 were subdivided into two zones (2A and 2B) and (3A and 3B).
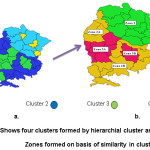 |
Figure 3 (a): Shows four clusters formed by hierarchial cluster analysis and (b) Zones formed on basis of similarity in cluster Click here to View figure |
In the same way the districts in cluster 1 and 2 both have similar spatial contiguity have been merged into Zone I. The districts lying in these clusters are hilly regions having more or less similar kind of environment and weather conditions. The similar conditions occurred with the Mathura district of U.P., which was clubbed in cluster 3 but its spatial contiguity lies with the zone 2B, so it was merged in the same zone. The identified zones can be used as a base for regional prediction of mustard yield.
The yield variation of the whole region of erstwhile Uttar Pradesh has been depicted in Fig. 4. The highest coefficient of variation of 27% was found in Zone I and least in Zone 3B with CV of 12%. Thirteen coherent zones were identified for wheat yield of erstwhile Uttar Pradesh.13
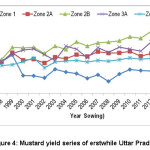 |
Figure 4: Mustard yield series of erstwhile Uttar Pradesh |
Conclusions
The main target of this study was to build upon the yield prediction approach for regional level by assessing important weather variables. On the basis of these homogeneous zones different types of multivariate statistical models were developed. This kind of approach starting from block level to district and then moving to region (states) and country level is going to be very helpful for decision making of any country’s economy and development.
Acknowledgements
This research received no specific grant from any funding agency in the public, commercial, or not-for-profit sectors.
References
- FAOSTAT. Food and Agriculture Organization of the United Nations.2013.http://faostat.fao.org Accessed 16 Mar .2014.
- Kalra N., Chakraborty D., Sharma A., Rai H. K., Jolly M., Chander S., Kumar R. P., Bhadraray S., Barman D., Lal M, Sehgal M. Effect of increasing temperature on yield of some winter crops in north-west India. Curr. Sci. 2008. 94(1):82–88.
- Nain, A.S., Dhadwal, V.K. and Singh, T.P. Use of CERES-Wheat model for wheat yield forecast in central Indo-Gangetic Plains of India. Journal of Agricultural Science. 2004;142:59–70.
CrossRef - Ranjan, R., Nain, A.S. and Pawar, R. Predicting yield of wheat with remote sensing and weather data. Journal of Agrometeorology. 2014;14 (special issue):390-392.
- Ranjan R., Nain A. S. Development of yield prediction model for sugarcane based on weather variables and accuracy assessment. National Seminar on Indian Agriculture: Preparedness for Climate Change, March 24-25, 2012, New Delhi.
- Bhat K., Gill K. K., Sandhu S. S. Comparison of Different Regression Models to Predict Mustard yield in Central Punjab. Vayu Mandal. 2015;41:27-38.
- Lance G. N, Williams W.T. A general theory of classificatory sorting strategies. Computer Journal, 9(4):373–380. doi: 10.1093/comjnl/9.4.373. 1967.
CrossRef - Nain A.S., Dhadwal V. K, Singh T. P. Aalysis of spatial and temporal wheat yield variability in Punjab and Haryana and Identification of coherent yield zone Journal of Agrometeorology. 2003;5(1): 25-34.
- Odekunle T. O., Orinmoogunje I. O., Ayandele A. Application of GIS to assess rainfall variability impacts on crop yield in Guinea Savanna part of Nigeria, African Journal of Biotechnology, 2007.6 (18): 2100-2113.
- Obasi G.O.P. Regional conference on climate change and food sustainability in the21st century; Keynote Address, Lagos, Nigeria. 2003.
- Marino S, Alvino A. Detection of homogeneous wheat areas using multi-temporal UAS images and ground truth data analyzed by cluster analysis, European Journal of Remote Sensing. 2018;51(1):266-275.
CrossRef - Ceglar A., Toreti A., Lecerf R., Velde M., Dentener F. Impact of meteorological drivers on regional inter-annual crop yield variability in France. Agricultural and Forest Meteorology. 2016;216:58–67.
CrossRef - Nain A. S., Dadhwal V.K, Singh T. P. Identification of homogenous zones for wheat in erstwhile Uttar Pradesh using historical yields. In Balancing Food and Environment Security–A Continuing Challenge, Extended Summaries of 2nd International Agronomy Congress 2002;2:866–867. New Delhi, India: Indian Society of Agronomy, IARI.