


Introduction
Glyphosate [N-(phosphonomethyl) glycine] is phosphonomethyl derivative of glycine and/or aminophosphonic glycine analogue is a broad-spectrum herbicide that targets broad-leaved weeds and perennial grasses.1 Its herbicidal action offers competitive inhibition of 5-enol-pyruvyl-shikimate-3-phosphate synthase in shikimate pathway in plants, fungi, bacteria and protozoa.2,3 This blocks synthesis of aromatic amino acids (tyrosine, tryptophan and phenylalanine), inhibiting protein synthesis, chloroplast degeneration and membrane permeability causing plant death.4,5 Microbial mediated degradation occurs via two pathways:
(i) utilizing glyphosate as phosphorous source, converting to sarcosine and mineralizing to CO2 and water; (ii) glyphosate as nitrogen source to produce glyoxylate and AMPA.6 Residual glyphosate and AMPA determine microbial community, which acts as a predictor in determining glyphosate degradation and persistence.7 The study was designed to show relationships between change in glyphosate induced microbial community structure over time through high-throughput sequencing, emphasizing microbial activities as biomarkers for soil quality and sustainable development rather than degradation kinetics.
Microbial ecologists documented glyphosate induced shift in microbial community structure in agroecosystems using key soil quality biomarkers including soil organic matter,8,9
microbial biomass pool10 and enzyme activities.11 Soil organic matter and clay influence glyphosate sorption, desorption, degradation and bioavailability.12 Studies on glyphosate treatment revealed changes in microbial community structure and diversity and disruptions of bacterial network.13 Foliar application impact microbial and functional profiles in nutrient turnover and biogeochemistry explored using metagenomic analysis.14,15 Repeated herbicide exposure exerts selective pressure for microbial communities to adapt microenvironment or modify genetic profiles by resilience against sub-lethal doses.16
Metagenomics based high-throughput sequencing offers comprehensive exploration of glyphosate exposure on the taxonomic and functional dynamics of microbiome. Although glyphosate-based herbicides with varied formulations are extensively used, their long term and formulation dependent on soil microbial communities remains insufficiently understood. Therefore, the present study elucidated glyphosate induced alternations in available nutrients, microbial biomass, enzymatic activities, and their influence on microbial community dynamics following herbicide application over time. The study also highlighted the role of microbial communities in glyphosate persistence, degradation and resilience leading to the emergence of herbicide-tolerant species and consequent impacts on sustainable agriculture.
Materials and methods
Study site and sampling
The field experiments were conducted in the agricultural lands of Godbhaga, Attabira block of Bargarh district, Odisha (SF1). Agricultural lands with no herbicide exposure for at least two years were selected. Randomized block design having 10 m2 plots was selected for glyphosate (GLS) treatment and one plot was referred to as ‘control’ (without glyphosate treatment). Sampling was done in different days after glyphosate treatment (0, 7, 14, 21 and 28). Each site was divided into five blocks and five random samples were collected (0-5 cm depth), pooled into sub-sample and mixed thoroughly to obtain a composite sample.
Experimental set up and glyphosate treatment
The experiment was conducted in four agricultural plots [Control (without treatment) and three for herbicides treatment]. Glyphosate was sprayed as per the recommended dose i.e. Roundup® 360 g/l acid equivalent glyphosate.17 Soil samples were collected such as without glyphosate treatment (ASC) as well as 0,7,14, 21 and 28 days after glyphosate treatment (ASG0, ASG7, ASG14, ASG21 and ASG28). Effect of glyphosate on organic carbon (OC),18 total nitrogen (TN),19 extractable phosphorus (EP),20 microbial biomass carbon(MBC),21 microbial biomass nitrogen (MBN),22 microbial biomass phosphorous (MBP)23 and basal soil respiration (BSR)24 was determined.
FTIR spectroscopic analysis
Soil profiles (ASC: without treatment) and different days after glyphosate treatment (ASG0, ASG7, ASG14, ASG21, ASG28) were analyzed by FTIR to determine existence of different functional groups based on absorption.25 Pellet was prepared with solid powder sample using hydraulic, dried at 60°C for 96 hr and tested in permeation mode compared to KBr pellet (blank) within (400-4000) cm-1 spectrum using Bruker (Alpha II model).
DNA extraction, amplicon sequencing and bioinformatics analysis
Total gDNA was extracted by HiPurA DNA purification kit (Hi-Media). About 40ng of extracted DNA was used for PCR amplification using primers such as 5’-AGAGTTTGATGMTGGCTCAG-3’ (Forward) and 5’- TTACCGCGGCMGCSGGCAC-3’ (Reverse) for 25 cycles. The amplicons from each sample were purified with Ampure beads to remove unused primers and an additional 8 cycles of PCR was performed with Illumina adapter sequences. Amplicon purity was determined using Nanodrop and gel electrophoresis. Library was prepared and purified. Amplicon size, integrity and purity were quantified by Qubit dsDNA assay followed by Illumina Miseq with 2×300 PE sequencing. Metagenomic data is de-multiplexed into fasta-format. Raw reads were subjected to quality check using Fastaqc and Multiqc tools, chimeric sequence removed, clustered into OTUs and annotated using NCBI database.
Sequence analysis and data visualization
The data was rarefied to minimum library size, scaled by total sum scaling (TSS) and visualized with filter data source using rarefaction curve26 (SF2). Rarefied OTUs tables assessed alpha and beta diversity. Alpha diversity was measured using four parameters (Chao1, Fisher, Shannon and Simpson diversity index). Beta diversity was measured by Bray-Curtis dissimilarity matrix to explore dissimilarities across different soil profiles represented by principal coordinate analysis (PCoA) plot. Pavian tool was used for graphical visualization of microbial taxa.27 Datasets were imported to Ploty package to visualize differential abundance from phylum-genus level across different soil profiles. Plotly’s python graphics library was used for comprehensive analysis revealing bacterial diversity patterns. Further, the stacked bar chart representing relative abundance of bacterial taxa was plotted using Origin 2023 (OriginLab corp., USA).
Statistical analysis
Simple correlation analysis between soil variables and enzyme activities in glyphosate treated soil using SPSS (Version 17.0). PCA was performed to discriminate soil profiles in different days after glyphosate treatment using SPSS (Version 17.0). Redundancy analysis summarized linear relationships between the components of response variables that were redundant with a set of explanatory variables (enzyme activities) among glyphosate treated soil in different days after treatment using XLSTAT-2014 (Version 2.03).
Results
Soil nutrients
The study revealed wide variation in organic C (2.83 – 2.25 mgC/g soil), total N (282.1 – 189.2 mgN/g soil) and extractable P (184.2 – 123.8 mgP/g soil) in glyphosate treated soil with maximum in 0 day and minimum in 28 days after glyphosate treatment (SF3). The analysis of variance showed significant decline in organic C (r = 0.997, p < 0.001), total N (r = 0.985, p < 0.001) and extractable P (r = 0.996, p < 0.001) in different days after glyphosate treatment. The study indicated consistent decline in microbial biomass C (179.13 – 126.35 mgC/g soil), microbial biomass N (21.89 – 13.03 mgN/g soil) and microbial biomass P (12.73 – 7.18 mgP/g soil) in different days after glyphosate treatment, which was found to be significant MB-C (r = 0.991, p < 0.001), MB-N (r = 0.988, p < 0.001) and MB-P (r = 0.998, p∈0.001) (SF4). The OC:TN ratio showed gradual increase (10.03 – 11.89) whereas MBC:OC ratio (6.32 to 5.61), MBN:TN ratio (7.75 to 6.88) and MBP: EP ratio (6.91 to 5.79) showed gradual decline over a period of 28 days after glyphosate treatment (Table 1). Basal soil respiration (BSR) declined significantly after glyphosate application, from 0.435 µg CO2-C/g soil/hr on 0 day to 0.246 µg CO2-C/g soil/hr by 28 days (r = 0.999, p < 0.001) (SF5).
Table 1: Integrating quotients such as OC:TN, MBC:OC, MBN:TN and MBP:EP in agricultural soil in different days (ASG0 → ASG28) after glyphosate treatment.
Integrating quotients |
Different days after glyphosate treatment |
||||
|
ASG0 |
ASG7 |
ASG14 |
ASG21 |
ASG28 |
|
|
OC:TN |
10.03 |
10.86 |
11.44 |
11.61 |
11.89 |
|
MBC:OC (%) |
6.32 |
5.94 |
5.81 |
5.72 |
5.61 |
|
MBN:TN (%) |
7.75 |
7.63 |
7.37 |
6.96 |
6.88 |
|
MBP:EP (%) |
6.91 |
6.78 |
6.53 |
6.31 |
5.79 |
FTIR analysis
FTIR analysis of glyphosate treated agricultural soil in different days (0, 7, 1, 21, 28) after treatment was conducted to identify existence of chemical moieties such as P-O, C-O, carbonyl (C=O), hydroxyl (O-H) and amine (N-H) with characteristic IR fingerprints ranging from 910 cm-1 to 3895 cm-1 (SF6). Peak appeared at 910 cm-1, 999 cm-1, 1628 cm-1, 3276 cm-1 and 3621 cm-1 corresponds to the presence of P-O, C-O, carbonyl (C=O), hydroxyl (O-H) and amine (N-H) group respectively within the stretching vibration absorption (ST1).
Microbiome across different agricultural soil profiles
To elucidate the long-term impacts of glyphosate application on bacterial community structure in agricultural soil, the comprehensive microbial profiling of glyphosate treated soil on different days after treatment was performed. The data was presented using Sankey plot that revealed the relative distribution of bacterial taxa from phylum to species level.
About 35,600 bacterial reads were generated from untreated agricultural soil (ASC), distributed among different phyla. Moreover, the Pseudomonadota (38.8%), Actinomycetota (33.8%), Acidobacteriota (7.3%) and Planctomycetota (6.6%) were found to be the four most dominated phyla. Alphaproteobacteria (85%) was the most dominated bacterial class within phyla Pseudomonadota (Figure 1a). Dominated bacterial order includes Sphingomonadales (26.05%), Propionibacteriales (9.35%), Micromonosporales (4.96%), Gaiellales (4.78%) and Hyphomicrobiales (4.34%). Besides, Sphingomonadaceae was observed as most dominated bacterial family representing about 98% of bacterial taxa within order Sphingomonadales. About 37,800 bacterial reads were obtained from glyphosate treated soil (ASG0). The study indicated that Pseudomonadota (43.2%), Actinomycetota (35.4%), Acidobacteriota (5.65%) and Chloroflexota (3.8%) were the dominated phyla (Figure 1b). Nevertheless, Actinomycetes (64%) followed by Rubrobacteria (19%) were observed to be the most abundant bacterial classes within phyla Actinomycetota. Additionally, Sphingomonadales (35.84%), Propionibacteriales (8.66%), Gaiellales (6.73%), and Solirubrobacterales (4.36%) were the dominated bacterial orders associated with ASG0.
At ASG7, about 39,300 bacterial sequences were generated, which mainly includes Actinomycetota (43.91%), Pseudomonadota (35.84%), Acidobacteriota (5.2%) and Chloroflexota (4.51%) as dominated phyla. Actinomycetes (59%), Rubrobacteria (20%) and Thermoleophillia (17%) were the dominated class within phylum Actinomycetota. Major orders include Sphingomonadales (29.06%), Propionibacteriales (8.23%), Gaiellales (8.78%) and Solirubrobacterales (7.12%). Additionally, Sphingomonadaceae was the most dominated bacterial family representing 98% of order Sphingomonadales (Figure 1c). About 38,000 bacterial reads in ASG14 were obtained and classified into different taxa (Figure 1d). Actinomycetota (42.73%) Pseudomonadota (35.2%) and Acidobacteriota (5.14%) were three dominated bacterial phyla. Actinomycetes was the most prevalent bacterial class accounted 61% of the bacterial taxa followed by Rubrobacteria (20%) within phylum Actinomycetota.
A total of 36,000 bacterial reads were generated in 21 days after glyphosate treated soil (ASG21), which were distributed into different bacterial taxa (Figure 1e). The study revealed Actinomycetota (37.86%), Pseudomonadota (37.12%), Acidobacteriota (5.23%) and Bacillota (4.55%) as dominated phyla. Alphaproteobacteria (34.49%), Actinomycetes (23.93%) and Rubrobacteria (6.79%) were the dominated bacterial class. Propionibacteriales (35%), Micromonosporales (26%) and Streptomycetaceae (11%) were the dominated orders within class Actinomycetota. The bacterial order Gaiellales represented 100% bacterial taxa belonging to the class Rubrobacteria and 18% of the phylum Actinomycetota. About 36,600 bacterial sequences were generated in 28 days after glyphosate treated soil (ASG28). Actinomycetota (44.76%) followed by Pseudomonadota (35.65%) were the most dominated bacterial phyla in ASG28. The study revealed Sphingomonadales (28.32%), Micromonosporales (9.55%), Gaiellales (8.13%) and Propionibacteriales (7.12%) as the dominated orders in ASG28 (Figure 1f).
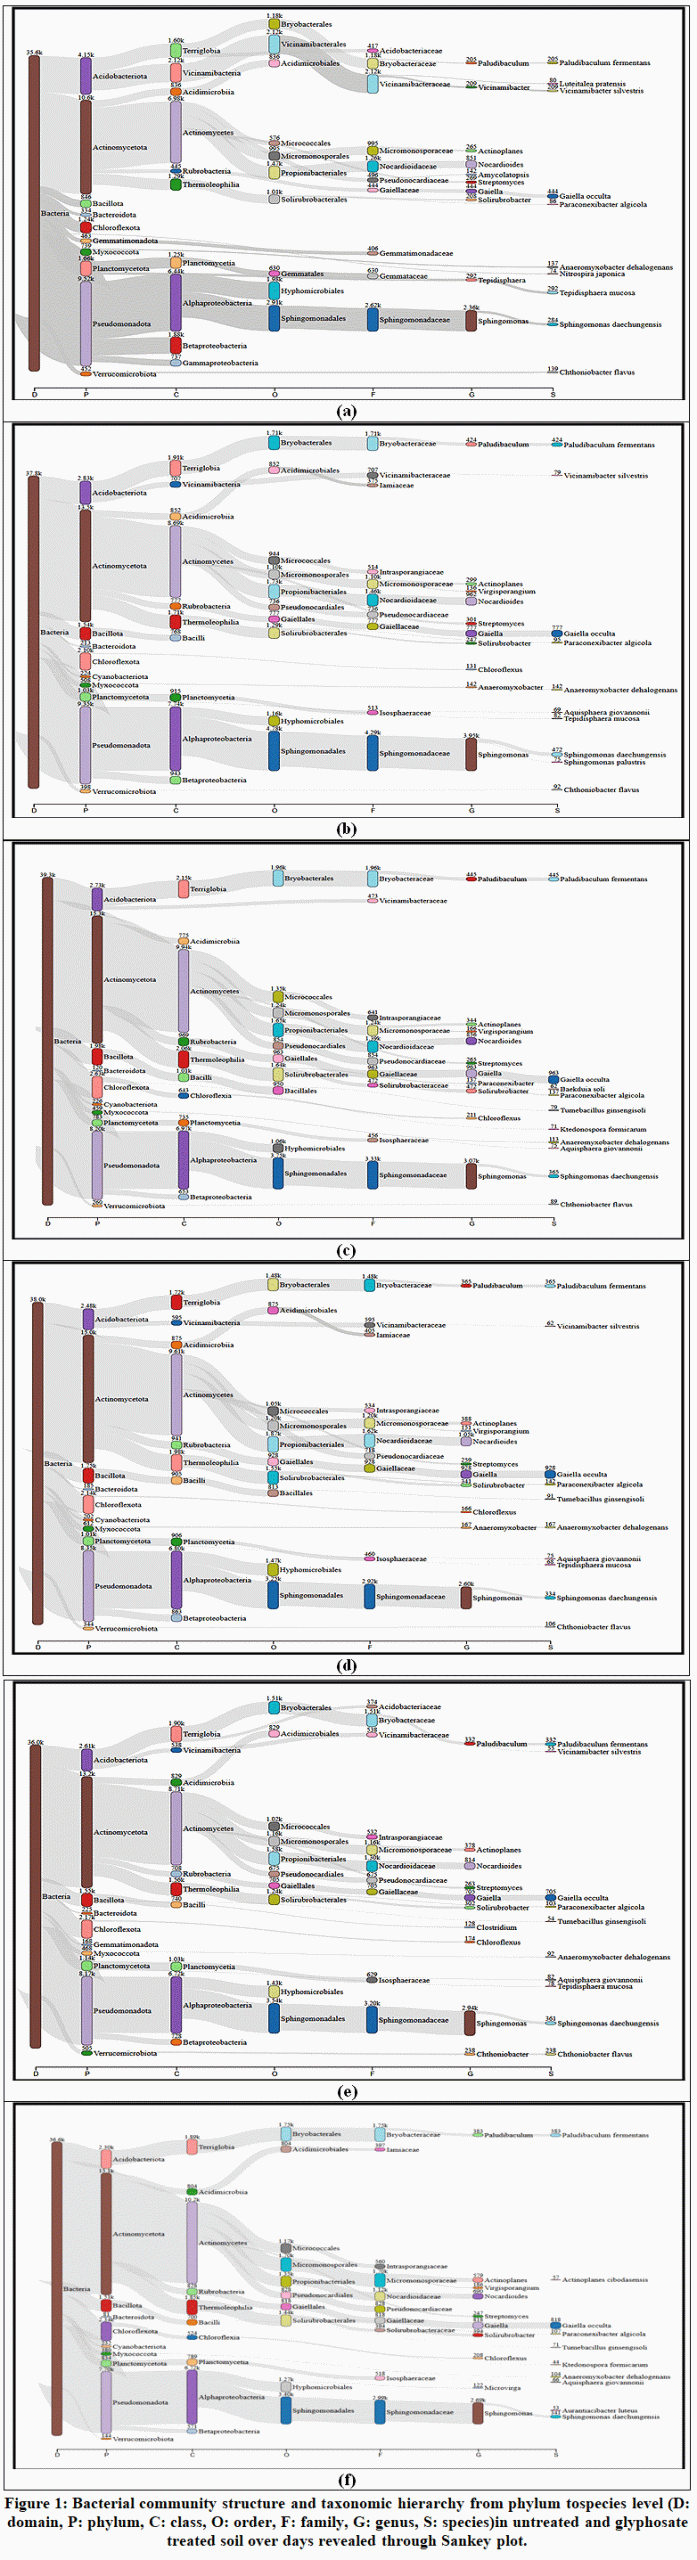 |
Figure 1: Bacterial community structure and taxonomic hierarchy from phylum to species level (D: domain, P: phylum, C: class, O: order, F: family, G: genus, S: species) in untreated and glyphosate treated soil over days revealed through Sankey plot. |
Bacterial community dynamics at taxonomic levels across soil profiles
Relative abundance of top 20 bacterial phyla showed wide variations among untreated and glyphosate treated agricultural soil profiles (Figure 2a). Actinomycetota (33.81- 44.76)%, Pseudomonadota (34.20-43.16)%, Acidobacteriota (4.72-7.35)%, Chloroflexota (2.86-4.67)% and Bacillota (1.94-4.55)% were dominated phyla. Distribution of Actinomycetota was minimum in ASC, which showed increasing trend in glyphosate treated soil. Relative distribution of Pseudomonadota was highest in ASG0, which gradually declined over time. The study indicated dominance of Sphingomonadaceae (24.33-34.99)%, Nocardioidaceae (6.86-9.60)%, Gaiellaceae (4.67-8.79)% across soil profiles (Figure 2b). Relative distribution of Sphingomonadaceae was highest in ASG0 that declined over time. Bacterial genera Sphingomonas (23.72-34.26)%, Nocardioides (6.85-9.57)%, Gaiella (4.67-8.73)% and Actinoplanes (2.59-5.75)% were the dominated taxa (Figure 3a). Wide variations in certain bacterial taxa in glyphosate treated soil can be attributed to their abilities either to degrade glyphosate (Figure 3b). Bacterial species such as Sphingomonas sp. (20.05-29.39)%, Nocardioides sp. (6.17-8.58)%, Gaiella occulta (4.67-8.13)%, Sphingomonas daechungensis (2.98-4.09)% and Paludibaculum fermentans (2.15-4.09)% were the dominated bacterial taxa across untreated and glyphosate treated soil profiles (Figure 4a). Gaiella occulta exhibited significant variation with minimum in untreated soil ASC (4.67%), which increases in glyphosate treated soil profiles with relative abundance in ASG7 (8.78%) (Figure 4b).
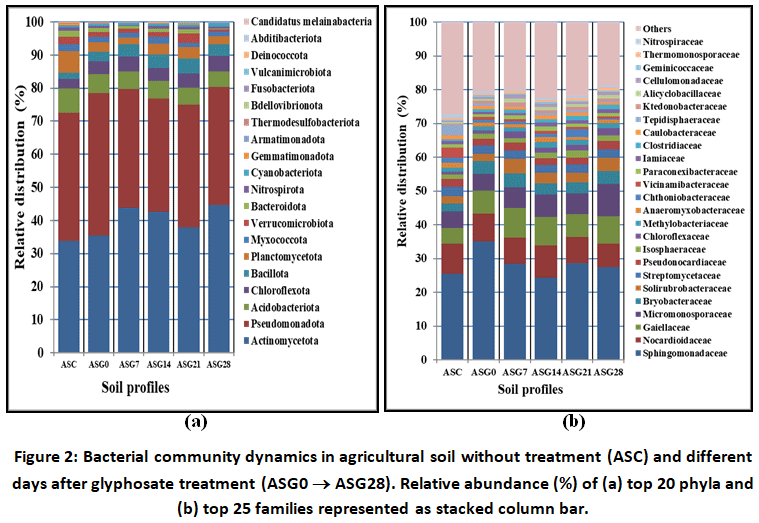 |
Figure 2: Bacterial community dynamics in agricultural soil without treatment (ASC) and different days after glyphosate treatment (ASG0 ® ASG28). Relative abundance (%) of (a) top 20 phyla and (b) top 25 families represented as stacked column bar. |
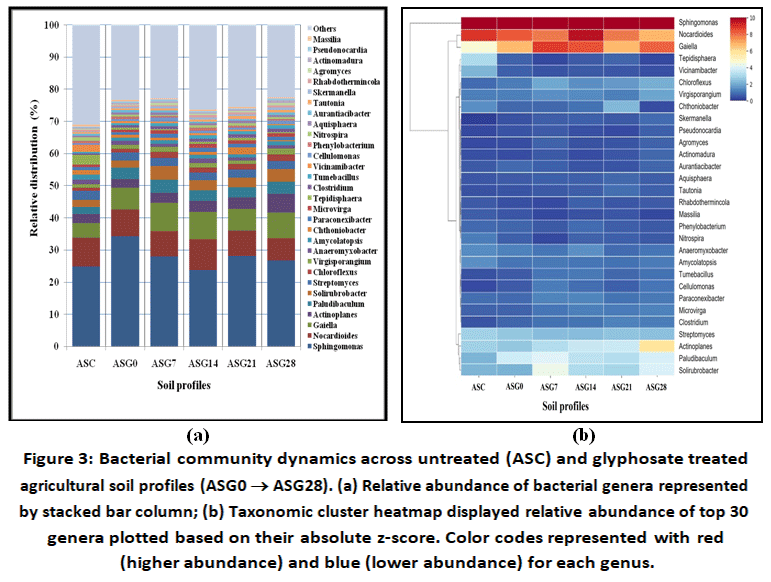 |
Figure 3: Bacterial community dynamics across untreated (ASC) and glyphosate treated agricultural soil profiles (ASG0 ® ASG28). (a) Relative abundance of bacterial genera represented by stacked bar column; (b) Taxonomic cluster heatmap displayed relative abundance of top 30 genera plotted based on their absolute z-score. |
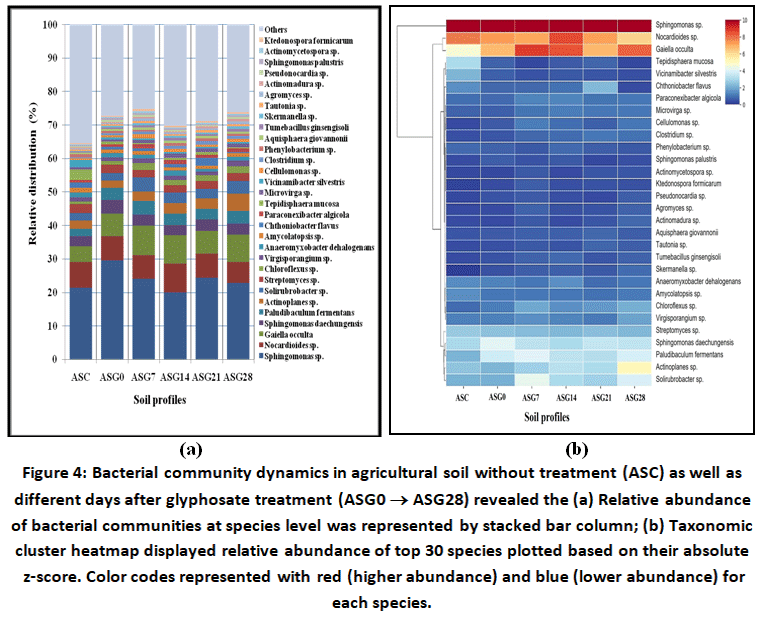 |
Figure 4: Bacterial community dynamics in agricultural soil without treatment (ASC) as well as different days after glyphosate treatment (ASG0 → ASG28) revealed the (a) Relative abundance of bacterial communities at species level was represented by stacked bar column; (b) Taxonomic cluster heatmap displayed relative abundance of top 30 species plotted based on their absolute z-score. |
Diversity indices based on relative distribution
Chao1 index varied from 177 (ASG0) to 193 (ASC) across different soil profiles. Higher Chao1 index value by ASC indicated rare bacterial communities compared to glyphosate treated soil profiles. Similarly, fisher value varied from 30.17 (ASG0) to 34.81 (ASC) across different glyphosate treated soil. Higher fisher value in ASC indicated greater species richness, while lower Fisher’s value in ASG0 indicated lower species evenness. Moreover, Shannon’s diversity index correlates both species richness and evenness, which varied from 3.28 (ASG0) to 3.67 (ASC). Greater value of Shannon’s diversity index exhibited by ASC revealed dominance of certain bacterial species compared to treated soil profiles. Further, Simpson diversity index varied from 0.85 (ASG0) to 0.91 (ASC).
Principal coordinates analysis (PCoA) based on Bray-curtis index value indicated the variance between ASC and different days after glyphosate treatment soil profiles. Study suggested that bacterial community across different soil profiles were well segregated (Figure 5a). Further, dendrogram was constructed using Ward clustering algorithm, which revealed closer relatedness between ASG7 and ASG14, ASG21 and ASG28 (Figure 5b). However, ASC and ASG0 were found to be distantly related with distinct bacterial communities.
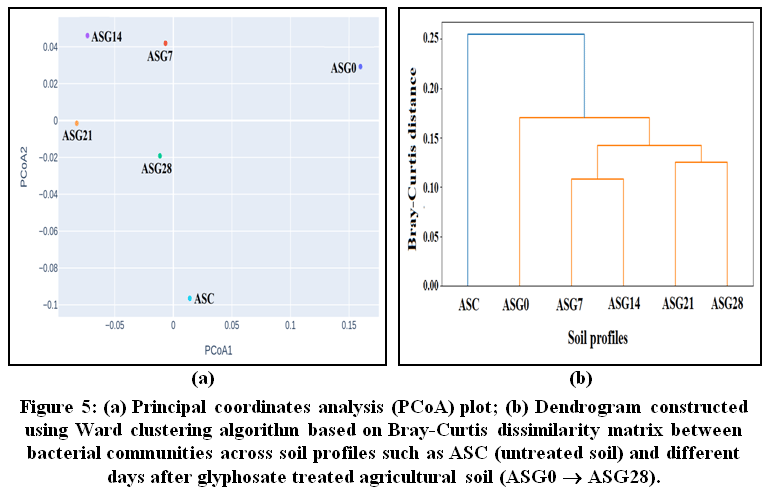 |
Figure 5: (a) Principal coordinates analysis (PCoA) plot; (b) Dendrogram constructed using Ward clustering algorithm based on Bray-Curtis dissimilarity matrix between bacterial communities across soil profiles such as ASC (untreated soil) and different days after glyphosate treated agricultural soil (ASG0 → ASG28). |
Core microbiome analysis
The core microbiome analysis revealed the presence of Sphingomonas, Nocardioides, Gaiella, Paludibaculum, Actinoplanes, Solirubrobacter and Streptomyces across untreated and glyphosate treated soil profiles (Figure 6a). The study clearly indicated that untreated ASC and different days after glyphosate treated soil profiles (ASG0 → ASG28) shared large number of bacterial taxa. However, bacterial taxa unique to individual soil profiles were represented by heterogeneous bacterial communities, depicted by Venn diagram. The result depicted the existence of 41 unique bacterial taxa associated with ASC (without glyphosate tretaement). Moreover, the unique bacterial taxa associated with different days after glyphosate treated agricultural soil such as ASG0, ASG7, ASG14, ASG21 and ASG28 were found to be 25, 11, 63, 29 and 34 respectively (Figure 6b).
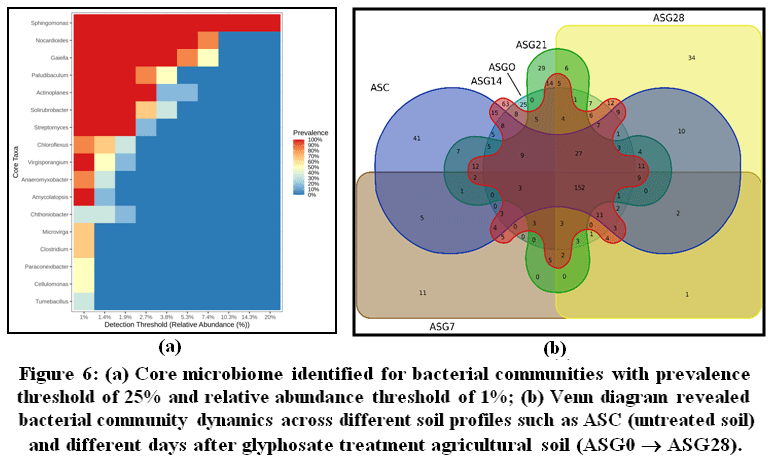 |
Figure 6: (a) Core microbiome identified for bacterial communities with prevalence threshold of 25% and relative abundance threshold of 1%; (b) Venn diagram revealed bacterial community dynamics across different soil profiles such as ASC (untreated soil) and different days after glyphosate treatment agricultural soil (ASG0 → ASG28). |
Features selection of importance using heatmap
The features selection technique involves soil variables in dataset, which reveal most significant impact on the predictive power of a model, represented by heatmap (Figure 7). Features selection in glyphosate treated soil display patterns and correlations in heatmap in which vibrant colors signify stronger correlation (TN, MBC, MBN, MBP and BSR) with standalone value 1, while lighter colors represent weaker interactions among soil variables.
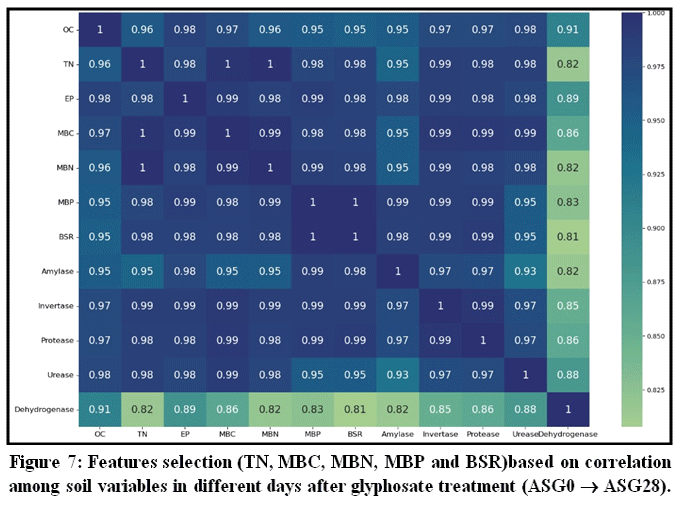 |
Figure 7; Features selection (TN, MBC, MBN, MBP and BSR) based on correlation among soil variables in different days after glyphosate treatment (ASG0 → ASG28). |
Discussion
The organic C play crucial role in modulating its mobility, soil persistence and adsorption.28,29 Studies substantiated variability in organic C level in glyphosate treated soil based on organic matter inputs30,31 and decline in microbial biomass.32,33 Studies reported that glyphosate application induced gradual decline in microbial biomass and activity by altering C mineralization,8,34 N assimilation35,36 and P mobilization.5,37,38 Glyphosate treatment in agricultural soil with low OC:TN ratio (10.03) suggested that surplus organic N beyond microbial demand is readily mineralized by heterotrophs.39,40 ThevariationinOC:TN ratio is due to the glyphosate mediated alterations in nutrient cycling by inhibiting shikimate pathway,41,42 degradation influencing microbial community structure,3 persistence and mobility in agroecosystem. Its negative effects were assessed using different integrating quotients. Decline in MBC:OC ratio (6.32 to 5.61) over a period of 28 days after treatment indicated shift in microbial community structure influencing their potency for C mineralization due to decline in glyphosate persistence. Similar decline trends in MBN:TN ratio (7.75 to 6.88) and MBP: EP ratio (6.91 to 5.79) substantiated the role of microbial biomass in N mineralization and P immobilization in glyphosate treated soil that act ascritical limiting nutrients.43
Minimal BSR exhibited in 28 days after treatment indicated lower microbial turnover due to substrate scarcity, glyphosate induced toxicity44 and binding of glyphosate residues reduces labile pool of organic matter.45 The study indicated that relatively higher microbial metabolic quotient was observed in 0 day (28.284 x 10⁻⁴ g CO2-C/g microbial C/hr) and minimumin 28 days (19.469 x 10⁻⁴ gCO2-C/g microbial C/hr) after glyphosate application (SF4). Significant reduction in microbial metabolic quotient was observed over different days after application (r = 0.944, p < 0.001). Microbial metabolic quotient reflects efficacy of microbial communities involved in substrate/energy utilization, serving as potential soil quality biomarker.46 Higher qCO2 supports microbial community with ‘r- strategy’ ecotype, while lower qCO2 associated with complex detritus and favors ‘k- strategy’ ecotype.47 FTIR analysis revealed that intensities of several characteristic absorption peaks decreased in glyphosate treated soil over time. Similar finding was reported in the glyphosate treated agricultural soil.25 Gradual decline in absorption peaks in glyphosate treated soil was due to glyphosate degradation over time48 with lower concentration in ASG28 compared to ASG0.49
Metagenomic analysis revealed that Actinomycetota, Pseudomonadota, Acidobacteria and Chloroflexota were found as prominent bacterial phyla across untreated and glyphosate treated agricultural soil. Abundance of Pseudomonadota, Actinomycetota, Acidobacteria and Chloroflexota in untreated and glyphosate treated agricultural soil were reported.7,38,50-52 Glyphosate is reported to trigger the shift in microbial community structure after repeated application.8,53 Studies reported that microbial community dynamics in agricultural soil is influenced by glyphosate treatment combined with seasonal variations, cropping patterns and soil management practices.7,52 The dominance of phyla Pseudomonadota (Proteobacteria) and Actinomycetota (Actinobacteria) in glyphosate treated soil was reported.54-56 Bacterial communities were reported to degrade glyphosate after application in agricultural soil and utilize as the source of nitrogen, phosphorus and carbon.6,7 Moreover, glyphosate has been reported to influence sensitive bacterial taxa by reducing competition, allowing the proliferation of resistant bacterial taxa.38,56 Several studies have been substantiated the subtle changes in bacterial community after glyphosate application in agricultural soil over time.7,53 Diversity indices were used to estimate richness and abundance of bacterial communities, which was found to be higher in ASC compared to treated soil profiles.50,57-59 Principal coordinates analysis (PCoA) based on Bray-curtis index value revealed closer relatedness between glyphosate treated soil with distinct bacterial communities have been substantiated.7,56 Core microbiome analysis reported that glyphosate promotes the shift in bacterial community structure in agricultural soil.56,60 Repeated glyphosate exposure creates favorable conditions for microbial growth by acting as selective pressure leading to microbial adaptation across the glyphosate treated agricultural soil.5,61 Besides, the features selection highlights redundant and/or irrelevant features improving model efficiency by enabling dimensionality reduction without compromising accuracy.62
Conclusion
The present study demonstrated that glyphosate application can induce temporal variations in microbial community composition and soil functional attributes, as reflected by alternations in microbial biomass pool size, basal soil respiration and enzyme activities. However, the magnitude of microbial responses may vary with glyphosate dose, soil properties, environmental conditions, and exposure duration. Bacterial community structure and biochemical indicators can therefore serve as sensitive biomarkers for monitoring glyphosate-induced changes in soil quality over time. However, longer-term studies incorporating diverse microbial groups and field conditions are needed to clarify the persistence, recovery, and broader ecological consequences of these effects.
Acknowledgment
We would like to thank Department of Biotechnology and Bioinformatics, Sambalpur University for providing the platform to carry out the experiment.
Funding Sources
The author(s) received no financial support for the research, authorship, and/or publication of this article.
Conflict of Interest
The authors do not have any conflict of interest.
Ethics Statement
This research did not involve human participants, animal subjects, or any material that requires ethical approval.
Data Availability Statement
All the metagenomic data generated during this study are available in the NCBI database (BioProject PRJNA1395345).
Informed Consent Statement
This study did not involve human participants, and therefore, informed consent was not required.
Clinical Trial Registration
This research does not involve any clinical trials.
Authors Contribution
- Debajani Shyamal: Sampling, conducting experiments.
- Ankita Agrawal: Data compilation, analysis, writing.
- Amisha Mohanty: Methodology, data collection.
- Aparupa Naik: Statistical analysis.
- Amiya Kumar Patel: Conceptualization, final approval of manuscript.
References
- Xiao R, Kuang B, Hu Y, et al. Ecological risk assessment of glyphosate and its possible effect on bacterial community in surface sediments of a typical shallow Lake, northern China. Ecotoxicology and environmental safety. 2023;249:114445.
CrossRef - Silva V, Montanarella L, Jones A, et al. Distribution of glyphosate and aminomethylphosphonic acid (AMPA) in agricultural topsoils of the European Union. Science of the Total Environment. 2018;621:1352-1359.
CrossRef - Singh S, Kumar V, Gill JPK, et al. Herbicide glyphosate: toxicity and microbial degradation. International journal of environmental research and public health. 2020;17(20):7519.
CrossRef - Green JM. The rise and future of glyphosate and glyphosate–resistant crops. Pest management science. 2018;74(5):1035-1039.
CrossRef - Van Bruggen AH, Finckh M, He M, et al. Indirect effects of the herbicide glyphosate on plant, animal and human health through its effects on microbial communities. Frontiers in Environmental Science. 2021;9:763917.
CrossRef - Sviridov A, Shushkova T, Ermakova I, Ivanova E, Epiktetov D, Leontievsky A. Microbial degradation of glyphosate herbicides. Applied biochemistry and microbiology. 2015;51(2):188-195.
CrossRef - Guijarro KH, Aparicio V, De Gerónimo E, et al. Soil microbial communities and glyphosate decay in soils with different herbicide application history. Science of the Total Environment. 2018;634:974-982.
CrossRef - Chávez-Ortiz P, Tapia-Torres Y, Larsen J, García-Oliva F. Glyphosate-based herbicides alter soil carbon and phosphorus dynamics and microbial activity. Applied Soil Ecology. 2022;169:104256.
CrossRef - Bhardwaj L, Reddy B, Nath AJ, Dubey SK. Influence of herbicide on rhizospheric microbial communities and soil properties in irrigated tropical rice field. Ecological Indicators. 2024;158:111534.
CrossRef - Muhammad I, Lv JZ, Wang J, et al. Regulation of soil microbial community structure and biomass to mitigate soil greenhouse gas emission. Frontiers in Microbiology. 2022;13:868862.
CrossRef - Bhardwaj L, Pandey J, Dubey SK. Effects of herbicides on soil enzymes and their regulatory factors in agroecosystem: A Review. Plant, Soil and Microbes in Tropical Ecosystems. 2021:71-100.
CrossRef - Okada E, Costa JL, Bedmar F. Glyphosate dissipation in different soils under no-till and conventional tillage. Pedosphere. 2019;29(6):773-783.
CrossRef - Wirsching J, Wimmer B, Ditterich F, et al. 13C assimilation as well as functional gene abundance and expression elucidate the biodegradation of glyphosate in a field experiment. Environmental Pollution. 2022;306:119382.
CrossRef - Wang S, Han Y, Wu X, Sun H. Metagenomics reveals the effects of glyphosate on soil microbial communities and functional profiles of C and P cycling in the competitive vegetation control process of Chinese fir plantation. Environmental Research. 2023;238:117162.
CrossRef - Overbeek W, Lucotte M, D’Astous-Pagé J, et al. Impacts of cropping systems on glyphosate and aminomethylphosphonic acid contents and microbial community in field crop soils in Quebec (Canada). Agronomy. 2024;14(4):686.
CrossRef - Langarica-Fuentes A, Straub D, Wimmer B, et al. Subtle microbial community changes despite rapid glyphosate degradation in microcosms with four German agricultural soils. Applied Soil Ecology. 2024;198:105381.
CrossRef - Niemeyer JC, de Santo FB, Guerra N, Ricardo Filho AM, Pech TM. Do recommended doses of glyphosate-based herbicides affect soil invertebrates? Field and laboratory screening tests to risk assessment. Chemosphere. 2018;198:154-160.
CrossRef - Nelson DW, Sommers LE. Total carbon, organic carbon, and organic matter. Methods of soil analysis: Part 3 Chemical methods. 1996;5:961-1010.
CrossRef - Nelson DW, Sommers LE. Total nitrogen analysis of soil and plant tissues. Journal of the Association of Official Analytical Chemists. 1980;63(4):770-778.
CrossRef - O’halloran I, Cade-Menun B. Total and organic phosphorus. Soil sampling and methods of analysis. 1993:213-229.
- Vance ED, Brookes PC, Jenkinson DS. An extraction method for measuring soil microbial biomass C. Soil biology and Biochemistry. 1987;19(6):703-707.
CrossRef - Brookes PC, Landman A, Pruden G, Jenkinson D. Chloroform fumigation and the release of soil nitrogen: a rapid direct extraction method to measure microbial biomass nitrogen in soil. Soil biology and biochemistry. 1985;17(6):837-842.
CrossRef - Brookes P, Powlson D, Jenkinson D. Measurement of microbial biomass phosphorus in soil. Soil biology and biochemistry. 1982;14(4):319-329.
CrossRef - Ohya H, Fujiwara S, Komai Y, Yamaguchi M. Microbial biomass and activity in urban soils contaminated with Zn and Pb. Biology and Fertility of Soils. 1988;6(1):9-13.
CrossRef - de Santana H, Toni LR, Benetoli LOdB, Zaia CT, Rosa Jr M, Zaia DA. Effect in glyphosate adsorption on clays and soils heated and characterization by FT–IR spectroscopy. Geoderma. 2006;136(3-4):738-750.
CrossRef - Oksanen J, Kindt R, Legendre P, et al. The vegan package. Community ecology package. 2007;10(631-637):719.
- Ondov BD, Bergman NH, Phillippy AM. Interactive metagenomic visualization in a Web browser. BMC bioinformatics. 2011;12(1):385.
CrossRef - Albers CN, Banta GT, Hansen PE, Jacobsen OS. The influence of organic matter on sorption and fate of glyphosate in soil–Comparing different soils and humic substances. Environmental pollution. 2009;157(10):2865-2870.
CrossRef - Carpio MJ, Rodríguez-Cruz MS, Sánchez-Martín MJ, Marín-Benito JM. Pesticide fate in soils under different agricultural management practices. Pesticides in Soils: Occurrence, Fate, Control and Remediation. Springer; 2021:251-286.
CrossRef - Nguyen DB, Rose MT, Rose TJ, Van Zwieten L. Effect of glyphosate and a commercial formulation on soil functionality assessed by substrate induced respiration and enzyme activity. European Journal of Soil Biology. 2018;85:64-72.
CrossRef - Carretta L, Cardinali A, Onofri A, Masin R, Zanin G. Dynamics of glyphosate and aminomethylphosphonic acid in soil under conventional and conservation tillage. International Journal of Environmental Research. 2021;15(6):1037-1055.
CrossRef - Sebiomo A, Ogundero V, Bankole S. Effect of four herbicides on microbial population, soil organic matter and dehydrogenase activity. African journal of biotechnology. 2011;10(5):770-778.
- Baboo M, Pasayat M, Samal A, Kujur M, Maharana JK, Patel AK. Effect of four herbicides on soil organic carbon, microbial biomass-C, enzyme activity and microbial populations in agricultural soil. Int J Res Environ Sci Technol. 2013;3:100-112.
- Nguyen DB, Rose MT, Rose TJ, Morris SG, Van Zwieten L. Impact of glyphosate on soil microbial biomass and respiration: a meta-analysis. Soil Biology and Biochemistry. 2016;92:50-57.
CrossRef - Geisseler D, Scow KM. Long-term effects of mineral fertilizers on soil microorganisms–A review. Soil Biology and Biochemistry. 2014;75:54-63.
CrossRef - Nivelle E, Verzeaux J, Chabot A, et al. Does nitrogen fertilization history affects short-term microbial responses and chemical properties of soils submitted to different glyphosate concentrations? PLoS One. 2017;12(5):e0178342.
CrossRef - Wang R, Bicharanloo B, Hou E, Jiang Y, Dijkstra FA. Phosphorus supply increases nitrogen transformation rates and retention in soil: a global meta–analysis. Earth’s Future. 2022;10(3):e2021EF002479.
CrossRef - Newman MM, Hoilett N, Lorenz N, et al. Glyphosate effects on soil rhizosphere-associated bacterial communities. Science of the Total Environment. 2016;543:155-160.
CrossRef - Haney R, Senseman S, Hons F, Zuberer D. Effect of glyphosate on soil microbial activity and biomass. Weed science. 2000;48(1):89-93.
CrossRef - Nivelle E, Verzeaux J, Chabot A, et al. Effects of glyphosate application and nitrogen fertilization on the soil and the consequences on aboveground and belowground interactions. Geoderma. 2018;311:45-57.
CrossRef - Fernández-Escalada M, Zulet-González A, Gil-Monreal M, et al. Effects of EPSPS copy number variation (CNV) and glyphosate application on the aromatic and branched chain amino acid synthesis pathways in Amaranthus palmeri. Frontiers in Plant Science. 2017;8:1970.
CrossRef - Mesnage R, Teixeira M, Mandrioli D, et al. Use of shotgun metagenomics and metabolomics to evaluate the impact of glyphosate or Roundup MON 52276 on the gut microbiota and serum metabolome of Sprague-Dawley rats. Environmental health perspectives. 2021;129(1):017005.
CrossRef - Muskus AM, Miltner A, Hamer U, Nowak KM. Microbial community composition and glyphosate degraders of two soils under the influence of temperature, total organic carbon and pH. Environmental Pollution. 2022;297:118790.
CrossRef - Lane M, Lorenz N, Saxena J, Ramsier C, Dick RP. The effect of glyphosate on soil microbial activity, microbial community structure, and soil potassium. Pedobiologia. 2012;55(6):335-342.
CrossRef - Mollaee M, Mobli A, Chauhan BS. The response of glyphosate-resistant and glyphosate-susceptible biotypes of Echinochloa colona to carbon dioxide, soil moisture and glyphosate. Scientific Reports. 2020;10(1):329.
CrossRef - Bonfleur EJ, Tornisielo VL, Regitano JB, Lavorenti A. The effects of glyphosate and atrazine mixture on soil microbial population and subsequent impacts on their fate in a tropical soil. Water, Air, & Soil Pollution. 2015;226(2):21.
CrossRef - Singh M, Awasthi A, Soni SK, Singh R, Verma RK, Kalra A. Complementarity among plant growth promoting traits in rhizospheric bacterial communities promotes plant growth. Scientific reports. 2015;5(1):15500.
CrossRef - Danial R, Sobri S, Abdullah LC, Mobarekeh MN. FTIR, CHNS and XRD analyses define mechanism of glyphosate herbicide removal by electrocoagulation. Chemosphere. 2019;233:559-569.
CrossRef - Gupta P, Pandey K, Verma N. Augmented complete mineralization of glyphosate in wastewater via microbial degradation post CWAO over supported Fe-CNF. Chemical Engineering Journal. 2022;428:132008.
CrossRef - Lupwayi NZ, Fernandez MR, Kanashiro DA, Petri RM. Profiles of wheat rhizobacterial communities in response to repeated glyphosate applications, crop rotation, and tillage. Canadian Journal of Soil Science. 2020;101(1):157-167.
CrossRef - Grenier V, Laur J, Gonzalez E, Pitre FE. Glyphosate has a negligible impact on bacterial diversity and dynamics during composting. Environmental Microbiology. 2023;25(12):2897-2912.
CrossRef - Galic I, Bez C, Bertani I, Venturi V, Stankovic N. Herbicide-treated soil as a reservoir of beneficial bacteria: microbiome analysis and PGP bioinoculants in maize. Environmental Microbiome. 2024;19(1):107.
CrossRef - Caggia V, Waelchli J, Chiaia-Hernandez AC, et al. Glyphosate and terbuthylazine effects on soil functions, microbiome composition and crop performance. Applied Soil Ecology. 2023;191:105036.
CrossRef - Montecchia MS, Tosi M, Soria MA, Vogrig JA, Sydorenko O, Correa OS. Pyrosequencing reveals changes in soil bacterial communities after conversion of Yungas forests to agriculture. PloS one. 2015;10(3):e0119426.
CrossRef - Aslam S, Arslan M, Nowak KM. Microbial activity, community composition and degraders in the glyphosate-spiked soil are driven by glycine formation. Science of the Total Environment. 2024;907:168206.
CrossRef - Liu H, Zhang C, Zhang B, et al. Reapplication of glyphosate mitigate fitness costs for soil bacterial communities. Journal of Environmental Management. 2025;378:124773.
CrossRef - Chen Y, Jiang Y, Huang H, et al. Long-term and high-concentration heavy-metal contamination strongly influences the microbiome and functional genes in Yellow River sediments. Science of the Total Environment. 2018;637:1400-1412.
CrossRef - Cai Y, Chen H, Yuan R, Wang F, Chen Z, Zhou B. Metagenomic analysis of soil microbial community under PFOA and PFOS stress. Environmental Research. 2020;188:109838.
CrossRef - Malla MA, Dubey A, Kumar A, Yadav S. Metagenomic analysis displays the potential predictive biodegradation pathways of the persistent pesticides in agricultural soil with a long record of pesticide usage. Microbiological Research. 2022;261:127081.
CrossRef - Forlani G, Pavan M, Gramek M, Kafarski P, Lipok J. Biochemical bases for a widespread tolerance of cyanobacteria to the phosphonate herbicide glyphosate. Plant and cell physiology. 2008;49(3):443-456.
CrossRef - Spinelli V, Ceci A, Dal Bosco C, Gentili A, Persiani AM. Glyphosate-eating fungi: Study on fungal saprotrophic strains’ ability to tolerate and utilise glyphosate as a nutritional source and on the ability of Purpureocillium lilacinum to degrade it. Microorganisms. 2021;9(11):2179.
CrossRef - Xiao T, Yang L, Zhang D, et al. Early detection of nicosulfuron toxicity and physiological prediction in maize using multi-branch deep learning models and hyperspectral imaging. Journal of Hazardous Materials. 2024;474:134723.
CrossRef
Abbreviations
ASC – Agricultural soil (Control)/ without Glyphosate treatment
AMPA- Aminomethylphosphonic acid
ASC – Agricultural soil (Control)/ without Glyphosate treatment
ASG0 – Agricultural soil (Glyphosate treatment: 0 day)
ASG7 – Agricultural soil (7 days after glyphosate treatment)
ASG14 – Agricultural soil (14 days after glyphosate treatment)
ASG21 – Agricultural soil (21 days after glyphosate treatment)
ASG28 – Agricultural soil (28 days after glyphosate treatment)
BSR – Basal soil respiration
EP- Extractable phosphorous
FTIR – Fourier Transform Infrared Spectroscopy
GLS – Glyphosate
MBC – Microbial biomass carbon
MBN – Microbial biomass nitrogen
MBP – Microbial biomass phosphorous
NCBI – National Center for Biotechnology Information
OC – Organic Carbon
OUT – Operational Taxonomic Unit
PCA – Principal Component Analysis
PCoA – Principal Coordinates Analysis
TN – Total Nitrogen